1788
ANALYSIS USABILITY AND CONTENT IN KNOWN
SYSTEM IMPLEMENTATION
RITAWATI1, AHMAD NURUL FAJAR2
1,2Information Systems Management Department, BINUS Graduate Program - Master of Information
Systems Management, Bina Nusantara University Jakarta, 11480 Indonesia
E-mail:[email protected],[email protected]2
ABSTRACT
The purpose of this study is to analysis usability and content of KNOWN system implementation in Bank Syariah Mandiri (BSM). Based on the data, KNOWN system visitor is less than 10 percent on January to April 2017. The author will conduct research to find out whether the employee's user experience in using KNOWN has gone well or not. This study, will focus on 2 factors in user experience, namely usability and content. This study consists of five steps, such as: (1) Questionnaire Preparation, (2) Questionnaire Distribution, (3) Usability Testing, (4) Analyzing and Data Interpretation, and (5) Recommendation. The results of this study are how good the level of usability and content on the KNOWN site and KNOWN recommendations in the future for the company.
Keywords: Usability, Usability Testing, Knowledge Management System
1. INTRODUCTION
The increasingly rapid technological development in every industry sector, government and private sector, has become a driving force for various companies to make significant efforts to continue to adapt and learn to be able to compete and excel in competition. Knowledge has an important role in the key to the success of the company, where the use and sharing of knowledge can produce innovations and other new ideas to create competitive advantage, especially in the human resources section. Knowledge Management is a process that assists organizations in identifying,
selecting, organizing, disseminating, and
transferring important information and experiences that are part of the organization [1]. Knowledge Management can also be used by companies as a potential human resource development in an organization / company.
Knowledge Management System is a knowledge-based information system that supports the creation, regulation, and dissemination of business knowledge to employees and managers of a company [1]. Portal KMS in a company must be able to facilitate employees to obtain and share knowledge. PT BSM is the largest Islamic Bank in Indonesia. PT BSM has a Knowledge Management System called KNOWN. Based on the number of visits data as of April 2017, of all BSM employees totaling 8,888 employees, there were only 797
employees per month accessing the KNOWN site. As a KMS portal that can be accessed by all employees, user experience is very important. User Experience is able to provide a good perception for someone about system aspects such as utility, ease of use and efficiency. From the explanation above, the author will conduct research to find out whether the employee's user experience in using KNOWN has gone well or not.
2. STATE OF THE ART
There are four factors that play a role in user experience [2], including:
1. Branding, covering all design elements and
relating to the visuals of a website
2. Usability, the ease of using the website for
users, including navigation and accessibility
3. Functionality, is a technology aspect of a
product or application
4. Content, content of a website. Content reflects
the quality, completeness, level of
specialization or generalization and reliability of information included in the website.
The scope of this case study includes KNOWN users, namely employees of PT BSMheadquarters in Jakarta. The factors in usability are divided into 3, namely [3]:
Understandability, is how easy the interface is
1789
Learnability, is how easy the interface can be
learned by the user
Operability, is how easy the interface is
operated by the user
[image:2.612.97.301.202.648.2]Of the above factors, will be divided into several sub-factors described in the table below
Table 1:Usability Subfactor [3]
Code Understandability Factors
U1 Consistency and standardization of text and content through the website
U2 Effectiveness of text and information
U3 Consistency and standardization of graphical
U4 Aesthetics and minimalistic design and structure design, icons and site structure
U5 Considering user’s disability and limitation in the design of the pages
U6 Error prevention
U7 Providing error feedback and handling the error message properly
U8 Visibility of system status for the user
Code Learnability Factors
L1 Effectiveness of help and guidelines
L2 Accessibility of help and guidelines through all pages
L3 Facilities to enhance learning for inexperienced Users
Code Operability Factors
O1 Match between system structure and real world
O2 User control and freedom in the shopping process
O3 Flexibility of the system
O4 Considering cultural issues
O5 Proper navigation facilities
O6 Proper categorization and structure of information
O7 Enjoyment
O8 Keyboard and accessibility
O9 Content
O10 Enhancement of purchase process
O11 Support and interaction with users
O12 Customization user and operability of design
In this study, the author will focus on the
usability dimension which includes:
understandability, learnability and operability and dimensions of content which include: Utility of content, Completeness of information, Subject
Specialization, Reliability of content, and Syntax of content.
[image:2.612.317.523.315.566.2]Content refers to pieces of information in the context of institutions of higher learning that appear in the forms of documents such as reports, theses, dissertation, research papers and articles, which means content refers to pieces of information in the context of higher education institutions that appear in the form of documents such as reports, theses, dissertations, research papers and articles. Content reflects the quality, completeness, level of specialization or generalization and reliability of information included in the website [4]. Content also relates to the responsiveness of a website to satisfy user investigations and beliefs about information, which is included on the site [5].
Table 2: Content Subfactor [5]
Code Utility of content
UC1 The information displayed is always updated
UC2 Capture the degree to which website incorporates essential, useful, trustful
Code Completeness of information
CI1
Captures website is explanatory profile with respect to the information contained within the site
CI2 Information can be interpreted directly
Code Subject Specialization
SS1 Captures the degree to which website offers specific information to those who need it
SS2 Allows users to delve as deeply as needed
Code Reliability of content
RC1
Captures user perception with respect to correctness and trustworthiness of information conveyed by the site.
Code Syntax of Content
SO1 Captures means of content presentation including text, image, voice or graphic data.
SO2 Text and data presentations are easy to understand
According to[5], the factors of content divides into 5 (five), including:
a) Utility of content, which is the level at which a
website combines important, useful and up to date things.
b) Completeness of information, in the form of a
website explanation profile regarding the information contained in the site. Information must be presented in a format that can be used directly
c) Subject Specialization, the level at which the
1790
Questionnaire Preparation
Questionnaire Distibution
Usability Testing
Analyzing & Data Interpretation
Recommendation
d) Reliability of content, captures user perceptions
of the truth and trustworthiness of information submitted by the site.
e) Syntax of content, presentation of content
including text, images, sound or graphic data.
Other research related to usability topics include Usability Testing on Employment Applications by Using the System Usability Scale (Case Study: Bandung Regency Agriculture Service. Evaluating software in which there are 3 database domains, namely employee database, finger print database, and short message service gateway database [6]. The other is Usability Evaluation of the Student Centered e-Learning Environment.This study aims to determine the learning experience of students and teachers in
Student Centered e-Learning Environment,
knowing what aspects must be maintained in SCeLE and to know what aspects must be improved in SCeLE[7], then another research is Usability Testing with USE Questionnaire on SIPOLIN Application in West Java province.This study aims to find out whether the SIPOLIN system will be useful, acceptable and long-lasting [8].Further research is usability testing of a customizable library web portal. This study is a case study that will assess whether students are interested in using portals to conduct research, whether portal features are intuitive and easily personalized and whether My Chicago library helps the research process. The research instruments used in the above research include using questionnaires, interviews and usability testing [9].
Based on these studies, researchers will conduct usability analysis using questionnaires, interviews and usability testing. Meanwhile, for variable content, it will be analyzed by questionnaires and interviews. The resulting data will be analyzed and interpreted which will be explained at a later stage. This research is expected to be able to be a monitoring, learning, and an overview of the realization of the implementation of knowledge management systems in the company environment. Hopefully through the results of this study can be applied in other usability case studies in real terms.
3. METHODOLOGY
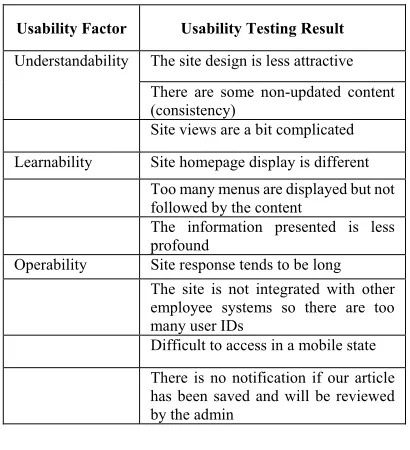
This study consisted of 5 steps. This research is based on the formulation of problems regarding usability & content on the KNOWN site,
[image:3.612.387.477.121.314.2]which can then be formulated into a problem solving method with a number of steps as below.
Figure 1: Research Flow
To answer this problem, there needs to be data obtained from the questionnaire, interview and usability testing. Questionnaires distributed are related to site user experience with variable usability and content. Then, the questionnaire was distributed to employees of the BSM head office. Usability testing is also conducted to find out how well site users are able to use this site. After that, the data obtained from the results of the questionnaire and usability testing will be analyzed to get results and used as recommendations for future site developments. Since 2013, PT BSM has a KMS (Knowledge Management System) portal site called KNOWN. This site has the slogan "Share Everything We Know." With the KNOWN, employees can share information they have and will ultimately impact the knowledge of PT BSM employees. Employees who will access KNOWN,
start by entering the site link at
https://known.bsm.co.id/, then log in using the email & password username used as the corporate email login.
1791 universe in a certain way so that each member of the population or universe has the same opportunity to be chosen or taken. Population is an area of generalization consisting of objects or subjects that have certain qualities and characteristics set by researchers to study and then draw conclusions [10].
The author chooses a population of employees at PT BSM head office by taking samples of employees. In addition, at PT BSM, there is a provision that requires central office employees to post after the employee has completed training. To be able to reach the research sample, the writer uses the formula where the error rate is 0.05 or 5% with a 95% confidence level.
The sample in the population used in this study is n = 1.034 / (1 + 1.034 (0.05) 2) = 288. In this study the author uses a Likert scale in collecting questionnaire data that has a scale of 1 to 5. Likert scale can be used to measure attitudes, opinions and perceptions of a person or group of people about social phenomena. In each statement, the respondent will be given some alternative answers that state the level of respondent's approval of the related question [10]. Alternative answers with Likert scale are divided into 5 categories, namely as follows:
Table 3: Likert Quesstionnare Scale
[image:4.612.312.530.57.405.2]The questionnaire that will be given to the respondent will display questions and statements based on the usability & content sub-factors of KNOWN. The question of usability factors observed in this study is based on three factors previously studied by [11]. As for the question of content factors, adopted from research [12]. The following is an explanation of the factors applied in this study:
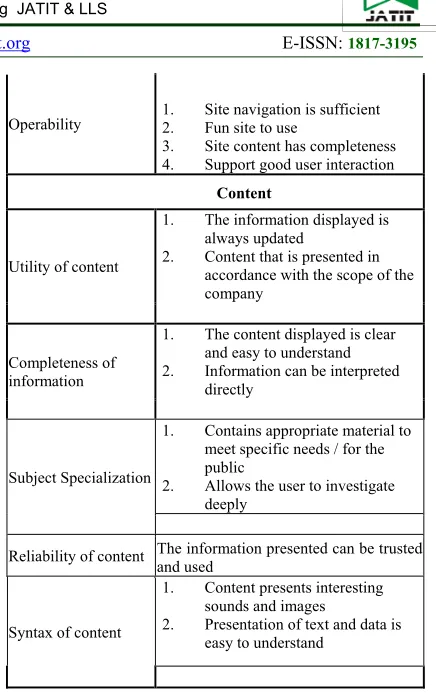
Table 4: Variable Question Division
Variables Indicators
Usability
Understand-ability
1. Visually attractive site design
2. The text and information
presented are effective
3. The site is consistent in content
and visual
4. Site consider restrictions
Learnability
1. The tutorials and guidelines
provided are effective and easily accessible
2. Adequate facilities for new users
studying the site
Operability 1.2. Site navigation is sufficient Fun site to use
3. Site content has completeness
4. Support good user interaction
Content
Utility of content
1. The information displayed is
always updated
2. Content that is presented in
accordance with the scope of the company
Completeness of information
1. The content displayed is clear
and easy to understand
2. Information can be interpreted
directly
Subject Specialization
1. Contains appropriate material to
meet specific needs / for the public
2. Allows the user to investigate
deeply
Reliability of content The information presented can be trusted and used
Syntax of content
1. Content presents interesting
sounds and images
2. Presentation of text and data is
easy to understand
The score is obtained from the results of the questionnaire that will be assessed by a Likert
scale, the average of each question then added to get the average value for the indicator. Questionnaires were distributed in WhatsApp group and email respondents, from the target of 288 respondents, only 211 respondents were collected.
In addition to using a questionnaire, to evaluate usability of the KNOWN site, usability testing is done by testing site users by doing some tasks that are often done by site users. These tasks are used as a means of interaction in measuring usability. The method used is hallway testing with test participants from head office employees taken randomly. The tasks used in usability testing on the KNOWN site include:
1. Login to the KNOWN site using an email
username & password
Categories Code
Strongly Disagree STS
Disagree TS
Neutral N
Agree S
1792
Users Minimum
% found
Mean %
Found SD SE
5 55 85.88 9.2957 0.9295
10 82 94.686 3.2187 0.3218
15 90 97.05 2.1207 0.2121
20 95 98.4 1.608 0.1608
30 97 99 1.1343 0.1464
40 98 99.6 0.8141 0.1051
50 98 100 0 0
2. Using the search bar to find information or
readings that you want
3. Enter to create new items
4. Enter article information
5. Enter content / article content
6. Insert, edit images on articles & give
taxonomy
7. Save articles
[image:5.612.91.299.357.465.2]Furthermore, the implementation of usability testing for variable usability involved 15 respondents from employees of the head office of PT BSM in Jakarta. Usability testing is done face to face directly with the respondent. Determination of the 15 respondents selected was based on the percentage of usability problem findings where with 15 respondents can determine usability problems as much as 90% [13].
Table 5: Percentage of Problem Finding in Usability Testing [13]
Data consists of a group of scores regarding usability & content, measured in a 1-5 scale. Mean is measured for each response that exists [14]. The score criteria used are the average score range (mean) is according to the table below:
Table 6: Average Score Criteria [10]
No.
Average Range (Mean)
Criteria
1 1< X ≤ 1,8 Very Poor / Very Low
2 1,8 < X ≤ 2,6 Poor / Low
3 2,6 < X ≤ 3,4 Fair / Moderate
4 3,4 < X ≤ 4,2 Good / high
5 4,2 < X ≤ 5 Very Good / Very High
Data interpretation in this study consists of alternative solutions and aspects that must be improved in KNOWN. This step is done by grouping data. Data grouping is done based on the severity of problem solving (severity), namely: can not be used (unusable), heavy (severe), moderate
(moderate), and irritating (irritant) [15]. Smaller numbers indicate a problem with a higher impact, so it needs to be solved immediately rather than problems that are grouped in higher numbers. The data grouping obtained from usability testing will be divided according to severity level, namely:
a) Unusable: Problems that exist in this aspect cause some activities cannot be done and are very disturbing to the user. At this level, the problem that occurs usually will cause the user to stop working on the given task
b) Severe: Problems with this aspect sometimes make activities unable to be completed, thus limiting user activity.
c) Moderate: Problems create difficulties in some activities, or activities can be completed but need additional effort from the user to complete the task
d) Irritant: Problems in this aspect tend to be aesthetically related and easy to solve by the user. Problems in this category do not interfere with the user in carrying out the task.
4. RESULTS AND DISCUSSION
After the questionnaire and usability testing have been completed, the data is analyzed according to their needs. Of the 211 respondents, respondents who were female (female) were 91 respondents with a percentage of 43.1% and male (male) of 120 respondents with a percentage of 56.9%. Thus, the largest percentage is found in the male (Male) sex category, which is 56.9%, while the female (Female) percentage is smaller at 43.1%. In terms of age, respondents who were aged 23-30 years were 63 respondents with a percentage of 29.9%, aged 31-40 years as many as 106 respondents with a percentage of 50.2%, and aged over 40 years as many as 42 respondents with a percentage of 19.9%. Thus, the highest percentage is in the age group of 31-40, which is 50.2%, while the smallest percentage is in the age group> 40 years at 19.9%.
1793 Table 7: Data on the distribution of usability testing
participants
Age Amount Percentage
23-30 years 5 33%
31-40 years 6 40%
>40 years 4 27%
Total 15 100
From the results of the score of each questionnaire, it can be seen which items have the lowest or highest mean. The table below shows the average score of each usability statement item.
Table 8: Mean Variable Usability Analysis
No Question Item Mean Deviation Std.
Understandability
1
Site design caught my attention to understanding
the material presented 3.26 0.87
2
The material on this site makes my work more
productive 3.23 0.8
3
I did not find consistency in the content presented
3.06 0.77
4
Tutorials or guidelines provided by the site are
easy to access 3.31 0.81
Learnability
5
Does not require deep understanding to use this
site 3.36 0.86
6 This site is very easy to learn 3.43 0.84
Operability
7 This site really helped me when I wasn't in the office 2.99 0.9
8 This site is fun for its users 3.12 0.82
9
Completeness in this site is very helpful for my needs
3.19 0.79
10 I recommend this site to friends 3.16 0.82
Total Mean 3.21
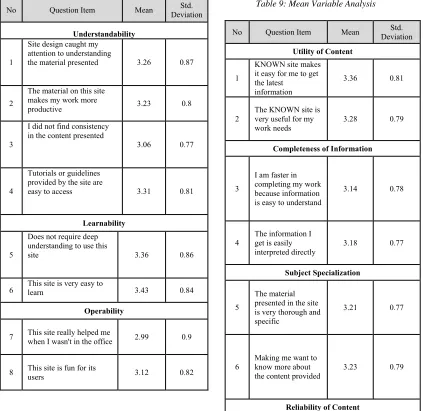
[image:6.612.95.518.309.720.2]Based on the table above, it is known that the total average score is 3.21. This value is in the range of 2.6 <X 4 3.4 or sufficient criteria. The highest mean in the item "This site is very easy to learn" is 3.43, while the lowest mean in the item "This site really helps me when I'm not in the office" is 2.99.
Table 9: Mean Variable Analysis
No Question Item Mean Deviation Std.
Utility of Content
1
KNOWN site makes it easy for me to get the latest
information
3.36 0.81
2
The KNOWN site is very useful for my work needs
3.28 0.79
Completeness of Information
3
I am faster in completing my work because information is easy to understand
3.14 0.78
4
The information I get is easily interpreted directly
3.18 0.77
Subject Specialization
5
The material presented in the site is very thorough and specific
3.21 0.77
6
Making me want to know more about the content provided
3.23 0.79
1794
1 2 3 4 5 6 7 Durasi
1 9:50
2 0:00
3 6:50
4 8:44
5 9:19
6 8:02
7 6:14
8 8:59
9 5:04
10 6:18
11 7:27
12 10:44
13 7:59
14 10:03
15 5:04
Responden Task
7
I believe that information in content can help me in completing work
3.36 0.75
8
The information presented can be used according to my work needs
3.29 0.73
Syntax of Content
9
The existence of sound and images in the content makes me not easily bored when understanding the material
3.4 0.78
10
The text
presentation model
is very interesting 3.16 0.86
Total Mean 3.26
Based on the table above, it is known that the total average score is 3.26. This value is in the range of 2.6 <X 4 3.4 or sufficient criteria. The highest mean in the item "The presence of sounds and images in the content makes me not easily bored when understanding the material" is 3.40, while the lowest mean on the item "I am faster in completing my work because the information is easy to understand" is 3.14.
In addition, respondents were asked to answer questions on the open ended questions at the end of the questionnaire. These questions include interests and reasons for users to enter the KNOWN site. From the results obtained, it can be seen that the category of respondents who were not interested in continuing to visit KNOWN consisted of 57 respondents with a percentage of 27%, while respondents who were interested in continuing to visit KNOWN consisted of 154 respondents with a percentage of 73%. Respondents who intend to visit are again dominated because KNOWN can add insight and keep up to date on information about banking or companies.
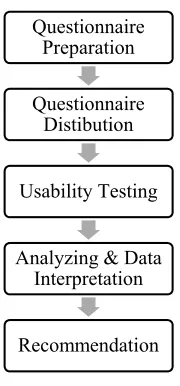
[image:7.612.92.298.72.336.2]The following are the results of usability testing conducted on 15 respondents. This test measures the completion time and success of the tasks that are given.
Figure 4: Usability Testing Results
Information : Success
Success with obstacles Failed
On task 1, it can be seen that there was 1 respondent who failed to login to the KNOWN site. This is because the respondent does not actively open the email, so the respondent needs to clarify the user's email to the admin. In addition, 2 respondents experienced barriers to login due to forgotten passwords.
A respondent who failed to do task 2 because from the first step he could not sign-in on known. There were 2 respondents who failed in task 3, 1 respondent was a respondent who experienced a failure in the previous task (failed login). One respondent failed because he did not find a menu to add an article to his KNOWN site page after logging in. Then, 1 respondent experienced a slight obstacle because when he wanted to click create an article (add new item), the page returned to the homepage and did not change the appearance according to the menu that was clicked.
There were 3 respondents who failed and 3 other respondents experienced obstacles in task 4, the three respondents experienced obstacles because the site response was slow and suddenly returned to the homepage. Whereas, 1 respondent failed because he could not log in from the beginning, 1 other respondent failed because there was no menu display to add an article on his site and 1 respondent failed because he could not enter the article tags which were part of filling out the information.
1795 cannot find an article taxonomy option, so the system notification always delivers incomplete articles, while the other 2 respondents are respondents who failed to continue the task. This is followed by a page that changes to an error. Meanwhile, 2 other respondents experienced obstacles to finding the right taxonomy option.
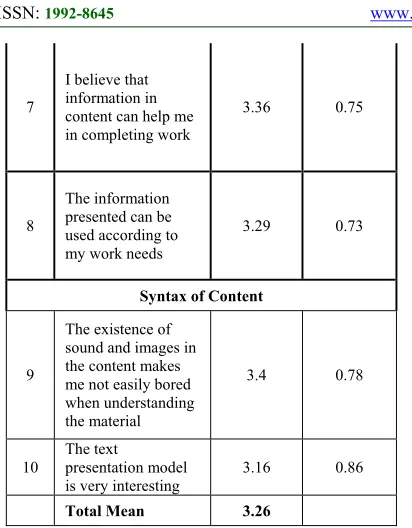
[image:8.612.94.299.318.543.2]Furthermore, 5 respondents experienced a failure on task 7 that is storing articles on the KNOWN site because the articles that will be published incompletely on the criteria and information due to not being able to input tags, choose taxonomy and end with an error page. Then 1 respondent experienced an obstacle in storing the article because the site response was less responsive.
Table 10: Summary of respondents' opinions on usability testing results
Usability Factor Usability Testing Result
Understandability The site design is less attractive
There are some non-updated content (consistency)
Site views are a bit complicated
Learnability Site homepage display is different
Too many menus are displayed but not
followed by the content
The information presented is less
profound
Operability Site response tends to be long
The site is not integrated with other
employee systems so there are too many user IDs
Difficult to access in a mobile state
There is no notification if our article
has been saved and will be reviewed by the admin
5. CONCLUSIONS
Based on the results and discussion described in the previous section, this research can be summarized as follows:
- The level of usability at the KNOWN site can be seen that the usability level has a total average score of 3.21. This value is in the range of 2.6 <X 4 3.4 or sufficient criteria. The highest mean in the item "This site is very easy to learn" is 3.43. while the lowest mean in the item "This site really helped me when I wasn't in the office" was 2.99.
- Content level has a total average score of 3.26. This value is in the range of 2.6 <X 4 3.4 or sufficient criteria. The highest mean in the
item "The presence of sounds and images in the content makes me not easily bored when understanding the material" is 3.40, while the lowest mean on the item "I am faster in completing my work because the information is easy to understand" is 3.14.
- Recommendations to improve usability on KNOWN sites are, as follows:
• Develop the KNOWN site so that it can be accessed anywhere to facilitate employees in their work
• Adding or updating content contained on the KNOWN site, and
• Making the site integrated with other employee systems (mandatory) so that users easily access
- Recommendations to improve content on known sites, including:
• Improve the quality of information so that it can be easily understood by users,
• Change the appearance of the text presentation model so that users are interested, and
• Adding steps to the "help" menu or adding the FAQ (Frequently Asked Question) feature on the website to make it easier for users to interpret information directly
5.1 Suggestion
The suggestion in this study is that usability evaluation on KNOWN sites can be done periodically by BSM so that it can be a milestone between goals and realization. With the results of the evaluation, the manager of the KNOWN site can improve site performance that is more directed, effective and efficient. The management of BSM must be more vigorous in socializing KNOWN and giving appreciation to employees for increasing motivation and using KNOWN in the BSM internal environment.
REFERENCES:
[1] Karsen, Marisa. (2014). Pentingnya Knowledge Management System bagi Perusahaan. Binus Article.(http://sis.binus.ac.id/2014/05/07/pentin gnya-knowledge-management-system-bagi-perusahaan/), 24 August 2018
[2] Rubinoff, R. (2004). How to Quantify the User
Experience. Retrieved from
www.sitepoint.com/print/quantify-user-experience
[3] Dehbozorgi, & Jafari. (2012) International
Journal of Computer. Proposing a Methodology
1796 QUEM Model School of e-Learning, Shiraz University
[4] Sreedhar, G. (2016). Design Solutions for Improving Website Quality and Effectiveness. IGI Global. USA.
[5]Moustakis, V, et. Al. (2004). Website Quality Assessment Criteria (Research paper: IQ Concepts, Tools, Metrics, Measures and Methodologies). Department of Production and Management Engineering, Technical University of Crete, Chania, Greece.
[6] Pudjoatmodjo, B & Wijaya, R. (2016). Tes Kegunaan (Usabilty Testing) Pada Aplikasi Kepegawaian Dengan Menggunakan System Usabilty Scale (Studi Kasus: Dinas Pertanian Kabupaten Bandung). Seminar Nasional Teknologi Informasi dan Multimedia 2016, STMIK AMIKOM Yogyakarta, 6-7 Februari 2016.
[7] Junus, Santoso, Isal and Utomo. (2015). Usability Evaluation of Student Centered e-Learning Environment. International Review of Research in Open and Distributed Learning, 16, Number 4
[8] Firmansyah, R. (2018). Usability Testing dengan USE Questionnaire Pada Aplikasi SIPOLIN Provinsi Jawa Barat. Jurnal Swabumi, 6, 1-7. [9] Brantley, S. (2006) Usability Testing of a
Customizable Library Web Portal.
https://www.researchgate.net/publication/24242 8555_Usability_Testing_of_a_Customizable_Li brary_Web_Portal, 24 August 2018
[10] Sugiyono. (2013). Metode Penelitian dan Pengembangan: Research abd Development Untuk Bidang: Pendidikan, Manajemen, Sosial, Teknik. Bandung: Alfabeta.
[11] Lewis, J. (1995). IBM Computer Usability
Satisfaction Questionnaires: Psychometric
Evaluation and Instructions for Use.
International Journal of Human-Computer Interaction, 57-78.
[12] Scott, Judy. (2011). User Perception of an Enterprise Content Management System. Hawaii International Conference on System Sciences. University Colorado Denver.
[13] Faulkner, L. (2003). Beyond the five-user assumption: Benefits of increased sample sizes in usability testing. Behavior Research Methods, Instuments & Computer, 379-383.
[14] Boone, D. A., Boone, H. N. (2012). Analyzing Likert Data. Journal of Extension, 1-5.
![Table 1:Usability Subfactor [3]](https://thumb-us.123doks.com/thumbv2/123dok_us/8900056.954520/2.612.97.301.202.648/table-usability-subfactor.webp)
![Table 5: Percentage of Problem Finding in Usability Testing [13]](https://thumb-us.123doks.com/thumbv2/123dok_us/8900056.954520/5.612.91.299.357.465/table-percentage-problem-finding-usability-testing.webp)