www.hydrol-earth-syst-sci.net/20/1049/2016/ doi:10.5194/hess-20-1049-2016
© Author(s) 2016. CC Attribution 3.0 License.
Fault damage zone volume and initial salinity distribution determine
intensity of shallow aquifer salinisation in subsurface storage
Elena Tillner1, Maria Langer1, Thomas Kempka1, and Michael Kühn1,2
1GFZ German Research Centre for Geosciences, Telegrafenberg, 14473 Potsdam, Germany
2University of Potsdam, Institute of Earth- and Environmental Science, Karl-Liebknecht-Str. 24/25, 14476 Potsdam, Germany
Correspondence to: Elena Tillner ([email protected])
Received: 21 April 2015 – Published in Hydrol. Earth Syst. Sci. Discuss.: 16 June 2015 Revised: 2 December 2015 – Accepted: 11 February 2016 – Published: 8 March 2016
Abstract. Injection of fluids into deep saline aquifers causes
a pore pressure increase in the storage formation, and thus displacement of resident brine. Via hydraulically conductive faults, brine may migrate upwards into shallower aquifers and lead to unwanted salinisation of potable groundwater re-sources. In the present study, we investigated different sce-narios for a potential storage site in the Northeast German Basin using a three-dimensional (3-D) regional-scale model that includes four major fault zones. The focus was on as-sessing the impact of fault length and the effect of a sec-ondary reservoir above the storage formation, as well as model boundary conditions and initial salinity distribution on the potential salinisation of shallow groundwater resources. We employed numerical simulations of brine injection as a representative fluid.
Our simulation results demonstrate that the lateral model boundary settings and the effective fault damage zone vol-ume have the greatest influence on pressure build-up and de-velopment within the reservoir, and thus intensity and dura-tion of fluid flow through the faults. Higher vertical pressure gradients for short fault segments or a small effective fault damage zone volume result in the highest salinisation poten-tial due to a larger vertical fault height affected by fluid dis-placement. Consequently, it has a strong impact on the degree of shallow aquifer salinisation, whether a gradient in salin-ity exists or the saltwater–freshwater interface lies below the fluid displacement depth in the faults. A small effective fault damage zone volume or low fault permeability further extend the duration of fluid flow, which can persist for several tens to hundreds of years, if the reservoir is laterally confined. Lat-erally open reservoir boundaries, large effective fault dam-age zone volumes and intermediate reservoirs significantly
reduce vertical brine migration and the potential of freshwa-ter salinisation because the origin depth of displaced brine is located only a few decametres below the shallow aquifer in maximum.
The present study demonstrates that the existence of hy-draulically conductive faults is not necessarily an exclusion criterion for potential injection sites, because salinisation of shallower aquifers strongly depends on initial salinity distri-bution, location of hydraulically conductive faults and their effective damage zone volumes as well as geological bound-ary conditions.
1 Introduction
depths (Dempsey et al., 2014; Fitts and Peters, 2013; Chiara-monte et al., 2008; IEAGHG, 2008; Bense and Person, 2006; Forster and Evans, 1991).
Displacement of brine and potential freshwater salini-sation as a result of CO2 storage has been investigated in several studies. Table 1 summarises the initial condi-tions and essential results of numerical simulacondi-tions con-cerning this issue. The models applied are either synthetic (Birkholzer et al., 2009, 2011; Oldenburg and Rinaldi, 2011) or refer to a certain study area (Tillner et al., 2013a; Zouh et al., 2010; Yamamoto et al., 2009; Nicot, 2008). Several studies examine pressure perturbation and resulting brine migration in a multi-barrier system without considering vertical conduits. It was shown that pressure build-up can be observed at a distance of more than 100 km from the injection zone (Birkholzer et al., 2009). The choice of boundary con-ditions and petrophysical parameters have a crucial impact on the pressure propagation, as demonstrated by two inde-pendent studies considering industrial-scale CO2injection in the Illinois Basin (Person et al., 2010; Zhou et al., 2010). According to Person et al. (2010), the pressure perturba-tion is limited to a distance of about 25 km from the injec-tion locainjec-tion for a total injecinjec-tion rate of 80 Mt CO2year−1, whereas Zhou et al. (2010) simulated a pressure build-up as far as 300 km from the injection area (100 Mt CO2year−1). The disparity between the simulation results is mainly re-lated to the fact that Person et al. (2010) assumed consider-ably lower reservoir formation permeability, higher forma-tion compressibility and closed lateral flow boundaries ex-cept for the northern model domain, whereas Zhou et al. (2010) applied laterally open flow boundaries (Table 1).
However, upward brine migration only occurs if pres-sure perturbation in the reservoir is large enough to over-come the weight of the fluid column in a vertical conduit. Whether a steady state is reached or continuous flow de-velops further depends on the magnitude of pressure in-crease, and whether brine is allowed to spread unhindered in the upper aquifer due to a continuous hydraulic con-nection throughout the formation without barriers to flow (Birkholzer et al., 2011; Oldenburg and Rinaldi, 2011). As stated previously, faults, in particular, can represent vertical conduits, which may have an essential influence on ground-water flow and brine migration due to their extent and dis-tribution in the Earth’s upper crust. Nevertheless, a meaning-ful implementation of complex geological structures into a sufficiently discretised model grid is difficult, especially at a regional scale. Tillner et al. (2013a) investigated the influ-ence of permeable faults on brine displacement referring to a real study area. The authors simulated upward brine mi-gration through complex fault systems depending on reser-voir compartmentalisation and fault permeability, whereby faults were implemented by the virtual element approach (Nakaten et al., 2013). The results of Tillner et al. (2013a) showed that the degree of pressurisation is the driving mech-anism for brine migration, while an increase of fault
per-meability from 100 mD by 2 orders of magnitude had no significant impact on the salinisation of shallower aquifers. Their investigations focused on the prospective storage site Beeskow–Birkholz (in the following only referred to as Beeskow) in northeast Germany, which is also considered in this work.
Here, we present a regional-scale 3-D model with a simpli-fied geometry, neglecting topographic variations of the for-mation tops and bases, while the four considered fault zones are implemented with their complex arrangement and cur-vature to focus the analysis on clearly identifiable effects of fault fluid flow. The presumed simplifications further signif-icantly improved the convergence efficiency of the simula-tions and avoided numerical artefacts. In different leakage scenarios the impact of fault lengths, hydrogeological bound-ary conditions, initial salinity distribution and the presence of an overlying secondary reservoir on upward brine displace-ment were assessed to deepen our understanding on poten-tial freshwater salinisation resulting from fluid injection into deep saline formations.
2 Study area
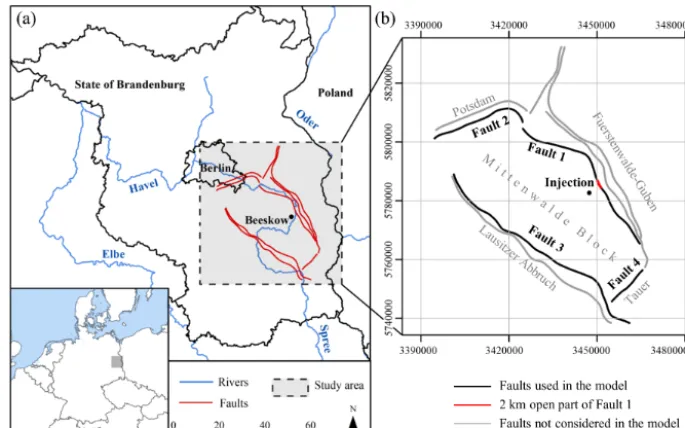
The potential CO2 storage site is located close to the town Beeskow in the Northeast German Basin (NEGB; Fig. 1a). In a respective industrial project and according to the estimated storage capacity, it was planned to inject 34 Mt CO2over a period of 20 years (1.7 Mt CO2year−1)into the basal sand-stones of the Detfurth Formation from the Middle Buntsand-stein (Lower Triassic); (Vattenfall, 2009, 2010). Porous and fractured sediments of the Lower Muschelkalk (Middle Tri-assic) represent a secondary suitable reservoir above the target storage horizon (Fig. 2a). A multi-barrier system of different cap rocks, mainly anhydrites, halites and clay-stones from the Upper Buntsandstein, the Middle and Up-per Muschelkalk, as well as the Lower KeuUp-per seals the Det-furth Formation and the overlying secondary reservoirs. The basal sandstones of the Rupelian (Oligocene, Upper Tertiary) at a depth between 100 and 150 m in average mark the be-ginning of saltwater-bearing aquifers in the area (Kempka et al., 2015a; Grube et al., 2000; Hannemann and Schirrmeister, 1998; Stackebrandt, 1998).
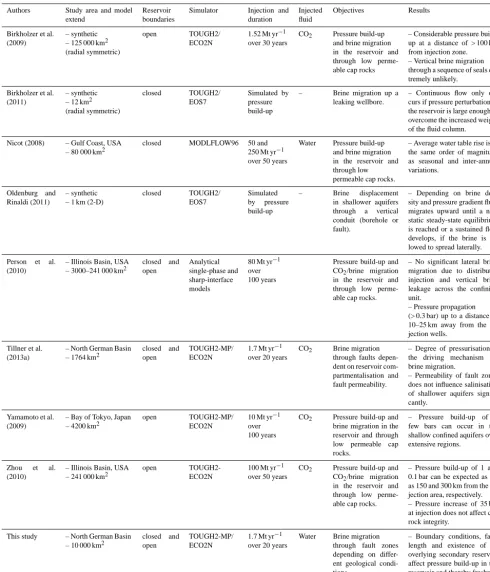
Table 1. Summary of numerical simulations of brine migration resulting from CO2injection.
Authors Study area and model extend
Reservoir boundaries
Simulator Injection and duration
Injected fluid
Objectives Results
Birkholzer et al. (2009)
– synthetic – 125 000 km2 (radial symmetric)
open TOUGH2/ ECO2N
1.52 Mt yr−1
over 30 years
CO2 Pressure build-up
and brine migration in the reservoir and through low perme-able cap rocks
– Considerable pressure build-up at a distance of > 100 km from injection zone. – Vertical brine migration through a sequence of seals ex-tremely unlikely.
Birkholzer et al. (2011)
– synthetic – 12 km2 (radial symmetric) closed TOUGH2/ EOS7 Simulated by pressure build-up
– Brine migration up a leaking wellbore.
– Continuous flow only oc-curs if pressure perturbation in the reservoir is large enough to overcome the increased weight of the fluid column. Nicot (2008) – Gulf Coast, USA
– 80 000 km2
closed MODLFLOW96 50 and 250 Mt yr−1 over 50 years
Water Pressure build-up and brine migration in the reservoir and through low permeable cap rocks.
– Average water table rise is in the same order of magnitude as seasonal and inter-annual variations.
Oldenburg and Rinaldi (2011)
– synthetic – 1 km (2-D)
closed TOUGH2/ EOS7
Simulated by pressure build-up
– Brine displacement in shallower aquifers through a vertical conduit (borehole or fault).
– Depending on brine den-sity and pressure gradient fluid migrates upward until a new static steady-state equilibrium is reached or a sustained flow develops, if the brine is al-lowed to spread laterally. Person et al.
(2010)
– Illinois Basin, USA – 3000–241 000 km2
closed and open Analytical single-phase and sharp-interface models
80 Mt yr−1 over 100 years
Pressure build-up and CO2/brine migration
in the reservoir and through low perme-able cap rocks.
– No significant lateral brine migration due to distributed injection and vertical brine leakage across the confining unit.
– Pressure propagation (> 0.3 bar) up to a distance of 10–25 km away from the in-jection wells.
Tillner et al. (2013a)
– North German Basin – 1764 km2
closed and open
TOUGH2-MP/ ECO2N
1.7 Mt yr−1
over 20 years
CO2 Brine migration
through faults depen-dent on reservoir com-partmentalisation and fault permeability.
– Degree of pressurisation is the driving mechanism for brine migration.
– Permeability of fault zones does not influence salinisation of shallower aquifers signifi-cantly.
Yamamoto et al. (2009)
– Bay of Tokyo, Japan – 4200 km2
open TOUGH2-MP/ ECO2N
10 Mt yr−1 over 100 years
CO2 Pressure build-up and
brine migration in the reservoir and through low permeable cap rocks.
– Pressure build-up of a few bars can occur in the shallow confined aquifers over extensive regions.
Zhou et al. (2010)
– Illinois Basin, USA – 241 000 km2
open TOUGH2-ECO2N
100 Mt yr−1 over 50 years
CO2 Pressure build-up and
CO2/brine migration
in the reservoir and through low perme-able cap rocks.
– Pressure build-up of 1 and 0.1 bar can be expected as far as 150 and 300 km from the in-jection area, respectively. – Pressure increase of 35 bar at injection does not affect cap rock integrity.
This study – North German Basin – 10 000 km2
closed and open
TOUGH2-MP/ ECO2N
1.7 Mt yr−1 over 20 years
Water Brine migration through fault zones depending on differ-ent geological condi-tions.
Figure 1. (a) Dashed rectangle indicates the location of the study area in the state of Brandenburg (Germany), while red lines illustrate the present fault systems. (b) Only the inner faults (black lines), facing to the injection well, were implemented to represent the entire fault zone. Axes show UTM-coordinates (WGS84/UTM zone 33N). Rivers and the outline of the states of Brandenburg and Berlin were derived from Tillner et al. (2013a).
Figure 2. (a) Stratigraphy of the study area with the active model layers highlighted in red. (b) The geological 3-D model with simplified topography comprises up to three layers.
3 Geological model
We used the Petrel software package (Schlumberger, 2011) for the 3-D geological model construction and the subsequent gridding process, and the reservoir simulator TOUGH2-MP/ECO2N for 3-D multi-component flow simulations (Pruess, 2005; Zhang et al., 2008). All simulations were con-ducted on a high-performance computing system with 256
cores. Finally, results were imported back into Petrel for vi-sualisation purposes.
3.1 Set-up
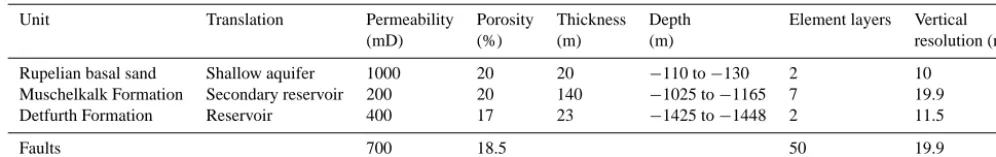
[image:4.612.127.470.66.280.2] [image:4.612.121.474.353.548.2]Table 2. Vertical grid discretisation, depth and hydraulic parameters for the active geological units.
Unit Translation Permeability Porosity Thickness Depth Element layers Vertical
(mD) (%) (m) (m) resolution (m)
Rupelian basal sand Shallow aquifer 1000 20 20 −110 to−130 2 10
Muschelkalk Formation Secondary reservoir 200 20 140 −1025 to−1165 7 19.9
Detfurth Formation Reservoir 400 17 23 −1425 to−1448 2 11.5
Faults 700 18.5 50 19.9
Formation as lowermost reservoir (Fig. 2b). The Rupelian basal sand is 20 m thick and located at a depth of 110 m (Grube et al., 2000). The Lower Muschelkalk Formation is at 1025 m depth and has a thickness of 140 m, while the reser-voir is at 1425 m depth with a thickness of 23 m (Tillner et al., 2013a). Figure 2b shows the geological model with a regu-lar lateral grid resolution of 250 m×250 m. The vertical dis-cretisation depends on the different model layers, and ranges between 10 and 19.9 m (Table 2).
In a previous study, Kühn and Kempka (2015) investigated the influence of cap rock permeabilities on shallower aquifer salinisation at the prospective storage site Beeskow. Their results showed that for cap rock permeabilities equal to or lower than 10−17m2no increase in salt concentration in for-mations above the reservoir is to be expected. The top forma-tion seal in the study area mainly consists of marine evapo-rates, such as anhydrite and halite, with a total thickness of up to 180 m. We therefore defined the cap rocks as impermeable for fluid flow in all simulations. Thus, only the faults pro-vide a hydraulic connection between the shallow aquifer and the reservoir. Accordingly, the elements of the faults as well as the different reservoir layers were “active” in the simula-tions, whereby the elements representing the cap rocks were not considered.
Within our model only the inner faults, which enclose the Mittenwalde Block, were implemented as a representation of the entire fault zone (Fig. 1b). Fault-related parameters were assigned to the elements located at the respective vertical fault plane. The fault element width of 250 m corresponds to the overall lateral grid resolution. This element width is rel-atively large but still realistic, since all regional fault zones consist of several individual faults and show considerable displacements between a few hundred metre to 1000 m. In general, fault offset is linked to the width of the damage zone (Faulkner et al., 2010; Mitchel and Faulkner, 2009; Wib-berley et al., 2008). For example, faults with displacements between 10 and 1000 m can have damage zone widths be-tween tens and hundreds of metres. However, there exists no simple relationship, since the width of the damage zone is highly dependent on lithology, pressure, temperature and strain rate during shear and potentially tensile deformation (Shipton et al., 2006). Due to the relatively steep inclination of all faults and to maintain maximum grid regularity, the dip angle was neglected in the present model and all faults
were assumed to be strictly vertical. In the following, the Fuerstenwalde–Guben fault zone is addressed as Fault 1. The Potsdam, the Lausitzer Abbruch and the Tauer fault zones are referred to as Faults 2, 3 and 4, respectively (Fig. 1b).
3.2 Parameterisation
All lithological units were parameterised according to Till-ner et al. (2013a) and Vattenfall (2009), with values de-rived from borehole data and literature, and modelled as ho-mogenous and isotropic. The Detfurth Formation has a per-meability of 400 mD, while the overlying secondary reser-voir (Muschelkalk Formation) is characterised by a perme-ability of 200 mD (Table 2). Porosity and permeperme-ability of the Rupelian basal sand was chosen according to Tesch et al. (1987). Fault permeability was assumed higher than that of the host rock, because of fault-parallel permeability en-hancement of the damage zone due to the presence of a frac-ture network (Jourde et al., 2002; Caine et al., 1996). A lat-eral barrier to groundwater flow due to a low permeable fault core was not directly considered in the simulations. However, as a conservative approach we assume that hydraulic proper-ties of the fault damage zones are in between those of the Rupelian basal sand and the Detfurth Formation to promote upward brine displacement instead of cross-fault flow.
Because faults have a smaller offset at their boundaries, and consequently a less distinct damage zone, it was pre-sumed that permeability declines in these areas. This was implemented into the model by using permeability multipli-ers in the respective elements. The permeability declines lin-early towards the ends of the fault, applied to the first and last 15 % of its length. In the following, the Detfurth Formation, Muschelkalk Formation and Rupelian basal sand are referred to as reservoir, secondary reservoir and shallow aquifer, re-spectively (Fig. 2b; Table 2).
3.3 Initial and boundary conditions
multiplication), depending on the investigated scenario. The higher volume multiplication at the boundary elements of the Tertiary shallow aquifer is based on the assumption that a continuous hydraulic connection throughout the formation is more likely in the younger and less consolidated sedimen-tary deposits than in the more tectonically influenced deeper rocks. For the temperature distribution, a constant geother-mal gradient of 30◦C km−1was used, starting from 15◦C at the model top. All simulations were performed at isothermal conditions. Salinity is assumed to increase with depth either by a gradient of 0.23 g kg−1solution per metre from zero at the base of the shallow aquifer up to a maximum of 25 % at a depth of 1070 m (Vattenfall, 2009). A second realisation considers a sharp freshwater–saltwater interface at the base of the shallow aquifer with a constant salinity of 25 %. The latter conditions were chosen, as they lead to the maximum possible salinisation in the uppermost aquifer, and thus rep-resent the most unfavourable scenario for shallow aquifers under the given assumptions.
In the respective industrial project at the Beeskow storage site, it was planned to inject 34 Mt of CO2over a time span of 20 years into the Mesozoic formations at the top of an an-ticline structure (Tillner et al., 2013a). In the present study, we chose a conservative approach and simulated the injec-tion of the equivalent volume of brine into the storage forma-tion, which enables us also to study the long-term effects of brine displacement more than 1000 years after the injection stop. Without topographic variations in the reservoir, CO2 is not immobilised in structural traps (e.g. below an anticline top) and might reach the Fuerstenwalde–Guben fault zone lo-cated at a distance of 4 km from the injection well over such a long simulation period. Potential CO2leakage into overly-ing formations should not be the focus of investigation in the present study. In addition, initial testing has shown that the difference in pressure response at the fault from using a two-phase model instead of single-two-phase model is small, com-pared to other effects studied here. Furthermore, with such a model we keep the findings of injection-related brine dis-placement transferable to various other types of subsurface storage. All simulations start from hydrostatic pressure con-ditions. Considering the density of brine, pressure at the top of the reservoir at 1425 m depth is approximately 165 bar. At a reservoir temperature of 58◦C, the resulting CO2 density is 668.5 kg m−3 (Span and Wagner, 1996). Taking into ac-count the salinity of 25 % in the reservoir, brine density is 1175 kg m−3. Thus, a volume equivalent mass of 59.76 Mt brine was injected into the reservoir, corresponding to a rate of 94.6 kg s−1.
Brine densities are calculated in TOUGH2-MP/ECO2N for each element during the simulation and fluid compress-ibility is then considered by its density changes. Pore com-pressibility causes a higher storage coefficient in the forma-tions when pressure increases. Since our simulaforma-tions should show the greatest possible effect on brine displacement, pore compressibility was neglected. Assuming a fluid
diffu-sion coefficient of 2×10⁻⁹m2s−1and a sharp freshwater– saltwater interface in the fault, it would take about 1 mil-lion years in the present model for the salinity front to prop-agate into a neighbouring element. We therefore neglected diffusion as well.
4 Set of scenarios
In total, 19 scenarios were selected to investigate the con-ditions for upward brine flow through the faults. Different fault lengths and permeabilities, hydrogeological boundary conditions and vertical salinity distributions, as well as the presence of a secondary reservoir formation above the target storage horizon, were considered. Scenarios are identified by the following abbreviations:
Scenario=FnlBO/CSRk,
whereF denotes fault with the coefficientsl indicating the total fault length andnthe number of active faults. Further, the lateral boundary conditions (B) of both reservoirs can be either open (O) or closed (C). SR denotes that an overlying secondary reservoir exists andk specifies the permeability of that reservoir. Scenarios in which a salinity gradient was applied are marked with “∗”. All simulated scenarios with their varying initial and boundary conditions are summarised in Tables 3 and 4.
The base cases consist of two layers, while three differ-ent fault lengths were considered. Either all four fault zones with a total length of 193 km were assumed to be permeable, or Fault 1 was defined to be hydraulically conductive with a length of 60 km. In the third case, only a length of 2 km in the central part of Fault 1 was presumed to be open for fluid flow (Fig. 1b). Based on the effective porosity assumed for all fault zones and the total fault element volumes, the effective damage zone volume for the three different cases can be specified with 1.6×10¹⁰m3(fault length of 193 km), 4.9×10⁹m3(fault length of 60 km) and 1.8×10⁸m3(fault length of 2 km). For all these cases, scenarios with both open and closed reservoir boundaries as well as an overlying sec-ondary reservoir were examined to illustrate the entire range of a potential freshwater salinisation depending on the given geological constraints.
5 Results
Table 3. Overview of all calculated scenarios assuming a fault permeability of 700 mD. Maximum pressure increase at the base of Fault 1 and displacement depths in Fault 1 are observed at the central part of the fault.
Shallow aquifer Scenario Fault length
(km)
Effective dam-age zone vol-ume (m3)
Pressure increase at base of Fault 1 (bar)a
Maximum displacement depth in Fault 1 (m)ab
Relative salt mass change (kg)a
Salinisation area (km2)ac
Average salt mass in salini-sation area (kg m−2)a
Duration of mass flow (years)d
F12 kmBC 2 1.8×10⁸ 19.0 131.7 6.17×10⁹ 19.8 311.6 330 F12 kmBO 12.4 105.4 4.86×10⁹ 16.4 296.3 31 F12 kmBCSR200 mD 9.0 69.5 2.93×10⁹ 14.1 207.8 1050 F12 kmBOSR200 mD 6.1 56.3 2.34×10⁹ 12.4 188.7 31 F12 kmBC∗ 18.9 131.7 5.80×10⁸ 21.1 27.5 275
F160 kmBC 60 4.9×10⁹ 12.1 29.8 1.08×10¹⁰ 76.5 141.2 115
F160 kmBO 9.7 28.4 8.45×10⁹ 67.3 125.6 31
F160 kmBCSR200 mD 6.8 17.0 5.36×10⁹ 58.9 91.0 390 F160 kmBOSR200 mD 5.3 16.3 4.16×10⁹ 50.9 81.7 40 F1193 km−4 BC 193 1.6×10¹⁰ 11.0 28.6 1.23×10¹⁰ 146.1 84.2 66 F1193 km−4 BO 9.6 28.0 9.46×10⁹ 121.3 78.2 42 F193 km
1−4 BCSR200 mD 6.4 16.5 6.64×10⁹ 114.0 58.3 225 F1193 km−4 BOSR200 mD 5.3 16.1 4.59×10⁹ 90.1 50.9 45 F1193 km−4 BOSR2000 mD 1.2 4.0 1.06×10⁹ 60.3 17.6 23 F1193 km−4 B∗C 10.9 28.6 1.67×10⁸ 16.6 10.1 66
at=20 years;bcounting from the base of the shallow aquifer;csalt concentration > 0.5 g kg−1solution;dmass flow into the shallow aquifer > 0.1 kg s−1;∗salinity gradient of 0.23 g kg−1solution per metre
Table 4. Overview of six scenarios assuming a sharp saltwater–freshwater interface below the base of the shallow aquifer and a fault permeability of 10, 200 and 700 mD. Maximum pressure increase at the base of Fault 1 and displacement depths in Fault 1 are again observed at the central part of the fault.
Shallow aquifer
Scenario Fault permeability (mD)
Pressure increase at base of Fault 1 (bar)b
Maximum dis-placement depth in fault (m)ab
Relative salt mass change (kg)ab
Salinisation area (km2)ac
Average salt mass in salini-sation area (kg m−2)a
Duration of mass flow (years)d
F1193 km−4 BCSR200 mD 10 12.1 9.1 5.15×10⁹ 101.7 50.6 310
200 7.0 17.9 6.50×10⁹ 111.4 58.3 270
700 6.4 16.5 6.64×10⁹ 114.0 58.3 225
F1193 km−4 BOSR200 mD 10 10.9 8.7 3.66×10⁹ 89.1 41.1 46
200 5.9 17.6 4.52×10⁹ 85.8 52.7 45
700 5.3 16.1 4.59×10⁹ 90.1 50.9 45
at=20 years ;bcounting from the base of the shallow aquifer;csalt concentration > 0.5 g kg−1solution;dmass flow into the shallow aquifer > 0.1 kg s−1
the fault(s) increases from zero at the base of the shallow aquifer to a maximum of 25 % at a depth of 1070 m. Fault permeability is 700 mD in all investigated scenarios, except for the comparison presented in Sect. 5.4, where duration of mass flow and shallow aquifer salinisation are also investi-gated for lower fault permeabilities of 10 and 200 mD. In Sect. 5.5, it is shown how a secondary reservoir with a per-meability higher than that of the faults affects upward brine migration.
5.1 General outcomes
In all simulations, an injection-related pattern in pressure dis-tribution and fluid flow can be observed. Figure 3 shows the
[image:7.612.44.549.386.519.2]Figure 3. In all scenarios, brine is displaced radially within the reservoir and predominantly into parts of the faults lying closer to the injection well as illustrated for ScenarioF1193 km−4 BO.
in the Mittenwalde Block, so that flow out of all faults to-wards the lateral boundaries dominates at the final injection stage, since brine is displaced away from the point of the highest pressure build-up.
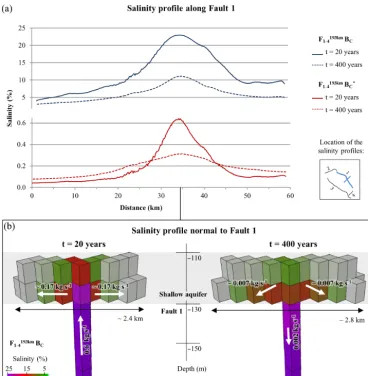
Duration and intensity of fluid flow determine the spatial distribution of displaced brine. In all scenarios, maximum mass flow is observed along Fault 1 close to the injection point decreasing towards the fault edges. This pattern is re-flected in the salinisation of the freshwater aquifer, as shown in Fig. 4a. A maximum salinity in the shallow aquifer is reached at the end of the injection period in the central part of Fault 1, irrespective of whether a sharp saltwater–freshwater boundary at the base of the shallow aquifer (e.g. Scenario
F1193 km−4 BC)or a salinity gradient (ScenarioF1193 km−4 B
∗
C)was applied. Salt concentrations then decrease continuously to-wards the fault edges by more than 80 %. Salinity levels are generally the highest within the lower element layer, indicat-ing that the denser saline water preferably spreads along the base of the aquifer (Fig. 4b). Decreasing upward brine dis-placement after the injection stop causes a downward flow of the denser saline water, which consequently accumulates at the base of the shallow aquifer. Moreover, a slight back-flow into the fault occurs due to the increased weight of the water column. Hence, the salinity in the shallow aquifer slightly decreases after a simulated time of a few hundred years (Fig. 4b).
5.2 Fault length/effective damage zone volume
The impact of the hydraulic conductive fault length on shal-low aquifer salinisation is presented in the folshal-lowing (Ta-ble 3).
Figure 5a shows that overpressures in the reservoir are generally the highest assuming laterally closed reservoir boundaries. The pressure development at the base of Fault 1 indicates that pressure increases until the injection stop af-ter 20 years (Fig. 5b). In the case of a hydraulic conductive fault segment with a length of 2 km only, brine displacement, and thus pressure dissipation occurs over the smallest area. Consequently, the highest pressure build-up at the injection point (89.9 bar) and the base of Fault 1 (19.0 bar), into which brine is predominantly displaced, is observed for Scenario
F12 kmBC (Table 3). A greater effective fault damage zone volume reduces the pressure increase at the base of Fault 1 to 12.1 bar (ScenarioF160 kmBC)and 10.9 bar (F1193 km−4 BC), re-spectively. Under the assumption of laterally open reservoir boundaries, pressure increase is reduced by a further 23 % in average compared to all three cases with closed boundaries.
salin-Figure 4. (a) Profile along Fault 1 shows the highest salinities in the central part of the fault near the injection well. Maximum salinities are significantly lower, if a salinity gradient is assumed (solid red line; ScenarioF1193 km−4 BC∗;yaxis is not to scale). A decrease in salinisation due to a downward flow is observed for the time after the injection period and under the assumption of a sharp saltwater–freshwater interface (dashed blue line; ScenarioF1193 km−4 BC). (b) Cross section normal to Fault 1 illustrates the propagation of the saltwater plume in the shallow aquifer (salinities > 0.05 %), while higher salinities can be observed within the lower element layer. White arrows illustrate schematically the direction of fluid flow at 20 years and 400 years.
isation area), which corresponds to the maximum allowable limit prescribed by the German Drinking Water Ordinance (TrinkwV, 2001), is 312 kg m−2after 20 years. In turn, the to-tal salinisation area in the shallow aquifer is expectably larger the greater the fault length. In ScenarioF1193 km−4 BC, this area is more than 7 times as large as in ScenarioF12 kmBC (Ta-ble 3). However, the salt mass per unit area is considerably lower, since pressure dissipation occurs over a greater hy-draulic conductive fault length, which reduces pressure gra-dients and brine displacement depths in the faults (30 m in ScenarioF160 kmBCand 29 m in ScenarioF1193 km−4 BC). Thus, the average salt mass of the salinisation area in the shallow aquifer is 141 kg m−2in ScenarioF160 kmBCand 84 kg m−2 in ScenarioF1193 km−4 BC. Lower vertical pressure gradients in the fault in the case of laterally open reservoir boundaries
reduce brine displacement depths and flow velocities out of the faults, and consequently the size of the salinisation ar-eas and average displaced salt masses in the shallow aquifer compared to the scenarios with closed reservoir boundaries (Fig. 6).
[image:9.612.115.483.66.442.2]Figure 5. (a) Pressure distribution in the reservoir along the highlighted cross section significantly varies depending on the open fault length. The highest pressurisation is observed for a short fault (F12 kmBC). (b) Pressure development at the base of Fault 1 indicates a substantially faster pressure reduction for greater fault lengths.
Figure 6. (a) Velocity profile within the lower element layer of the shallow aquifer shows the highest flow velocities out of Fault 1 at the end of injection period. (b) Flow velocities out of Fault 1 increase until the end of the injection period (20 years) and decrease afterwards depending on pressure reduction of the respective scenarios.
(ScenarioF12 kmBO)to 42 years (ScenarioF1193 km−4 BO), pres-sure conditions prior to injection are re-established (Fig. 7a). In case of closed reservoir boundaries, pressure reduction in the incompressible domain solely comes from vertical brine displacement via the fault(s) towards the laterally in-finite shallow aquifer. Thus, under the assumption of a sharp saltwater–freshwater boundary, the mass of salt displaced
[image:10.612.128.471.65.348.2] [image:10.612.127.468.409.573.2]Figure 7. (a) Relative salt mass change in the shallow aquifer shows that the mass of salt displaced into that aquifer corresponds to the total salt mass of injected brine, if reservoir boundaries are closed. As indicated by the duration of mass flow (black numbers), only a temporal effect on fluid migration occurs. (b) Relative mass change for all lithological units after 20 years illustrates a considerably reduced salinisation of the shallow aquifer for open reservoir boundaries.
a slight backward flow of brine out of the shallow aquifer and back into the fault in the case of a small effective fault damage zone volume and laterally open reservoir bound-aries. Over a period of 300 years, the salt mass in the shal-low aquifer decreases by about 7.5×10⁸kg salt (Scenario
F12 kmBO).
5.3 Overlying secondary reservoir
A secondary reservoir above the reservoir also hydraulically connected to the fault zones has a strong impact on pres-sure build-up within the injection horizon, and hence ver-tical pressure gradients in the fault(s). If reservoir bound-aries are closed for fluid flow, the pressure increase at the base of Fault 1 ranges from 9.0 bar (F12 kmBCSR200 mD)to 6.4 bar (F1193 km−4 BCSR200 mD), which corresponds to 47 and 58 % of the pressure increase, respectively, without consid-ering the overlying secondary reservoir. Under the assump-tion of laterally open reservoir boundaries, pressure increase is again reduced by further 24 % on average, compared to all three cases with secondary reservoir and closed bound-aries. This results in the lowest vertical pressure gradients in the fault(s) observed in the present scenario analysis. Lower reservoir pressures due to an overlying secondary reservoir induce lower flow velocities out of the fault as well, as shown in Fig. 6. Moreover, brine displaced into the
shal-low aquifer originates from considerably shalshal-lower depths in the fault. Here, brine is displaced into the shallow aquifer from the upper 70 m of Fault 1 in ScenarioF12 kmBCSR200 mD and 17 m in ScenarioF1193 km−4 BCSR200 mD considering lat-erally closed reservoir boundaries. Under the assumption of open flow boundaries, brine mainly originates from the up-per 56 m (ScenarioF12 kmBOSR200 mD) and 16 m (Scenario
[image:11.612.127.469.62.329.2]Ac-Figure 8. (a) Temporal evolution of the relative salt mass change in the shallow aquifer shows a lower duration of mass flow for open reservoir boundary conditions. Further, a slight backward flow out of the aquifer can be observed if the hydraulically conductive fault length is small. (b) Relative salt mass change for lithological units at 1000 years (considering the backflow) illustrates that salinisation of the shallow aquifer is substantially reduced, if reservoir boundaries are open, and a further overlying secondary reservoir exists. Brine is preferentially displaced into the secondary reservoir, if the permeability of that reservoir exceeds fault permeability (F1193 km−4 BOSR2000 mD). Consequently, freshwater salinisation in the shallow aquifer is the lowest compared to all other scenarios with a sharp saltwater–freshwater interface.
cording to the pressure gradient towards the shallow aquifer with laterally infinite extension, brine is displaced out of the secondary reservoir again after the injection stop and into the shallow aquifer (Fig. 9). Thus, the overall displaced salt mass in the shallow aquifer is almost identical compared to the corresponding scenarios without secondary reservoir, when pressure comes to an equilibrium (Figs. 7, 8).
5.4 Fault permeability
To evaluate the impact of fault permeability on upward brine displacement via the existing faults, a comparison was made between six scenarios that consider an effective damage zone volume of 1.6×10¹⁰m3(total fault length of 193 km) and a fault permeability of 10, 200 and 700 mD for laterally open and closed reservoir boundaries, respectively. Figure 12 and Table 4 show that the relative salt mass change in the shallow aquifer at the injection stop is almost identical for a fault per-meability of 700 and 200 mD. Thereby, laterally open model boundaries reduce the average salt mass of the salinisation ar-eas in the shallow aquifer by about 12 % compared with the models using laterally closed boundaries. A less permeable fault with a permeability of 10 mD has a more significant im-pact on the degree of upper aquifer salinisation. The relative
salt mass change in the shallow aquifer after 20 years is 17 % lower on average compared with a fault permeability of 200 or 700 mD. However, in a laterally closed and incompressible domain all the pressure relief comes from upward brine mi-gration. Consequently, all the injected brine volume reaches the shallow aquifer after a certain time, since flow persists until the overpressure in the storage formation is completely reduced. In this case, a low-permeable fault only extends the duration of mass flow into the shallow aquifer, which can last for up to 310 years (Fig. 10; Table 4). At that time, the total salt mass displaced into the shallow aquifer is the same as for the scenarios with a fault permeability of 200 or 700 mD.
5.5 Permeability difference between fault and secondary reservoir
[image:12.612.131.470.63.333.2]Figure 9. (a) Cross profile normal to Fault 1 shows that during the injection period the displaced fluid spreads within reservoir and overlying secondary reservoir. (b) Afterwards, the overpressure in both reservoirs is successively reduced and brine is transported out of the respective reservoir and into the shallow aquifer. (c) Temporal evolution of the relative salt mass change shows the resulting retardation in fluid flow into the shallow aquifer for ScenarioF12 kmBCSR200 mD.
Scenario F1193 km−4 BOSR2000 mD, the permeability of the sec-ondary reservoir is distinctly higher than that of the fault. The pressure increase at the base of Fault 1 is only 1.2 bar, which corresponds to 23 % of the total pressure increase, considering a secondary reservoir permeability of 200 mD (F1193 km−4 BOSR200 mD). Subsequently, brine that is displaced into the shallow aquifer originates solely from the upper 4 m of the faults. This results in the smallest salinisation area and the lowest degree in salinisation in the shallow aquifer com-pared to all other scenarios with a sharp saltwater–freshwater boundary (Fig. 9b; Table 3). In addition, the shortest duration of mass flow into the shallow aquifer with only 23 years is observed for ScenarioF1193 km−4 BOSR2000 mD.
5.6 Salinity gradient
Two further scenarios, considering a total fault length of 2 km (Scenario F12 kmBC∗) and 193 km (Scenario F1193 km−4 BC∗), without an overlying secondary reservoir and laterally closed reservoir boundaries were employed to investigate the
im-pact of a salinity gradient on the degree of shallow aquifer salinisation. The pressure increase at the base of Fault 1 is almost identical comparing both scenarios with the cor-responding scenario exhibiting a sharp saltwater–freshwater boundary below the Rupelian. Thus, a significant difference in the brine displacement depth in the faults cannot be ob-served after 20 years (Table 3). The displacement depth in the fault(s) is 132 m for ScenarioF12 kmBC∗and 29 m for Sce-narioF1193 km−4 BC∗. Consequently, also the mass of brine dis-placed into the shallow aquifer after 20 years is very simi-lar in the respective scenarios, with 2.2×10¹⁰kg (Scenario
[image:13.612.129.468.66.396.2]Figure 10. Salt mass displaced into the shallow aquifer assuming four open faults with varying permeability, a secondary overlying reservoir and open (red) or closed (blue) reservoir boundaries. The salt mass displaced into the shallow aquifer at the time of the injec-tion stop and thereafter is almost identical for a fault permeability higher than (solid lines) or equal (dashed lines) to the permeability of the secondary reservoir. If fault permeability is lower than that of the secondary reservoir (dotted lines), less salt is displaced into the shallow aquifer. Closed reservoir boundaries and low-permeable faults lead to retardation in mass flow (blue dotted line).
12 % (ScenarioF1193 km−4 BC∗)of that in the respective scenar-ios with the sharp saltwater–freshwater boundary (Fig. 11; Table 3).
6 Discussion
The present study demonstrates how the presence of regional faults can affect upward brine displacement and the degree of shallow aquifer salinisation in geological subsurface util-isation. Different fault permeabilites, effective damage zone volumes, hydrogeological boundary conditions and vertical salinity distributions, as well as the presence of a secondary reservoir formation above the target storage horizon, are con-sidered in a comprehensive large-scale scenario analysis. A 3-D geological model of a potential onshore storage site in the Northeast German Basin serves as the basis for this re-search. The results emphasise that maximum vertical pres-sure gradients in faults are observed for closed reservoir boundaries, if no overlying secondary reservoir exists and the
effective fault damage zone volume is relatively small. The higher the vertical pressure gradient, the greater the depth in the faults from which brine is displaced into the shallow aquifer. A large effective fault damage zone volume, open reservoir boundaries and a secondary reservoir above the storage formation, also hydraulically connected to the fault zones, significantly reduce pressure gradients, and thus dis-placement depths in the faults. These depths range between 132 m (Scenario F12 kmBC) and 4 m (F1193 km−4 BOSR2000 mD) after 20 years of fluid injection, respectively. Consequently, salt concentrations in the shallow aquifer are higher in the fault vicinity, the smaller the effective fault damage zone vol-ume. The degree in salinisation thereby strongly depends on the initial salinity distribution in the fault. If salinity increases sharply from, e.g., zero in the shallow aquifer to 25 % below its base, the average salt mass of the area affected by salinisa-tion amounts to 312 kg m−2after 20 years of injection (Sce-narioF12 kmBC). A salinity gradient of 0.23 g kg−1 solution per metre reduces the average salt masses of the salinisation area in the shallow aquifer by more than 90 % to 28 kg m−2 (ScenarioF12 km∗BC). On the contrary, the salinisation area in the shallow aquifer, assuming a total hydraulically conduc-tive fault length of 193 km is 7 times larger than for a fault length of 2 km. However, lower pressure gradients and brine displacement depths in the fault decrease the degree in salin-isation in the shallow aquifer, since pressure dissipation oc-curs over a larger area.
Figure 11. Relative mass change in the shallow aquifer after 20 years and 500 years for ScenarioF1193 km−4 BC with a sharp saltwater– freshwater boundary below the base of the shallow aquifer and ScenarioF1193 km−4 BC∗ with salinity increasing with depth by 0.23 g kg−1 solution per metre up to a maximum of 250 g kg−1at a depth of 1070 m.
into shallower units, so that fluid flow can persist for more than 1000 years until the overpressure in the storage forma-tion is completely reduced, resulting in an ongoing salinisa-tion far beyond the time of the injecsalinisa-tion stop. This demon-strates the relevance of also considering the post-injection phase in salinisation assessments, since neglecting the ongo-ing fluid flow processes could lead to an underestimation of the potential freshwater salinisation. Nevertheless, it should be noted that regional groundwater flow and mixing with lo-cal recharge would probably have a strong effect on the re-duction of salt concentrations in the shallow aquifer over a period of several hundred years. As demonstrated by the re-sults, it is crucial to represent the site-specific geological con-ditions as close as possible. Cavanagh and Wildgust (2011) pointed out that storage formations are unlikely to have zero-flow boundaries and are rather open with respect to single-phase flow and pressure dissipation via brine displacement at regional scale.
In a previous study focusing on the same storage site, Till-ner et al. (2013a) demonstrated that increasing fault perme-ability from 100 to 10 000 mD does not significantly affect the degree of shallow aquifer salinisation. Our simulations further show that only low fault permeability has a signif-icant impact on upward brine migration. Depending on the lateral reservoir boundaries, the relative salt mass change in the shallow aquifer after 20 years is 13–22 % lower for a fault permeability of 10 mD compared with a fault perme-ability of 700 mD. Tillner et al. (2013a) mainly considered fault permeabilities higher than that of the reservoir and over-lying permeable formations. Our simulations demonstrate that the preferential brine flow direction, and thus salini-sation of upper aquifers is determined by the permeability
contrast between fault and reservoir and/or overlying sec-ondary reservoirs. If permeability of an overlying secsec-ondary reservoir exceeds that of the fault (F1193 km−4 BOSR2000 mD), the mass of brine migrating into the shallow aquifer is only around a quarter of that observed in the opposite case (F1193 km−4 BOSR200 mD). Thus, it can be concluded that in multi-barrier systems the potential salinisation of a shallow aquifer is lowered with each intermediate aquifer, if a hy-draulic connection exists between the fault or leakage path-way and that aquifer. Similar results were achieved by an an-alytical approach of Nordbotten et al. (2004), investigating fluid leakage through wells in a multi-barrier system with up to 12 aquifers. The authors observed a successive decrease in the intensity of upward fluid displacement, caused by the migration of fluid into the intermediate aquifer layers, con-sequently reducing fluid migration in the shallowest aquifer. Birkholzer et al. (2009) also showed that the amount of fluid displaced into formations above the reservoir decreases in upward direction due to the attenuation capacity of the over-lying rocks, however, without considering a vertical conduit. Further, Walter et al. (2012) concluded that saltwater intru-sion into potable groundwater resulting from geological CO2 storage in a saline aquifer occurs most likely in the vicinity of vertical fluid conduits and not over large areas, if sites with multi-barrier systems and intermediate aquifers are selected. Zeidouni (2012) evaluated vertical communication between aquifers through a leaky fault by an analytical approach and showed that the attenuation capacity of a single, thick over-lying aquifer is distinctly smaller than that of a multi-layered system.
up-ward brine migration from saline formations was chosen. We injected brine instead of CO2and neglected pore compress-ibility in our models to maximise pressurisation and related brine displacement. Considering the effects of CO2 and/or pore compressibility would induce a lower injection-related pressure build-up due to higher storage coefficients, and con-sequently to less intense brine displacement in the injection period. Furthermore, our simulations with a fault fully sat-urated with brine correspond to an endmember resulting in maximum freshwater salinisation. Brine migration across the faults is possible, since no impermeable fault core was con-sidered; however, brine migration occurs almost solely up-ward into the overlying formations and is negligible in the horizontal direction across the faults, when applying a higher fault than reservoir permeability. Hence, the presented mod-elling results are valid for one specific fault architecture pro-moting vertical fluid flow, as a least favourable case with re-spect to shallow aquifer salinisation. In multi-layer systems with alternating layers of reservoirs and cap rocks, as that considered in the present study, fault permeability within the cap rock layers is usually lower than that of the fault host rocks resulting from the clay smearing effect (e.g., Crawford et al., 2008; Egholm et al., 2008). Fault permeability varies not only with mineralisation along the fault plane, but also with, e.g., depth, fault throw and orientation, inducing highly heterogeneous horizontal and vertical permeability patterns (e.g., Vilarrasa and Carrera, 2015; Bense and Person, 2006; Odling et al., 2004; Shipton and Cowie, 2003; Fisher and Knipe, 2001). Heterogeneity in fault permeability can pre-vent brine from migrating in an upward direction and result in much lower salt concentrations or a differently distributed salinisation pattern in the shallow aquifer as presented here. However, hydraulic properties and the spatial extent of fault damage zones are difficult to detect, and therefore exhibit a high uncertainty in predicting fault fluid flow and potentially resulting shallow freshwater salinisation (Odling et al., 2004; Harris et al., 2003). Further, geomechanical effects are rele-vant in the assessment of fault fluid flow and several authors have explored the impact of injection-induced pressure build-up on fault zones stability (e.g., Rinaldi et al., 2015; Kempka et al., 2014; Tillner et al., 2014; Magri et al., 2013; Röhmann et al., 2013; Cappa and Rutqvist, 2011; Chin et al., 2000). For this purpose, coupled hydro-mechanical simulations are applied to account for the interaction between hydraulic and mechanical processes, potentially triggering fault slip and di-lation resulting in, e.g., new or enhanced leakage pathways for formation fluids. To minimise pressure perturbation due to fluid injection, and thus fault fluid flow, simultaneous fluid injection and production from storage reservoirs is discussed as one efficient mitigation measure to be applied in geologi-cal underground utilisation (Kempka et al., 2015b; Tillner et al., 2013b; Court et al., 2012; Bergmo et al., 2011; Buscheck et al., 2011).
For future investigations, we extend the assumptions made in the present study by the implementation of heterogeneous
fault zones with spatial variations in porosity and permeabil-ity as well as related non-uniform architecture and fault in-clination. Furthermore, research is underway to implement the 3-D model presented here in coupled hydro-mechanical simulations to account for potential fault shear failure and permeability changes that may alter fault fluid flow.
7 Summary and conclusions
In the present study, we demonstrate that pressure propaga-tion in the reservoir determines the intensity and durapropaga-tion of fluid flow through the faults and shallow aquifer salinisation, mainly controlled by the lateral model boundary settings and the effective fault damage zone volume. In general, the po-tential of freshwater salinisation is low for greater effective fault damage zone volumes or fault lengths, because the ori-gin depth of the fluids displaced into the shallow aquifer is located a few decametres below the shallow aquifer in maxi-mum due to relatively low vertical pressure gradients. Short and very permeable fault segments or a small effective fault damage zone may result in a higher salinisation potential due to a larger vertical fault height affected by fluid displacement. The degree in shallow aquifer salinisation thereby strongly depends on the initial salinity distribution in the investigated area and especially that in the fault. If a gradient in salin-ity exists or the saltwater–freshwater interface lies below the fluid displacement depth in the faults, freshwater salinisation is considerably lower compared to scenarios with a sharp freshwater–brine interface located directly below the shal-low freshwater aquifer. Moreover, it can be concluded that intermediate aquifers, lying in between the storage reservoir and the shallow freshwater aquifer, further diminish salini-sation in the shallow aquifer because brine originating from the faults is partly displaced into these intermediate layers. Lateral boundary conditions mainly influence the duration of brine displacement: while open reservoir boundaries allow for fast pressure dissipation, fluid flow persists for several hundred to a thousand years in a spatially restricted reser-voir until the mass of brine displaced into the shallow aquifer corresponds to the overall injected fluid mass (assuming zero pore compressibility). Considering our simulation results, we conclude that hydraulically conductive fault zones do not necessarily lead to freshwater salinisation owing to upward brine displacement. This principally depends on the initial salinity distribution, effective volume of the fault damage zone and the hydrogeological boundary conditions.
bandwidth of potential freshwater salinisation. Field explo-rations have to be employed prior to any subsurface utilisa-tion to obtain the most accurate data, especially on hydraulic properties of existing fault zones as well as the initial salinity distribution.
Acknowledgements. We would like to thank three anonymous
reviewers for the support in improving the manuscript’s quality and our colleagues Benjamin Nakaten and Marco De Lucia (GFZ German Research Centre for Geosciences) for technical support and constructive comments.
The article processing charges for this open-access publication were covered by a Research
Centre of the Helmholtz Association.
Edited by: M. Riva
References
Bense, V. F. and Person, M. A.: Faults as conduit-barrier systems to fluid flow in siliciclastic sedimentary aquifers, Water Resour. Res., 47, W05421, doi:10.1029/2005WR004480, 2006. Bergmo, P. E. S., Grimstad, A.-A., and Lindeberg, E.:
Si-multaneous CO2 injection and water production to optimise aquifer storage capacity, Int. J. Greenh. Gas Con., 5, 555–564, doi:10.1016/j.ijggc.2010.09.002, 2011.
Beutler, G. and Stackebrandt, W.: Der Schollenbau des Tafeldeck-gebirges von Brandenburg – Vorschlag für eine einheitliche Be-nennung [The tectonic pattern of the sedimentary cover of Bran-denburg – suggestion for a uniform nomenclature], Brandenbur-gische Geowissenschaftliche Beiträge, 19, 93–109, 2012. Birkholzer, J. T., Zhou, Q., and Tsang, C.-F.: Large-scale impact
of CO2storage in deep saline aquifers: a sensitivity study on pressure response in stratified systems, Int. J. Greenh. Gas Con., 3, 181–194, doi:10.1016/j.ijggc.2008.08.002, 2009.
Birkholzer, J. T., Nicot, J. P., Oldenburg, C. M., Zhou, Q., Krae-mer, S., and Bandilla, K.: Brine flow up a well caused by pres-sure perturbation from geologic carbon sequestration: static and dynamic evaluations, Int. J. Greenh. Gas Con., 5, 850–861, doi:10.1016/j.ijggc.2011.01.003, 2011.
Buscheck, T. A., Sun, Y., Hao, Y., Wolery, T. J., Bourcier, W., Tompson, A. F. B., Jones, E. D., Friedmann, S. J., and Aines, R. D.: Combining brine extraction, desalination, and residual-brine reinjection with CO2storage in saline formations: Implica-tions for pressure management, capacity, and risk mitigation, En-ergy Procedia, 4, 4283–4290, doi:10.1016/j.egypro.2011.02.378, 2011.
Caine, J., Evans, J., and Forster, C.: Fault zone architecture and per-meability structure, Geology, 24, 1025–1028, doi:10.1130/0091-7613(1996)024<1025:FZAAPS>2.3.CO;2, 1996.
Cappa, F. and Rutqvist, J.: Modeling of coupled deformation and permeability evolution during fault reactivation induced by deep underground injection of CO2, Int. J. Greenh. Gas Con., 5, 336– 346, doi:10.1016/j.ijggc.2010.08.005, 2011.
Cavanagh, A. and Wildgust, N.: Pressurization and brine displace-ment issues for deep saline formation CO2storage, Energy Pro-cedia, 4, 4814–4821, doi:10.1016/j.egypro.2011.02.447, 2011. Chin, L. Y., Raghavan, R., and Thomas, L. K.: Fully coupled
geomechanics and fluid-flow analysis of wells with stress-dependent permeability, SPE J., 5, 32–45, doi:10.2118/58968-PA, 2000.
Chiaramonte, L., Zoback, M. D., Friedmann, S. J., and Stamp, V.: Seal integrity and feasibility of CO2sequestration in the Teapot Dome EOR Pilot: Geomechanical site characterization, Environ. Geol., 54, 1667–1675, doi:10.1007/s00254-007-0948-7, 2008. Court, B., Bandilla, K. W., Celia, M. A., Buscheck, T. A.,
Nord-botten, J. M., Dobossy, M., and Janzen, A.: Initial evaluation of advantageous synergies associated with simultaneous brine pro-duction and CO2 geological sequestration, Int. J. Greenh. Gas Con., 8, 90–100, doi:10.1016/j.ijggc.2011.12.009, 2012. Crawford, B. R., Faulkner, D. R., and Rutter, E. H.: Strength,
poros-ity, and permeability development during hydrostatic and shear loading of synthetic quartz-clay fault gouge, J. Geophys. Res.-Sol. Ea., 113, B03207, doi:10.1029/2006JB004634, 2008. Dempsey, D., Kelkar, S., and Pawar, R.: Passive injection: A
strat-egy for mitigating reservoir pressurization, induced seismicity and brine migration in geologic CO2storage, Int. J. Greenh. Gas Con., 28, 96–113, doi:10.1016/j.ijggc.2014.06.002, 2014. Egholm, D. L., Clausen, O. R., Sandiford, M., Kristensen, M. B.,
and Korstgård, J. A.: The mechanics of clay smearing along faults, Geology, 36, 787–790, doi:10.1130/G24975A.1, 2008. Faulkner, D. R., Jackson, C. A. L., Lunn, R. J., Schlische, R. W.,
Shipton, Z. K., Wibberley, C. A. J., and Withjack, M. O.: A re-view of recent developments concerning the structure, mechan-ics and fluid flow properties of fault zones, J. Struct. Geol., 32, 1557–1575, doi:10.1016/j.jsg.2010.06.009, 2010.
Fisher, Q. J. and Knipe, R. J.: The permeability of faults within siliciclastic petroleum reservoirs of the North Sea and Nor-wegian Continental Shelf, Mar. Petrol. Geol., 18, 1063–1081, doi:10.1016/S0264-8172(01)00042-3, 2001.
Fitts, J. P. and Peters, C. A.: Caprock Fracture Dissolution and CO2 Leakage, Rev. Mineral. Geochem., 77, 459–479, doi:10.2138/rmg.2013.77.13, 2013.
Forster, C. B. and Evans, J. P.: Fluid flow in thrust faults and crys-talline thrust sheets: Results of combined field and modeling studies, Geophys. Res. Lett., 18, 979–982, 1991.
Grube, A., Wichmann, K., Hahn, J., and Nachtigall, K.: Geo-gene Grundwasserversalzung in den Poren-Grundwasserleitern Norddeutschlands und ihre Bedeutung für die Wasserwirtschaft, DVGW-Technologiezentrum Wasser, Band 9, Karlsruhe, 2000. Hannemann, M. and Schirrmeister, W.: Paläohydrogeologische
Grundlagen der Entwicklung der Süß-/Salzwassergrenze und der Salzwasseraustritte in Brandenburg [Paleohydrological basics of the development of the boundary of fresh and salt water as well as of the salt water-outlets in Brandenburg], Brandenburgische Geowissenschaftliche Beiträge, 5, 61–72, 1998.
Harris, S. D., McAllister, E., Knipe, R. J., and Odling, N. E.: Pre-dicting the three-dimensional population characteristics of fault zones: a study using stochastic models, J. Struct. Geol., 25, 1281–1299, doi:10.1016/S0191-8141(02)00158-X, 2003. Hotzan, G. and Voss, T.: Komplexe hydrogeochemisch-genetische
Storkow-Frankfurt (Oder)-Eisenhüttenstadt [Complex hydrogeochemic-genetic mapping for evaluation of the endangerment of pleis-tocene and tertiary aquifers by saline waters in the region Storkow-Frankfurt (Oder)-Eisenhüttenstadt], Brandenburgische Geowissenschaftliche Beiträge, 20, 62–82, 2013.
IEA Greenhouse Gas R&D Programme (IEA GHG): CCS Site Characterization Criteria, Technical Study, Report No. 2009/10, 130 pp., 2008.
IPCC – Metz, B., Davidson, O., de Coninck, H.C., Loos, M. and Meyer L.A. (Eds.): IPCC Special Report on Carbon Dioxide Capture and Storage, Prepared by Working Group III of the Inter-governmental Panel on Climate Change, Cambridge University Press, New York, 431 pp., 2005.
Jourde, H., Flodin, E., Aydin, A., Durlovsky, L., and Wen, X.: Computing permeability of fault zones in eolian sandstone from outcrop measurements, AAPG Bull., 86, 1187–1200, doi:10.1306/61EEDC4C-173E-11D7-8645000102C1865D, 2002.
Kempka, T., Klapperer, S., and Norden, B.: Coupled hydro-mechanical simulations demonstrate system integrity at the Ket-zin pilot site for CO2storage, in: Rock Engineering and Rock Mechanics: Structures in and on Rock Masses; Proceedings of EUROCK 2014, ISRM European Regional Symposium, edited by: Alejano, L., Perucho, A., Olalla, C., and Jiménez, R., Lei-den: CRC Press/Balkema, 1317–1322, 2014.
Kempka, T., Herd, R., Huenges, E., Endler, R., Jahnke, C., Janetz, S., Jolie, E., Kühn, M., Magri, F., Meinert, P., Moeck, I., Möller, M., Muñoz, G., Ritter, O., Schafrik, W., Schmidt-Hattenberger, C., Tillner, E., Voigt, H.-J., and Zimmermann, G.: Joint Re-search Project Brine: Carbon Dioxide Storage in Eastern Bran-denburg: Implications for Synergetic Geothermal Heat Recov-ery and Conceptualization of an Early Warning System Against Freshwater Salinization, in: Geological Storage of CO2– Long Term Security Aspects, edited by: Liebscher, A. and Münch, U., GEOTECHNOLOGIEN Science Report No.22, Advanced Tech-nologies in Earth Sciences, Springer International Publishing, 139–166, 2015a.
Kempka, T., Nielsen, C. M., Frykman, P., Shi, J.-Q., Bacci, G., and Dalhoff, F.: Coupled Hydro-Mechanical Simulations of CO2 Storage Supported by Pressure Management Demonstrate Syn-ergy Benefits from Simultaneous Formation Fluid Extraction, Oil Gas Sci. Technol., 70, 599–613, doi:10.2516/ogst/2014029, 2015b.
Kühn, M. and Kempka, T.: CO2 Pressurisation of a Stor-age Reservoir does not Lead to Salinization of Shallower Aquifers through Intact Caprocks, Energy Procedia, 76, 607– 615, doi:10.1016/j.egypro.2015.07.880, 2015.
Magri, F., Tillner, E., Wang, W., Watanabe, N., Zimmermann, G., and Kempka, T.: 3-D Hydro-mechanical Scenario Analy-sis to Evaluate Changes of the Recent Stress Field as a Re-sult of Geological CO2Storage, Energy Procedia, 40, 375–383, doi:10.1016/j.egypro.2013.08.043, 2013.
Mitchell, T. and Faulkner, D.: The nature and origin of off-fault damage surrounding strike-slip off-fault zones with a wide range of displacements: A field study from the Atacama fault system, northern Chile, J. Struct. Geol., 31, 802–816, doi:10.1016/j.jsg.2009.05.002, 2009.
Nakaten, B., Tillner, E., and Kempka, T.: Virtual Elements for Representation of Faults, Cracks and Hydraulic Fractures in
Dynamic Flow Simulations, Energy Procedia, 40, 447–453, doi:10.1016/j.egypro.2013.08.051, 2013.
Nicot, J.: Evaluation of large-scale CO2 storage on fresh-water sections of aquifers: An example from the Texas Gulf Coast Basin, Int. J. Greenh. Gas Con., 2, 582–593, doi:10.1016/j.ijggc.2008.03.004, 2008.
Nordbotten, J. M., Celia, M. A., and Bachu, S.: Analytical solutions for leakage rates through abandoned wells, Water Resour. Res., 40, W04204, doi:10.1029/2003WR002997, 2004.
Odling, N. E., Harris, S. D., and Knipe, R. J.: Permeability scaling properties of fault damage zones in siliclastic rocks, J. Struct. Geol., 26, 1727–1747, doi:10.1016/j.jsg.2004.02.005, 2004. Oldenburg, C. M. and Rinaldi, A. P.: Buoyancy Effects on Upward
Brine Displacement caused by CO2Injection, Transport Porous. Med., 87, 525–550, doi:10.1007/s11242-010-9699-0, 2011. Person, M., Banerjee, A., Rupp, J., Medina, C., Lichtner, P., Gable,
C., Pawar, R., Celia, M., McIntosh, J., and Bense, V.: As-sessment of basin-scale hydrologic impacts of CO2 seques-tration, Illinois basin, Int. J. Greenh. Gas Con., 4, 840–854, doi:10.1016/j.ijggc.2010.04.004, 2010.
Pruess, K.: ECO2N: A TOUGH2 Fluid Property Module for Mix-tures of Water, NaCl, and CO2, Lawrence Berkeley National Laboratory, Berkeley, CA, 66 pp., 2005.
Rinaldi, A. P., Vilarrasa, V., Rutqvist, J., and Cappa, F.: Fault reac-tivation during CO2sequestration: effects of well orientation on seismicity and leakage, Greenhouse Gases: Science and Technol-ogy, 5, 645–656, doi:10.1002/ghg.1511, 2015.
Röhmann, L., Tillner, E., Magri, F., Kühn, M., and Kempka, T.: Fault Reactivation and Ground Surface Uplift Assessment at a Prospective German CO2Storage Site, Energy Procedia 40, 437– 446, doi:10.1016/j.egypro.2013.08.050, 2013.
Schlumberger: Petrel Seismic-to-Evaluation Software, Version 2011.2.7, 2011.
Shipton, Z. K. and Cowie, P. A.: A conceptual model for the ori-gin of fault damage zone structures in high-porosity sandstone, J. Struct. Geol., 25, 333–344, doi:10.1016/S0191-8141(02)00037-8, 2003.
Shipton, Z. K., Soden, A., Kirkpatrick, J., Bright, A., and Lunn, R.: How Thick is a Fault? Fault Displacement-Thickness Scal-ing Revisited, in: Earthquakes: Radiated Energy and the Physics of Faulting, edited by: Abercrombie, R., McGarr, A., Di Toro, G., and Kanamori, H., American Geophysical Union, Washing-ton DC, 193–198, doi:10.1029/170GM19, 2006.
Span, R. and Wagner, W.: A New Equation of State for Carbon Dioxide Covering the Fluid Region from the Triple-Point Tem-perature to 1100 K at Pressures up to 800 MPa, J. Phys. Chem. Ref. Data, 25, 1509–1596, doi:10.1063/1.555991, 1996. Stackebrandt, W.: Grundzüge des geologischen Baus von
Branden-burg [Outline of the geological setting of BrandenBranden-burg], Bran-denburgische Geowissenschaftliche Beiträge, 5, 3–7, 1998. Stackebrandt, W. and Manhenke, V. (Eds.): Atlas zur Geologie von
Brandenburg, 1 : 1 000 000. Landesamt für Geowissenschaften und Rohstoffe Brandenburg (LGRB), 146 pp., 2004.
Tesch, J., Burmann, G., Schwamm, G., and Nillert, P.: Hydroge-ologischer Ergebnisbericht mit Grundwasservorratsberechnung, Vorerkundung Fürstenwalde, VEB Hydrogeologie Nordhausen, BT Berlin, 1–309, Berlin, 1987 (unpublished).
CO2storage site in Northeast Germany, Int. J. Greenh. Gas Con., 19, 689–703, doi:10.1016/j.ijggc.2013.03.012, 2013a.
Tillner, E., Kempka, T., Nakaten, B., and Kühn, M.: Geological CO2Storage Supports Geothermal Energy Exploitation: 3-D Nu-merical Models Emphasize Feasibility of Synergetic Use, Energy Procedia, 37, 6604–6616, doi:10.1016/j.egypro.2013.06.593, 2013b.
Tillner, E., Shi, J.-Q., Bacci, G., Nielsen, C. M., Frykman, P., Dal-hoff, F., and Kempka, T.: Coupled Dynamic Flow and Geome-chanical Simulations for an Integrated Assessment of CO2 Stor-age Impacts in a Saline Aquifer, Energy Procedia, 63, 2879– 2893, doi:10.1016/j.egypro.2014.11.311, 2014.
Trinkwasserverordnung – TrinkwV: Verordnung über die Qualität von Wasser für den menschlichen Gebrauch vom 21.05.2001 (BGBl. I S. 959). Trinkwasserverordnung in der Fassung der Bekanntmachung vom 2. August 2013 (BGBl. I S. 2977), die durch Artikel 4 Absatz 22 des Gesetzes vom 7. August 2013 (BGBl. I S. 3154) geändert worden ist, 2001.
Vattenfall: Antrag auf Erteilung einer Erlaubnis zur Auf-suchung bergfreier Bodenschätze zu gewerblichen Zwecken, http://www.lbgr.brandenburg.de/media_fast/4055/Antrag%200_ Aufsuchung%20bergfreier%20Bodensch%C3%A4tze_Bkh_ 20090306.15564291.pdf, 12 pp. (last access: 18 December 2014), 2009.
Vattenfall: Hauptbetriebsplan – Aufsuchungsarbeiten in Bezug auf den bergfreien Bodenschatz Sole im Erlaubnisfeld Birkholz-Beeskow, 28 pp., http://www.lbgr.brandenburg.de/media_fast/ 4055/Bkh_HBP_Finale.pdf, (last access: 18 December 2014), 2010.
Vilarrasa, V. and Carrera, J.: Geologic carbon storage is unlikely to trigger large earthquakes and reactivate faults through which CO2 could leak, P. Nat. Acad. Sci. USA, 112, 5938–5943, doi:10.1073/pnas.1413284112, 2015.
Walter, L., Binning, P. J., Oladyshkin, S., Flemisch, B., and Class, H.: Brine migration resulting from CO2 injection into saline aquifers – An approach to risk estimation including various levels of uncertainty, Int. J. Greenh. Gas Con., 9, 495–506, doi:10.1016/j.ijggc.2012.05.004, 2012.
Wibberley, C. A. J., Yielding, G., and Toro, G.: Recent advances in the understanding of fault zone internal structure: a review, in: The Internal Structure of Fault Zones: Implications for Mechan-ical and Fluid-Flow Properties, edited by: Wibberley, C. A. J., Kurz, W., Imber, J., Holdsworth, R. E., and Collettini, C., Geo-logical Society of London, 5–33, doi:10.1144/SP299.2, 2008. Yamamoto, H., Zhang, K., Karasakib, K., Marui, A., Hitoshi
Uehara, H., and Nishikawa, N.: Numerical investigation con-cerning the impact of CO2 geologic storage on regional groundwater flow, Int. J. Greenh. Gas Con., 3, 586–599, doi:10.1016/j.ijggc.2009.04.007, 2009.
Zeidouni, M.: Analytical model of leakage through fault to overlying formations, Water Resour. Res., 48, W00N02, doi:10.1029/2012WR012582, 2012.
Zhang, K., Wu, Y. S., and Pruess, K.: User’s Guide for TOUGH2-MP – A Massively Parallel Version of the TOUGH2 Code, Earth Sciences Division, Lawrence Berkeley National Labora-tory, Berkeley, 108 pp., 2008.