IDENTIFICATION THE EFFECT OF SPATIAL LAND USE VARIABILITY
USING GIS AT THE UPSTREAM CILIWUNG WATERSHED
Siti Murniningsih1andEvi Anggraheni2
1Laboratory of Hydraulics, Hydrology and River, Civil Engineering Department, University of Indonesia, Jakarta, Indonesia 2Civil Engineering Department, University of Indonesia, Jakarta, Indonesia
E-Mail: [email protected]
ABSTRACT
The impact of spatial land use variability on the accuracy of runoff simulation was investigated in order to define the optimal spatial discretization of the watershed to be adopted in rainfall-runoff modeling. The correlation between the types of land cover, soil characteristic and soil humidity on the runoff coefficient determining is very important. Using SCS- CN model and GIS we try to indentify the effect of spatial land use on the runoff simulation. The case study presented is located in the upstream Ciliwung watershed; it is based on the detailed information from the Geographic Information System (GIS) available for upstream Ciliwung Watershed. We made the limitation on the soil humidity, we choose directly CN with the normal condition. The comparison between the averaged and distributed CN will calculate in order to analyze the effect of spatial land use variability on the surface runoff. The result is highly depends on the level of organization of land use. According to the model, the behavior of the studied watersheds may sometimes remain very similar with a homogeneous CN input, whereas for some cases the differences in the peak discharges can give the important indication of the influence of spatial land use variability.
Keywords: land use, spatial variability, GIS, SCS-CN, surface runoff.
1. INTRODUCTION
Jakarta as the capital city of Indonesia has a very important role as the administrative center, the center of economic and center of the government. Based on its topography, 40% (± 24,000 Ha) of Jakarta is located below the tides and passed by 13 major rivers include Cisadane river, Ciliwung river, and other rivers from mountainous areas in the south. Of the 13 rivers that flow in Jakarta, the Ciliwung River is the longest river in the Greater Jakarta area. The length of the main stream of this river is almost 120 km, with the river basin covering an area of 387 km2. Ciliwung river flows across Bogor City, Bogor, Depok, South Jakarta and East Jakarta. Its upstream located in the border of Bogor and Cianjur (Gunung Gede-Pangrango and Puncak). Astronomically, Ciliwung lies at 6ᴼ05'-6ᴼ50 'LS and 106ᴼ40'-107ᴼ00' BT. Ciliwung River basin area is bounded by Cisadane basin in the west and Citarum basin in the east. Statistic shows that there are total of 350,000 people living in Ciliwung river banks with a total of 70,000 units of building. The river is regarded as the worst affected rivers than other rivers flowing in Jakarta. Aside of that, the shape Ciliwung basin from upstream to Katulampa areas have dendritic shapes. This form characterizes that the increase in the flow with decreased flow during floods have equal duration, while the downstream direction has parallel shape (elongated) and narrowing. With this shape, the headwaters has an important role, the contribution of runoff from this area is quite large. If the physical conditions, especially land-use, changes, it will lead to changes in the amount of flooding or runoff.
Due to changes in land use and uncontrolled use of river banks for settlement and population activities, there is often high water levels, still in the profile of the original river, flooded residential areas because of changes
in the area along the river, which supposed to accommodate water increase at the time when debit increases. For example, some households in Bidaracina, East Jakarta, are located on the banks of the river, so during the rainy season residents are often said to be flooded as a result of living in the inhabit the flood. Various efforts have been made by the government in responding to the floods, both structural and non-structural. Structural flood control system in Ciliwung include the manufacture of a number of water gates or flood observation post, flood prevention to a certain height with dikes, and also lowering the water level by normalization, diversion, canal, and interconnection of the rivers.. The core concept of the flood channel is controlling the flow of water from upstream and regulating the volume of water coming into Jakarta. In addition, the government also seeks to reduce the flood discharge at the dam as well as attempting to reduce the pool of the polder pumping and drainage system.
The main problem in the control rainfall runoff in urban areas generally consists of the need to control the depth of peak discharge and flow throughout the system, in order to avoid unwanted puddles. Therefore, the strategy in managing the rainfall runoff, one of them according to the UNH Storm Water Center, is the use of retention reservoirs where the presence of the reservoir is expected to accommodate the volume of flooding in the upstream area, so as to reduce the volume of runoff that enters downstream. The method will be applied to the Ciliwung river by building Sukamahi and Ciawi dams. Hydrological models are needed to estimate the amount of flooding in the river basin.
conditions in the field. The accuracy and variation data by time and space are needed for hydrological models. (Soulis KX, 2012) suggests to use the spatial distribution of land cover or land use to describe the real conditions on the ground. According to Soulis, the use of spatial variation CN (Curve number) which represents land use in the water basin indicates results in accordance with discharge measurements in the field.
2. LITERATURE REVIEW
USDA Soil Conservation Service Method is a hydrological modeling to estimate the amount of flooding by adopting the characteristic of river basin. SCS-CN estimates the magnitude of flooding based on the type of land cover (land use), soil moisture in this case is represented by the amount of rain for five (5) days prior to the day that counts and the type of soil (Naulin, 2013). This method relies heavily on runoff curve number or CN, where CN is a constant coefficient to determine the maximum storage capacity of the land (Putranto, 1995). Equation of SCS-CN model based on calculations of high rainfall (KX Soulis, 2012) are:
untuk P > 0,2 S (1)
untuk P < 0,2 S (2)
Where Q is the debit (m3/s) is the accumulated rainfall (mm), S is the maximum storage capacity after the runoff takes place (mm) and Ia is the beginning of abstraction (mm). The value of the CN according to the USDA Soil Conservation Service, 1972 are presented in a table that shows the relationship between Land Use and Soil Classification
In determining the value of CN, the method SCS classify coefficient based on the soil type into 4 groups of hydrologic soil and the variables taken into account is the antecedent moisture condition (AMC) and land use as follows :
Group A characteristic has a low potential for runoff and high infiltration rate. Included in this group is the type of soil composed of sand or gravel that has been drained thus the propagation rate of water is larger than 0.76 cm / hour.
Group B characteristic has moderate infiltration rate, where the soild is in wedrained soil with soft to rough texture. Its general texture is muddy clay and has a water propagation rate between 0.38 and 0.76 cm / hour.
Group C characteristic has a low infiltration rate with wet state, comprised of soil with a layer that blocks the movement of the water and the bottom layer with smooth texture. The general texture is sandy clay thus generally have propagation rate of the average water between 0.13 and 0.38 cm / hour.
Group D characteristic has high potential runoff and has a very low infiltration rate, and generally consisting of clay with a low potential of absorption
Soil texture included in this group is clay, muddy clay, sandy clay and has a verly low propagation rate of the water, ranging from 0.0 to 0.13 cm / hour.
a) Effect of spatial distribution of land use to the magnitude of floods
Effects of changes in land use that is represented by the coefficient of the CN, in accordance with the SCS-CN method, is one of the parameters that influence the amount of flooding, several studies have been conducted to determine the effect of the spatial distribution of CN on the magnitude of flooding but results are always different. One example is that (Marco Sangati, 2009) states that the spatial distribution of soil properties and rainfall, which affects the amount of the value of CN, affect the magnitude of the flood produced but it depends on the scale of the river basin and the level of the distribution itself.
In the same year (C. Manus, 2009) states that the spatial distribution of the soil characteristics and the rain using DEM (Digital Elevation Model), gives effects that cannot be ignored on the hydrological response in this case is the surface runoff. (Soulis KX, 2012) as previously described, supports Sangati statement that the use of spatial variation (Soulis KX, 2012) CN (Curve number) representing land use in the watershed indicate results in accordance with discharge measurements in the field. But (N. Bernia, 2008) states that the spatial distribution of rain is very influential on the size of the resulting flood but the spatial distribution of land use (CN) did not have a significant impact on the production of the resulting flood.
b) Geographic information systems (GIS) as
the spatial distribution analysis
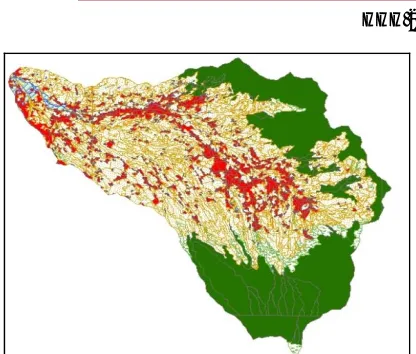
Figure 1. Land use distribution at the upstream Ciliwung.
c) Spatial data in GIS
Spatial data has a meaning as the data that refers to the position, the object, and the relationship between them in earth. Spatial data is one item of information, which included information about the earth, including the surface, below the surface, waters, marine and lower atmosphere. In using it, the spatial data is processed using computer (digital spatial data) using the model as an approach (Frastiansyah, 2010). There are two models in the spatial data, the raster data model and vector data model. Both have different characteristics, and in using them, it depends on the data input of end result that will be generated.
The data model is a representation of geographic objects which are recorded thus recognizable and can be processed by computers. (Naulin, 2013) did an analysis of spatial data using DEM to divide his study area to understand the effect and distribution of spatial data in calculating the flooding and to determine the point of flooding in the highway.
d) WIN TR 20 as the flooding simulation using spatial
distribution
TR 20 was first developed by the USDA (United States Department of Agriculture) in 1973 and then refined into Win TR 20 by the same institution in 1992. Win TR 20 is a surface water hydrological model that can simulate the amount of flooding spatially within the scale of river basin. This model can be used to analyze the current river basin conditions or simulate the impact of changes in land use in the river basins to adopt the principle of work of the SCS-CN models. Direct runoff / flood by rain hypothetical or real rainy conditions.
The computation of effective rainfall (production) is performed on each sub watershed by using the Soil Conservation Service - Curve Number (SCS-CN) function. It requires the determination of one parameter: the Curve Number (CN), characterizing the capacity of soil to generate effective rainfall. It assumes that the flood flow are essentially composed of surface runoff water or at least responding runoff processed. The hypothesis of the
SCS-CN method is about the ratios of the two actual potential quantities are equal as the following equation:
(3)
From the continuity principle:
(4)
By study of result from many experimental watersheds, en empirical relation was developed thus the equation of SCS-CN:
where as (5)
(6)
The evolution of the runoff coefficient as follows :
(7)
Where Ct is the runoff coefficient and Pt is the total rainfall amount in millimeter at time (t), S is the retention capacity of catchment area in mm. In the following equation the runoff coefficient called as the parameter CN, and parameter CN is called “Curve Number”, the value of CN is between 0 and 100.
. (8)
The Custom of CN data used to be standard Cover Description using assumptions on the Land Use Detail. The percent of impervious area in a sub-area may also be changed. Impervious areas are connected impervious areas if its runoff flows directly into the drainage system or if its runoff flows as shallow concentrated flow over a pervious area and then into the drainage system. Shallow concentrated flow velocity is fast enough to allow little or no infiltration into the pervious area. An impervious area is unconnected if runoff from it flows as sheet flow over a pervious area before entering the drainage system. The sheet flow is slow enough that some infiltration is presumed to occur in the previous area. If the water from a roof downspout flows across a lawn as sheet flow, with opportunity to infiltrate the lawn, the rooftop is an unconnected impervious area.
3. MATERIAL AND METHODS
a) Location of the upstream Ciliwung watershed
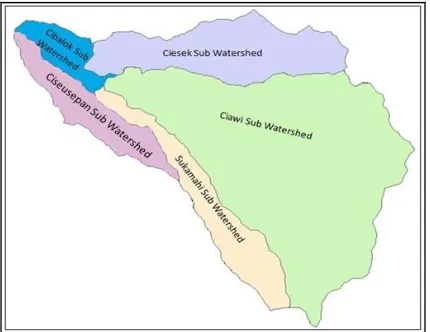
[image:4.612.78.293.242.408.2]Ciliwung River headwaters is in the north slope of Mount Pangranggo (El. + 3,019 m), flowing towards the north. The Upper Ciliwung calculate until the Katulampa weir at Bogor. In this research we devide the Upper Ciliwung into two simulation. The first simulation, we divide upper Ciliwung into 5 sub watershed, and for the second approach, we divide the upper ciliwung into 29 sub watershed. The distribution of the Upper Ciliwung into 5 and 29 sub watershed looks like the picture below:
[image:4.612.321.534.318.447.2]Figure-2. Distribution the upstream Ciliwung into 5 sub watershed.
Figure-3. Distribution the upstream Ciliwung into 29 sub watershed.
Ciawi sub watershed point located in Ciliwung River, the meeting point between Ciliwung river Cisukabirus. The river basin is a fan-type shape. Some tributaries Ciliwung incoming upstream dam plan Ciawi is Cisarua rivers and river Cibogo. Ciawi Dam river basin area is 87.95 km2, the length of the main river is ± 18 km, the river morphology is undulating mountainous areas.
Sukamahi subwatershed point is located on the river which is a tributary of Cisukabirus and Ciliwung. River basin with a feather-shaped Sukamahi Dam is 16.78 km2, the length of the main river ± 15.4 km, river morphology is undulating mountainous areas.
Ciseusepan sub watershed point is located on the river which is a tributary of Ciseusepan and Ciliwung. River basin with a feather-shaped also with the area about 12.4 km2, the length of the main river ± 11.3 km, river morphology is undulating mountainous areas.
Ciesek sub watershed point is located on the river which is a tributary of Ciesek and Ciliwung. River basin with area about 26.38 km2, the length of the main river ± 13.2 km, river morphology is undulating mountainous areas. And the last sub watershed is Cibalok. Area of Cibalok about 7.2 km2 with the length of the main river ± 6.1 km. Cibalok watershed area up to Katulampa Weir. General conditions Katulampa weir can be seen in the figure below:
Figure-4. Katulampa weir.
b) Research variables
The research variables or objects are all factors that could affect the study results. As noted previously, in the determination of the CN, the variables are taken into account is the classification of land hydrology, soil moisture, and land use. But in this study, measurement of geographical data elements of the type of soil and initial soil moisture conditions are considered in normal condition or AMC-II. Furthermore, the impact of spatial variations in land use map will be calculated using surface runoff equation developed by the Soil Conservation Service (SCS runoff equation).
Two simulation of this research using the hypotetic rainfall data. It’s mean that we not take account about the value of rainfall and average rainfall is simulated over the watershed.
4. RESULT AND DISCUSSION
[image:4.612.75.295.447.623.2]Table-1. Sub watershed properties.
Sub Wate rshed
Are a (km2)
Le ngth
(km) CN Value
Ciawi 87.95 18 75.34
Sukamahi 16.78 15.4 71.79
Ciseusepan 12.4 11.3 75.34
Ciesek 26.38 13.2 74.86
Cibalok 7.2 6.1 74.86
Upper Ciliwung Wate rshed
150.71 23.55 74.84
Watershed schematic which is produce by the Win-TR 20 programe for the first simulation can be show at the picture below (5 sub watershed):
Figure-5. Schematic of first simulation of upper Ciliwung watershed.
However the CN calculation on the second simulation which is Upper Ciliwung Watershed divided to 29 Sub Watershed, with the composition of land use and the area like the table below give the value of CN 75.74:
Table-2. Land cover composition on the second approach.
Land Cover CN Area
Water Bodies 98 0.47
Pasteur 69 5.80
Building 85 0.35
Forest 66 49.28
Land Crop 81 31.37
Residential Area 85 19.56
Grassland 69 0.59
Irigation 98 1.18
Rainfed rice 79 12.30
Moor 79 29.79
Total Area 75.74 150.71
Watershed schematic which is produce by the Win-TR 20 programe for the second simulation can be show at the picture below (29 sub watershed) :
Figure-6. Schematic of second simulation of upper Ciliwung.
Figure-7. Hydrograph from two different simulation.
5. CONCLUSIONS
The effect of spatial land use variability has been studied here by considering two different land use inputs: land cover digital data with a scale 1 :50.000 and the spatial average land use over the watershed, hypotetic rainfall data for 24 hours and digital river data with the scale about 1 : 25.000. First, the comparison between the spatial average land use and the spatial land use data showed that the spatial land use data produce higher value of CN than the averaged land use data. According the first identification, there is no big diferent value of CN for the first and second simulation.
Table-3. Land cover percentage.
Land Cover Curve Number Area Percentage
Open Space 69 0.59 0.39
Pasteur 69 5.80 3.85
Land Crop 80 73.47 48.75
Develop Area 85 19.92 13.22
Irigation Area 98 1.18 0.79
Water Bodies 98 0.47 0.31
Forest 66 49.28 32.70
150.71 100.00
Total
From the table above we can show that more than 50% area at the Upper Ciliwung , on the 2011, is undeveloped area. Its also cause the average from that condition give the lower value than the spatial condition. The surface runoff simulation between two condition produce the slighty difference hydrograph also. In a further step, the variability of rainfall can be calculate also to analyse the most important variability whose influence the watershed response.
REFERENCES
[1] C. Manus, S.A.P. “A Modelling Approach to Asses the Hydrological Response of Small Mediterranean Catchment to the Variability of Soil Characteristics in a Context of Extreme Event”, Hydrology and Earth System Science, pp. 79-97, 2009.
[2] Chow V., M. “Applied Hydrology”, McGraw-Hill, 1988
[3] Committee, M.S. “Minesota Stormwater Manual Version 2”, Minnesota Pollution Control Agency, 2008
[4] LID, M. “Low Impact Development Principles, Techniques, and Implementation”, 2009
[5] N.Bernia, A.V., “Effects of Rainfall and Soil/Land Use Spatial Distribution on Hydrological Response at Different Scales” International Environmental Modelling and Software Society (iEMSs), 2008
[6] Marco Sangati, M.B.,”Influence of rainfall and soil properties spatial aggregation on extreme flash flood response modelling: An evaluation based on the Sesia river basin, North Western Italy”, Advances in Water Resources, pp. 1090–1106, 2009
[7] Putranto, “Studi Perkirakan Potensi Sumber Daya Air Melalui Perbandingan Analisis Limpasan Permukaan dengan Metoda USDA Soil Conservation Service dan Metoda Rasional Kasus Sungai Ciliwung”, 1995
[8] Soemarto, C., “Hidrologi Teknik. Surabaya: Usaha Nasional, 1986
[9] Soulis K. X., J. D., “SCS-CN parameter determination using rainfall-runoff data in heterogeneous watersheds – the two-CN System Approach”,. Hydrology and Earth System Science , pp. 1001-1015, 2012