R E S E A R C H A R T I C L E
Open Access
Disease severity is associated with the use of
complementary medicine to treat or manage
type-2 diabetes: data from the 2002 and 2007
National Health Interview Survey
Richard L Nahin
1*, Danita Byrd-Clark
2, Barbara J Stussman
1and Nilesh Kalyanaraman
1Abstract
Background:The overall prevalence of complementary medicine (CM) use among adults in the United States with diabetes has been examined both in representative national samples and in more restricted populations. However, none of these earlier studies attempted to identify predictors of CM use to treat diabetes among the populations sampled, nor looked for a relationship between CM use and diabetes severity.
Methods:Combining data from the 2002 and 2007 National Health Interview Survey (NHIS), we constructed a nationally representative sample of 3,978 U.S. adults aged≥18 years with self-reported diabetes. Both the 2002 and 2007 NHIS contained extensive questions on the use of CM. We used logistic regression to examine the association between diabetes severity and overall CM use, as well as the use of specific categories of CM.
Results:In adults with type-2 diabetes, 30.9% used CM for any reason, but only 3.4% used CM to treat or manage their type-2 diabetes versus 7.1% of those with type-1 diabetes. Among those using CM to treat/manage their type-2 diabetes, 77% used both CM and conventional prescription medicine for their diabetes. The most prevalent types of CM therapies used were diet-based interventions (35.19%, S.E. 5.11) and non-vitamin/non-mineral dietary supplements (33.74%, S.E. 5.07). After controlling for sociodemographic factors, we found that, based on a count of measures of diabetes severity, persons with the most severe diabetes had nearly twice the odds of using CM as those with less severe disease (OR=1.9, 95%CI 1.2-3.01). Persons who had diabetes 10 years or more (OR=1.66, 95%CI 1.04-3.66) and those that had a functional limitation resulting from their diabetes (OR=1.74, 95%CI 1.09-2.8) had greater odds of using CM than those not reporting these measures. No significant associations were observed between overall CM use and other individual measures of diabetes severity: use of diabetic medications, weak or failing kidneys, coronary heart disease, or severe vision problems.
Conclusions:Our results demonstrate that individuals with more severe diabetes are more likely to use CM independent of sociodemographic factors. Further studies are essential to determine if CM therapies actually improve clinical outcomes when used to treat/manage diabetes.
Keywords:Complementary medicine, Diabetes, Disease severity, Logistic regression, Survey
* Correspondence:[email protected]
1
National Center for Complementary and Alternative Medicine, National Institutes of Health, 6707 Democracy Blvd, Bethesda, MD 20892-5475, USA Full list of author information is available at the end of the article
Background
Self-management is the cornerstone of overall diabetes management [1]. Self-management of type-2 diabetes requires complex, continual and demanding self-care behaviors, including dietary control, exercise and fre-quent medication. More active self-management is generally believed to result in better metabolic control and higher quality of life [2] while also being more cost effective than standard pharmaceutical therapies alone [3,4]. Yet failure to follow treatment recommendations is reported as a serious and widespread problem in patients with type-2 diabetes and believed to lead to dia-betic complications such as blindness, poor wound hea-ling, neuropathy and kidney failure.
Hernanderz et al. [5] and Paterson and Thorne [6] have demonstrated that learning to master self-care in diabetes is a process where the person attempts a variety of self-care strategies according to her or his unique cir-cumstances until discovering what is effective for their own lifestyle and contextual situation. It has been pro-posed that individuals with diabetes view complementary medicine (CM) as another option for their self manage-ment along with conventional options [7], and that indi-viduals highly motivated to control their diabetes will try multiple therapies available to them including CM [8]. This is consistent with numerous observations that CM therapies are predominately used as complements to conventional care rather than in lieu of conventional care [9,10].
The overall prevalence of CM use among adults in the United States with diabetes has been examined both in representative national samples [11-13] and in more restricted populations [7,8]. Prevalence rates in these studies varied from about 30% to 70% depending on the definition of CM used. Much lower rates are observed when examining the prevalence of CM use specifically to treat or manage diabetes – from about 20% of all adults with diabetes in 1997 [11] to about 6.7% of all adults with diabetes in 2002 (recalculated from [12]). None of these studies attempted to identify predictors of CM use to treat diabetes among the populations sampled, nor looked for a relationship between CM use and diabetes severity.
In the general population, a number of characteristics are associated with CM use: gender (being female), race/ ethnicity (being non-Hispanic White), age (being middle-aged), and education (having a college degree) to name a few [10,14,15]. Other predictors of CM use include poor perceived health status and the presence of multiple health complaints [14-17]. Thus, one might hypothesize that individuals with diabetes are more likely to use CM if they have more severe diabetes and/or one or more complications associated with the disease. However, there are also data from the general population showing
that CM is associated with a number of positive health behaviors that would be part of a wellness lifestyle [18] including regular levels of exercise [15], nonuse of tobacco [15,19,20], nonuse or moderation in use of alco-hol [15,21], healthy diet choices [21] and preventive screening [22]. It may also be that individuals oriented toward a wellness lifestyle will be more likely to use CM for their diabetes. The present study seeks to address these two, not mutually exclusive hypotheses through analysis of data from the National Health Interview Sur-vey (NHIS). In both 2002 and 2007, the NHIS included extensive questions on the use of a wide range of CM therapies. The NHIS also contained a limited number of questions on the reasons why an individual might have chosen to use a given CM therapy. We analyzed the responses to two of these questions to examine reasons for use of CM among individuals who used CM to treat/ manage their diabetes.
Methods Data source
The data used in this study come from the 2002 and 2007 NHIS. The NHIS is an annual survey of the health of the U.S. civilian, non-institutionalized population conducted by the National Center for Health Statistics, Centers for Disease Control and Prevention. The survey uses a multi-stage clustered sample design, and over-sampled non-Hispanic black and Hispanic persons in both 2002 and 2007, and Asians in 2007 to allow for more accurate national estimates of health for these increasing minority populations.
The survey contains four main modules: Household, Family, Sample Child, and Sample Adult. The first two modules collect health and sociodemographic informa-tion on each member of all families residing within a sampled household, while the Sample Adult file includes more specific information (e.g., health and health-related information) obtained from a randomly chosen adult aged 18 years or older in the household. The NHIS also contains supplemental questions/modules on a yearly basis. Both the 2002 and 2007 NHIS included a module that asked about the use of various CM therapies inclu-ding practitioner-based therapies (e.g., chiropractic and osteopathic manipulation, massage therapy, acupunc-ture, etc.) and self-care therapies (e.g., dietary supple-ments, yoga, meditation, etc.). The consistency in the sample design, weighting, and CM modalities covered in the 2002 and 2007 NHIS made it possible to combine data across the two samples.
completed in 29,266 households, which yielded 75,764 persons in 29,915 families and 23,393 Sample Adults. The final household response rate was 87.1% and the final 2007 sample adult response rate was 67.8%.
Participants were asked“other than during pregnancy, have you ever been told by a doctor or health profes-sional that you have diabetes or sugar diabetes?” Based on this question, in 2002, 2186 sample adults (7.04% unweighted; 6.51% weighted) were classified as having diabetes. Of those, 2159 (98.8% unweighted; 98.6% weighted) had valid responses to the series of CM-related questions. In 2007, 2036 of sample adults (8.7% unweighted; 7.74 weighted) reported having diabetes; of those, 1991 (97.8% unweighted; 97.9% weighted) had valid response to the series of CM questions. Because participants in NHIS were not categorized as having type-1 or type-2 diabetes, participants with diabetes diagnosed at age <25 and who were currently treated with insulin were excluded from subsequent analysis as probably having type-1 diabetes (N=172; Table 1). These criteria are based on those used in previous analyses of type-2 diabetes using NHIS data [23,24]. Thus our final sample for analysis included 3978 participants from 2002 and 2007 combined who were coded as having type-2 diabetes.
The surveys were approved by the National Center for Health Statistics Institutional Review Board. Verbal or written consent was obtained from all survey participants.
Dependent variable
The NHIS applied the definition of CM as used by the National Institutes of Health, National Center for Com-plementary and Alternative Medicine at the time each survey was designed and fielded [16,17]. Administered to sample adults, the supplement asked a number of questions about the use of CM therapies within the past 12 months. CM use, the dependent variable for this study, was defined as use of any of the following in the past 12 months: acupuncture, Ayurveda, biofeedback, chelation therapy, chiropractic care, chiropractic or osteopathic manipulation, energy healing therapy/Reiki, folk medicine, hypnosis, massage therapy, movement based therapies (Feldenkrais, Alexander technique, Pila-tes, and Trager Psychophysical Integration), naturopathy, herbal supplements and other non-vitamin/non-mineral dietary supplements (NVNMDS), homeopathic treat-ment, diet-based therapies (Vegetarian diet, Macrobiotic diet, Atkins diet, Pritikin diet, Ornish diet and Zone diet, and South Beach diet), traditional healers, yoga, tai chi, qi gong, and relaxation techniques (meditation, guided imagery, progressive relaxation, and deep breathing exer-cises). For exploratory purposes, CM therapies were also grouped into four discrete categories: use of only one or
more specific NVNMDS, use of only one or more types of diet-based therapies, use of all other CM therapies, and use of multiple CM therapies (for coding purposes, use of multiple NVNDMS or multiple diet-based thera-pies are counted once–e.g., use of two or more specific herbs would be coded once as use of NVNMDS; use of two or more specific diets would be coded once as use of CM diets.). This last category was included as a surro-gate measure for heavy CM users.
Independent variables
The main independent variable was based on counts of six measures of diabetes severity: three direct measures of diabetes severity and three known diabetes complica-tions. An individual reporting the presence of three or more of these individual measures was considered to have more severe diabetes versus someone reporting less than three. The three direct measures of greater diabetes severity were: 1) 5 or more years since time of diagnosis; 2) use of insulin or oral hypoglycemic drugs (diabetes prescription medications); and 3) at least one functional limitation attributed to the diabetes. The three diabetes complications counted were: 1) weak or failing kidneys; 2) severe vision problems; and 3) coronary heart disease. The items chosen for the count were based on the litera-ture where measures of diabetes severity routinely included use of diabetes prescription drugs [25], time since diagnosis [25], and major complications of diabetes (even if self-reported) including kidney disease [25-27], retinal diseases [25-27] and coronary heart disease [25-27], but not co-morbid diseases that are not considered com-plications of diabetes.
The coding for weak/failing kidneys and coronary heart disease were based on “yes” responses to the fol-lowing questions in the NHIS:“Have you ever been told by a doctor or other health professional that you have: coronary heart disease . . . weak or failing kidneys.” Indi-viduals were coded as having severe vision problems if either they responded yes to the NHIS question“Do you have trouble seeing even when wearing glasses or con-tacts”OR had a functional limitation (see below) result-ing from“vision problem/problem seeing”.
Also included in some of the published studies exam-ining diabetes severity were diabetes-related functional limitations [27,28]. In the present study, the measure of functional limitation for diabetes was based on the fol-lowing sequential questions from the NHIS core: “The next questions ask about difficulties you may have doing certain activities because of a HEALTH PROBLEM. By
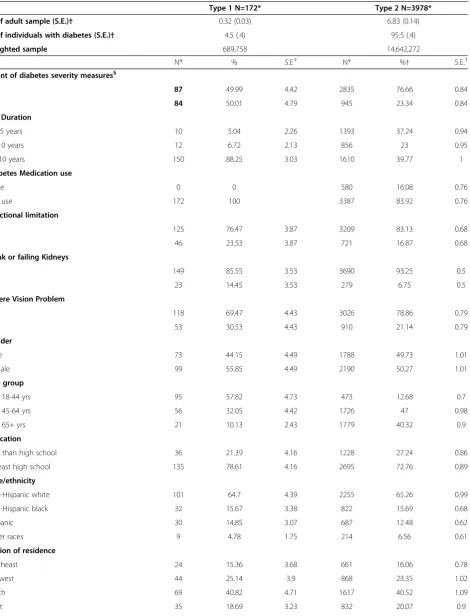
Table 1 Characteristics of sample adults with Type 1 and Type 2 diabetes: data from the 2002 and 2007 NHIS
Type 1 N=172* Type 2 N=3978*
% of adult sample (S.E.)† 0.32 (0.03) 6.83 (0.14)
% of individuals with diabetes (S.E.)† 4.5 (.4) 95.5 (.4)
Weighted sample 689,758 14,642,272
N* % S.E.‡ N* %† S.E.‡
Count of diabetes severity measures§
0-2 87 49.99 4.42 2835 76.66 0.84
>=3 84 50.01 4.79 945 23.34 0.84
DM Duration
1-< 5 years 10 5.04 2.26 1393 37.24 0.94
5-<10 years 12 6.72 2.13 856 23 0.95
>= 10 years 150 88.25 3.03 1610 39.77 1
Diabetes Medication use
None 0 0 580 16.08 0.76
Any use 172 100 3387 83.92 0.76
Functional limitation
No 125 76.47 3.87 3209 83.13 0.68
Yes 46 23.53 3.87 721 16.87 0.68
Weak or failing Kidneys
No 149 85.55 3.53 3690 93.25 0.5
Yes 23 14.45 3.53 279 6.75 0.5
Severe Vision Problem
No 118 69.47 4.43 3026 78.86 0.79
Yes 53 30.53 4.43 910 21.14 0.79
Gender
Male 73 44.15 4.49 1788 49.73 1.01
Female 99 55.85 4.49 2190 50.27 1.01
Age group
Age 18-44 yrs 95 57.82 4.73 473 12.68 0.7
Age 45-64 yrs 56 32.05 4.42 1726 47 0.98
Age 65+ yrs 21 10.13 2.43 1779 40.32 0.9
Education
Less than high school 36 21.39 4.16 1228 27.24 0.86
At least high school 135 78.61 4.16 2695 72.76 0.89
Race/ethnicity
Non-Hispanic white 101 64.7 4.39 2255 65.26 0.99
Non-Hispanic black 32 15.67 3.38 822 15.69 0.68
Hispanic 30 14.85 3.07 687 12.48 0.62
Other races 9 4.78 1.75 214 6.56 0.61
Region of residence
Northeast 24 15.36 3.68 661 16.06 0.78
Midwest 44 25.14 3.9 868 23.35 1.02
South 69 40.82 4.71 1617 40.52 1.09
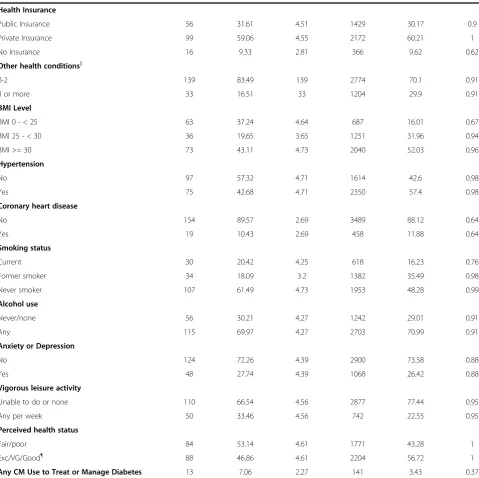
Table 1 Characteristics of sample adults with Type 1 and Type 2 diabetes: data from the 2002 and 2007 NHIS
(Continued)
Health Insurance
Public Insurance 56 31.61 4.51 1429 30.17 0.9
Private Insurance 99 59.06 4.55 2172 60.21 1
No Insurance 16 9.33 2.81 366 9.62 0.62
Other health conditions||
0-2 139 83.49 139 2774 70.1 0.91
3 or more 33 16.51 33 1204 29.9 0.91
BMI Level
BMI 0 - < 25 63 37.24 4.64 687 16.01 0.67
BMI 25 - < 30 36 19.65 3.65 1251 31.96 0.94
BMI >= 30 73 43.11 4.73 2040 52.03 0.96
Hypertension
No 97 57.32 4.71 1614 42.6 0.98
Yes 75 42.68 4.71 2350 57.4 0.98
Coronary heart disease
No 154 89.57 2.69 3489 88.12 0.64
Yes 19 10.43 2.69 458 11.88 0.64
Smoking status
Current 30 20.42 4.25 618 16.23 0.76
Former smoker 34 18.09 3.2 1382 35.49 0.98
Never smoker 107 61.49 4.73 1953 48.28 0.99
Alcohol use
Never/none 56 30.21 4.27 1242 29.01 0.91
Any 115 69.97 4.27 2703 70.99 0.91
Anxiety or Depression
No 124 72.26 4.39 2900 73.58 0.88
Yes 48 27.74 4.39 1068 26.42 0.88
Vigorous leisure activity
Unable to do or none 110 66.54 4.56 2877 77.44 0.95
Any per week 50 33.46 4.56 742 22.55 0.95
Perceived health status
Fair/poor 84 53.14 4.61 1771 43.28 1
Exc/VG/Good¶ 88 46.86 4.61 2204 56.72 1
Any CM Use to Treat or Manage Diabetes 13 7.06 2.27 141 3.43 0.37
* The unweighted number of participants belonging to each category.
†The denominator used in the calculation of percentages was the number of adults with type-2 Diabetes, defined as all participants with diabetes excluding those who were both diagnosed at age <25 and were currently being treated with insulin, who were classified as having type-1 diabetes. Estimates were age adjusted using the projected 2000 U.S. population as the standard population and using four age groups: 18–24 years, 25–44 years, 45–64 years, and 65 years and over.
‡Standard Errors.
§ Based on the following six measures: 5 or more years since time of diagnosis, use of insulin or oral hypoglycemic drugs, at least one functional limitation attributed to the diabetes, weak or failing kidneys, Coronary Heart Disease, and severe vision problems.
|| Includes all health conditions included in the NHIS except weak or failing kidney, severe vision problems, coronary heart disease, hypertension, and anxiety or depression.
social activities. Difficulties with any of these 12 activities would elicit the following follow-up question: “What condition or health problem causes you to have difficulty with [problem 1, problem 2 or problem 3]”. If the par-ticipant reported that any specific functional limitation resulted from diabetes, or vision problems/problems see-ing, for the current analysis they were coded as having a functional limitation associated with diabetes, or a severe vision problem, respectively.
When developing our list of diabetes severity measures to count, we explored the correlational relationships among our dichotomous variables through the tau statis-tic, which measures the amount of concordance and discordance among variables. For all 15 comparisons we made (each individual variable in the count vs. every other individual variable in the count), the calculated taus’s were all less than 0.2, indicating that there was substantial discordance among the variables (that is, relatively low collinearity).
The literature shows that while anxiety/depression is seen as a risk factor for diabetes in many individuals, it is a complication of diabetes in others [29,30]. As such, in sensitivity analysis, we also examined the impact of adding depression to the co-morbidities to be included in the diabetes severity count. The calculated taus’s comparing anxiety/depression to every other measures used in the count were all less than 0.2.
Control variables
Variables often associated with CM use among NHIS participants [15-17,31] were included in these analyses as control variables. These included sex, age (18–44; 45– 64; 65+), education (<high school, HS or greater), race/ ethnicity (non-Hispanic white, non-Hispanic black, His-panic, other), region (Northeast, Midwest, South, West), health insurance status (no insurance, public insurance, private insurance), hypertension (yes, no), other health conditions (excluding weak/failing kidneys and severe vi-sion problems, hypertenvi-sion, and anxiety/depresvi-sion; 0– 2 versus 3 or more), perceived health status (fair/poor, excellent/very good/good), ability to perform vigorous leisure activity (unable to do, any per week), smoking status (never, former, or current), alcohol consumption (never/none, any), and BMI (0-<25 kg/m2; 25-<30 kg/m2; >=30 kg/m2). For our coding of alcohol use, we have employed the CDC definition of alcohol abstainer based on responses to two questions:“In ANY ONE YEAR, have you had at least 12 drinks of any type of alcoholic beve-rage?” and“In your ENTIRE LIFE, have you had at least 12 drinks of any type of alcoholic beverage?”.
Reasons for CM use
We conclude these analyses by presenting data on whether individuals who use CM to treat/manage their
type-2 diabetes are dissatisfied with their conventional care. Specifically, we analyze data from two questions in the NHIS:“DURING THE PAST 12 MONTHS, did you use {given CM therapy}. . .Because medical treatments did not help; Because medical treatments were too expensive.”Chi square analysis was used to identify sig-nificant associations between these reasons and the va-rious measures of diabetes severity.
Statistical analysis
Descriptive statistics (means, percentages) for the char-acteristics of individuals coded as having type-2 diabetes were calculated for any CM use, and for each of the four CM categories. Chi-square analysis was used to test bi-variate associations between the independent/control variables and any CM use, as well as for each of the four CM categories.
Multiple logistic regression was used to assess the rela-tionships between the count measure of diabetes severity and use of CM in the past 12 months, after adjusting for control variables. Only control variables associated with CM use at p< 0.1 level in chi-square analysis were retained as control variables in the adjusted regression model. In addition, to control for any secular trends, the year of the survey (2002 or 2007) was forced into all adjusted models. As secondary analyses, we also individu-ally explored the associations between each of the six measures of diabetes severity (plus anxiety/depression in sensitivity analysis) with use of CM.
For the multiple logistic regression models, there was no evidence of collinearity; inspections of tolerance values, condition indices, and variance inflation factors, suggested we had employed properly specified hetero-skedastic models.
All estimates, including those of CM prevalence, were generated using SUDAAN software (version 10, Re-search Triangle Institute, ReRe-search Triangle Park, N.C.) that accounts for complex sample designs such as that used by the NHIS. To ensure representation of the U.S., civilian, non-institutionalized population age 18 years and over, all estimates (percentages, odds ratio, standard errors, 95% confidence limits) were weighted using the NHIS sample adult record weight.
Sensitivity analyses
Table 2 Characteristics of adults who used complementary medicine (CM)* to treat their type-2 diabetes
Did not use CM to treat/manage their diabetes Used CM to treat/manage their diabetes
N† Percent‡ S.E.§ N† Percent‡ S.E.§
All adults with type-2 diabetes 3873 96.57 0.37 141 3.43 0.37
N† Percent|| S.E.§ N† Percent|| S.E.§ P-value¶
Count of diabetes severity measures#
0-2 measures 2738 76.82 0.85 97 72.25 4.29 0.284
>=3 measures 904 23.18 0.85 41 27.75 4.29
Diabetes duration
1-< 5 years 1348 37.2 0.96 45 38.29 5.35 0.067
5-<10 years 835 23.28 0.98 21 15.11 3.58
>= 10 years 1536 39.52 1.02 74 46.6 5.33
Diabetes medication use
None 554 15.83 0.77 26 23.08 4.9 0.16
Any 3273 84.17 0.77 114 76.92 4.9
Functional limitation
No 3105 83.34 0.7 104 77.34 3.7 0.104
Yes 684 16.66 0.7 37 22.66 3.7
Weak/failing kidneys
No 3561 93.28 0.49 129 92.38 2.76 0.741
Yes 268 6.72 0.49 11 7.62 2.76
Coronary heart disease
No 3359 87.95 0.66 130 92.97 2.27 0.044
Yes 447 12.05 0.66 11 7.03 2.27
Severe vision problems
No 2921 78.91 0.8 105 77.21 4.29 0.706
Yes 874 21.09 0.8 36 22.71 4.29
Anxiety or depression
No 2800 73.62 0.89 100 72.59 4.82 0.823
Yes 1027 26.38 0.89 41 27.41 4.82
Gender
Male 1725 49.83 1.04 63 46.95 4.79 0.56
Female 2112 50.17 1.04 78 53.05 4.79
Age group
Age 18-44 yrs 451 12.54 0.71 22 16.65 4.02 0.04
Age 45-64 yrs 1653 46.71 0.99 73 55.11 4.97
Age 65+ yrs 1733 40.75 0.91 46 28.24 4.34
Education
Less than high school 1190 27.38 0.89 38 23.4 4.17 0.355
Table 2 Characteristics of adults who used complementary medicine (CM)* to treat their type-2 diabetes(Continued)
Income
$0-$34,999 2334 50.57 1.11 81 44.41 5.37 0.337
$35,000-$74,999 1035 32.05 1.15 40 29.08 5.03
$75,000 + 468 17.38 0.99 20 26.51 5.8
Race/ethnicity
NH White 2183 65.46 0.99 72 59.5 5.46 0.059
NH Black 802 15.9 0.68 20 9.93 2.7
Hispanic 650 12.25 0.64 37 19.09 3.42
Other races 202 6.39 0.59 12 11.48 4.32
Region of residence
Northeast 648 16.27 0.78 13 10.09 3.28 0.01
Midwest 846 23.6 1.05 22 16.44 3.9
South 1565 40.75 1.11 52 33.89 4.95
West 778 19.38 0.9 54 39.58 5.47
Health insurance
Public insurance 1390 30.43 0.91 39 22.57 4.02 0.135
Private insurance 2096 60.09 1.02 76 63.55 4.91
No insurance 342 9.47 0.63 24 13.88 3.46
Other health conditions**
0-2 2694 70.54 0.93 80 57.84 5.41 0.017
3 or more 1143 29.46 0.93 61 42.16 5.41
BMI level
BMI 0 - < 25 673 16.3 0.68 14 7.65 2.25 0.002
BMI 25 - < 30 1210 32.08 0.86 41 28.71 4.94
BMI >= 30 1954 51.62 0.98 86 63.64 5.08
Hypertension
No 1544 54.41 1 70 48 5.19 0.297
Yes 2279 57.59 1 71 52 5.19
Smoking status
Current 605 16.4 0.77 13 11.61 3.99 0.441
Former smoker 1329 35.52 0.99 53 34.51 4.69
Never smoker 1878 48.08 1 75 53.89 5.33
Alcohol use
Never/none 1202 29.19 0.94 40 23.97 3.91 0.21
Any 2604 70.81 0.94 99 76.03 3.91
Vigorous leisure activity
Unable to do or none 2784 77.82 0.95 93 67.08 5.79 0.086
cutoff down in five-year increments, thereby theoretic-ally capturing for analysis most, if not all, individuals with type-2 diabetes in our NHIS sample. Frequencies, chi sq and logistic regression data for this sensitivity analysis are presented.
Results
We found that 7.2% (S.E. 0.14) of surveyed adults reported having physician diagnosed diabetes. This equates to roughly 15.3 million adults in the United States. Of these, 95.5% (S.E. 0.4), or 14.6 million, were coded as having type-2 diabetes. The majority of indivi-duals with type-2 diabetes had the disease longer than 5 years, were taking either insulin or oral hypoglycemic medication, did not have a functional limitation related to diabetes, did not have weak/failing kidneys or severe vision problems, were at least 45 years old, had greater than a high school education, were Non-Hispanic whites, had private health insurance, were overweight or obese, had hypertension but not coronary heart disease, had smoked tobacco and consumed alcohol at some point in their lives, were not depressed or anxious, and were unable to perform vigorous leisure activity but nevertheless considered themselves in at least good health (Table 1). About equal numbers of men and women had type-2 diabetes. In contrast, individuals with type-1 diabetes predominately had their diabetes more than 10 years, were under 45 years of age, did not have a functional limitation related to diabetes, did not have weak/failing kidneys, severe vision problems, hyperten-sion, coronary heart disease or depreshyperten-sion, yet consid-ered their health as only fair or poor (Table 1).
Consistent with the literature, we found that 30.9% (S.E. 0.96) of individuals with type-2 diabetes used CM
for some reason, equating to roughly 4.4 million adults (data not shown). However, only 3.43% (S.E. 0.37) of individuals with type-2 diabetes used CM specifically to treat or manage their diabetes versus 7.06% of those with type-1 diabetes (Table 1). Among those using CM to treat/manage their type-2 diabetes, 63% have had their diabetes for more than five years, and 77% used both CM and conventional prescription medicine for their diabetes (Table 2). Only a quarter of individuals using CM to treat/manage their type-2 diabetes reported a functional limitation resulting from their diabetes, severe vision problems or anxiety/depression (Table 2). Very few individuals using CM for their diabetes reported weak/failing kidneys or coronary heart disease (Table 2).
Within the group using CM to treat or manage their diabetes, we observed that a number of sociodemo-graphic and health status variables were associated with CM use at p<0.1 (Table 2): age, race/ethnicity, region of residence, number of co-morbid conditions, BMI level, the ability to perform vigorous leisure activity at least once per week and perceived health status. These va-riables were included in all adjusted logistic regression models as covariates.
Diabetes severity
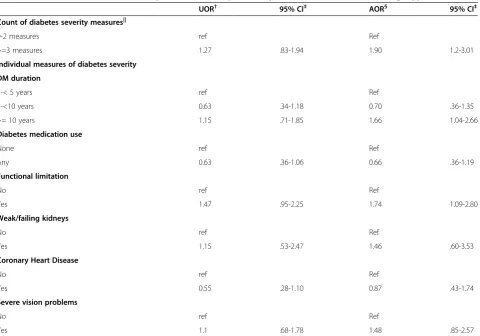
[image:9.595.58.537.103.146.2]Table 3 shows the results from unadjusted and adjusted logistic regression models fitted for our count measure of disease severity. We found that more severe disease was associated with CM use, with someone exhibiting three or more measures of diabetes severity having almost twice the adjusted odds of using CM as someone with less than three measures. To explore this finding in more detail, we examined the association between CM use and each measure of diabetes severity contributing
Table 2 Characteristics of adults who used complementary medicine (CM)* to treat their type-2 diabetes(Continued)
Perceived health status
Fair/poor 1715 43.74 1.02 56 30.35 4.58 0.012
Exc/VG/Good†† 2119 56.26 1.02 85 69.65 4.58
* CM use, the dependent variable for this study, was defined as use of any of the following in the past 12 months: acupuncture, Ayurveda, biofeedback, chelation therapy, chiropractic care, chiropractic or osteopathic manipulation, energy healing therapy/Reiki, folk medicine, hypnosis, massage therapy, movement based therapies, naturopathy, herbal supplements and other non-vitamin/non-mineral dietary supplements (NVNMDS), homeopathic treatment, diet-based therapies, traditional healers, yoga, tai chi, qi gong, and relaxation techniques.
†The unweighted number of participants belonging to each category.
‡The denominator used in the calculation of percentages was the number of adults with type-2 Diabetes, defined as all participants with diabetes excluding those who were both diagnosed at age <25 and were currently being treated with insulin, who were classified as having type-1 diabetes. Estimates were age adjusted using the projected 2000 U.S. population as the standard population and using four age groups: 18–24 years, 25–44 years, 45–64 years, and 65 years and over”.
§ Standard Errors.
|| For each individual characteristic, the denominator used in the calculation of percentages was the number of adults with type-2 Diabetes for whom a response was recorded for the particular characteristic. Estimates were age adjusted using the projected 2000 U.S. population as the standard population and using four age groups: 18–24 years, 25–44 years, 45–64 years, and 65 years and over”.
¶ Chi-square analyses comparing individuals with Type-2 diabetes who used CM to treat/manage their diabetes versus those not using CM to treat/manage their diabetes.
# Based on the following six measures: 5 or more years since time of diagnosis, use of insulin or oral hypoglycemic drugs, at least one functional limitation attributed to the diabetes, weak or failing kidneys, Coronary Heart Disease, and severe vision problems.
** Includes all health conditions included in the NHIS except weak or failing kidney, severe vision problems, coronary heart disease, hypertension, and anxiety or depression.
to the composite measure. Although no statistically sig-nificant associations were seen in the unadjusted ana-lyses (Table 3), the odds ratio point estimates for use of diabetes prescription medications and coronary heart disease suggest negative associations with CM use, while the point estimates for the other four measures suggest positive associations with CM use. In the adjusted model, those individuals whose diabetes was diagnosed 10 or more years ago had 66% greater odds of using CM than those diagnosed within the last five years, while those individuals with a functional limitation resulting from their diabetes had 74% greater odds of using CM than individuals without a limitation (Table 3). Adjusting for covariates in the logistic regression model did not substantially change the odds ratio point estimates for the other measures of diabetes severity. Simultaneously
adding all individual measures of diabetes severity to the adjusted model at the same time also did not substan-tially change any of these findings (data not shown).
Control variables
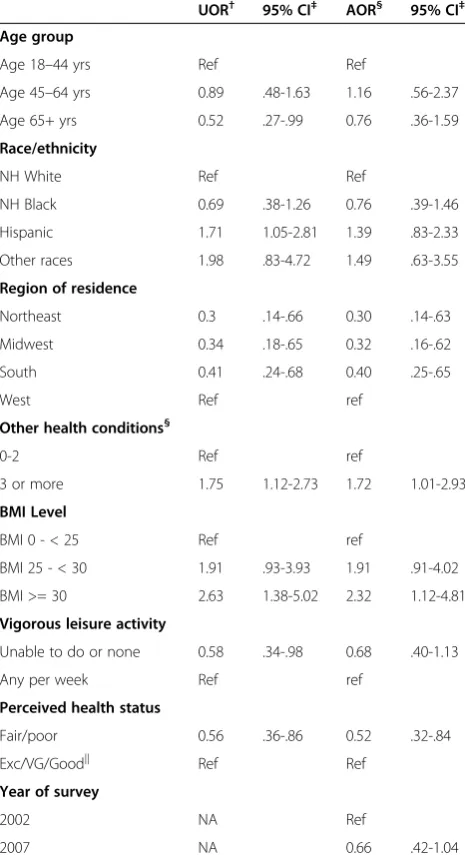
[image:10.595.60.541.98.434.2]Table 4 presents unadjusted and adjusted odds ratios for the control variables included in the regression models. In both the unadjusted and adjusted analyses, residing in the West versus other parts of the country, having an unhealthily high BMI (>=30), and having three or more comorbidities (other than weak/failing kidneys, severe vision problems, coronary heart disease, or hyperten-sion) were significantly associated with higher CM use, while having a fair or poor perceived health status was associated with significantly lower CM use (Table 4). Whereas in the unadjusted analysis Hispanic respondents
Table 3 Associations of diabetes severity with use of complementary medicine (CM)* to treat/manage type-2 diabetes
UOR† 95% CI‡ AOR§ 95% CI‡
Count of diabetes severity measures||
0-2 measures ref Ref
>=3 measures 1.27 .83-1.94 1.90 1.2-3.01
Individual measures of diabetes severity
DM duration
1-< 5 years ref Ref
5-<10 years 0.63 .34-1.18 0.70 .36-1.35
>= 10 years 1.15 .71-1.85 1.66 1.04-2.66
Diabetes medication use
None ref Ref
Any 0.63 .36-1.06 0.66 .36-1.19
Functional limitation
No ref Ref
Yes 1.47 .95-2.25 1.74 1.09-2.80
Weak/failing kidneys
No ref Ref
Yes 1.15 .53-2.47 1.46 .60-3.53
Coronary Heart Disease
No ref Ref
Yes 0.55 .28-1.10 0.87 .43-1.74
Severe vision problems
No ref Ref
Yes 1.1 .68-1.78 1.48 .85-2.57
* CM use, the dependent variable for this study, was defined as use of any of the following in the past 12 months: acupuncture, Ayurveda, biofeedback, chelation therapy, chiropractic care, chiropractic or osteopathic manipulation, energy healing therapy/Reiki, folk medicine, hypnosis, massage therapy, movement based therapies, naturopathy, herbal supplements and other non-vitamin/non-mineral dietary supplements (NVNMDS), homeopathic treatment, diet-based therapies, traditional healers, yoga, tai chi, qi gong, and relaxation techniques.
†unadjusted or crude odds ratio.
‡95% confidence interval.
§ Adjusted Odds Ratio. The model controls for socio-demographic and health status variables significantly associated (p < 0.1) with the dependent variables in Table2: race/ethnicity, region of residence, number of co-morbid conditions, BMI level, the ability to perform vigorous leisure activity at least once per week and perceived health status, as well as for year of survey.
were found to have significantly higher odds of using CM than were non-Hispanic whites, those differences became non-significant in multivariate analyses. Similarly, after adjusting for the other variables, the negative relation-ships between CM use and being at least 65 years of age, and CM use and the inability to perform vigorous activity disappeared, though the point estimates remained above 1.0.
Types of CM therapies used
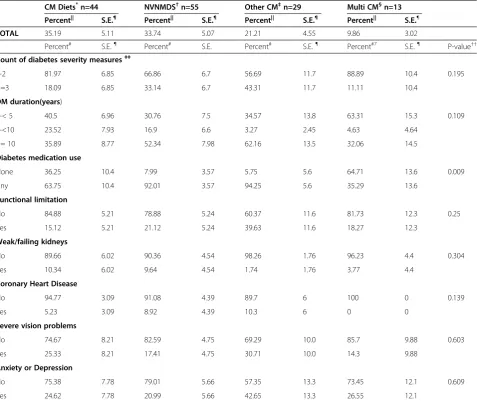
In exploratory analyses, we examined the prevalence of use of four categories of CM to treat type-2 diabetes, and their associations with diabetes severity. Of the four categories, diet-based interventions (35.19%, S.E. 5.11) were the most used group of therapies followed closely by non-vitamin/non-mineral dietary supplements (NVNMDS) (33.74%, S.E. 5.07), then more distantly by therapies cate-gorized as“other”(21%, S.E> 4.55). Relatively few indivi-duals used multiple CM therapies (9.86%, S.E. 3.02) to treat or manage their diabetes. Of the measures of dia-betes severity, only use of diadia-betes prescription medi-cations varied significantly by CM category (Table 5). Individuals who used only NVNMDS were more likely to use diabetes prescription medications than did indivi-duals who used multiple CM therapies.
A total of 12 different NVNMDS were used by indivi-duals to treat or manage their diabetes: glucosamine, fiber or psyllium, fish oil or omega 3, flax seed oil, garlic supplements, ginseng, green tea pills, saw palmetto, cranberry pills, evening primrose, milk thistle, and leci-thin. However, the numbers using each agent were too small to permit any demographic analyses.
Within the“Other”CM category, individuals used nine different therapies to treat or manage their diabetes: acu-puncture, biofeedback, folk medicine, chiropractic care, homeopathy, naturopathy, relaxation techniques, tai chi, and yoga. Too few individuals used any specific “other” therapy to permit detailed analyses.
Reasons for CM use
Of those who used CM to treat or manage their dia-betes, 20.13% (S.E. 3.87) said they did so because they believed conventional treatments did not help, while 21.3% (S.E. 4.17) did so because they felt conventional medical treatments were too expensive. No associations were seen between the response to these questions and measures of diabetes severity (data not shown).
Sensitivity analyses
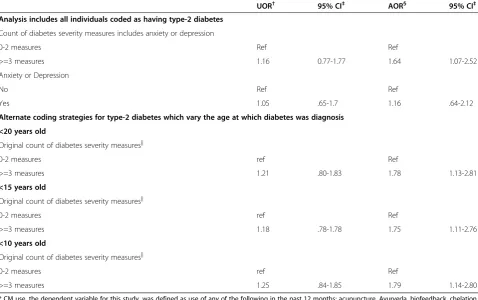
[image:11.595.57.290.124.552.2]Sensitivity analyses are presented in Table 6. While addition of anxiety/depression (as a diabetes complica-tion) to the count measure of disease severity produced a small reduction in the strength of association between disease severity and use of CM (from AOR= 1.9 to
Table 4 Associations of socio-demographic and health status variables with use of complementary medicine (CM)* to treat/manage type-2 diabetes
UOR† 95% CI‡ AOR§ 95% CI‡
Age group
Age 18–44 yrs Ref Ref
Age 45–64 yrs 0.89 .48-1.63 1.16 .56-2.37
Age 65+ yrs 0.52 .27-.99 0.76 .36-1.59
Race/ethnicity
NH White Ref Ref
NH Black 0.69 .38-1.26 0.76 .39-1.46
Hispanic 1.71 1.05-2.81 1.39 .83-2.33
Other races 1.98 .83-4.72 1.49 .63-3.55
Region of residence
Northeast 0.3 .14-.66 0.30 .14-.63
Midwest 0.34 .18-.65 0.32 .16-.62
South 0.41 .24-.68 0.40 .25-.65
West Ref ref
Other health conditions§
0-2 Ref ref
3 or more 1.75 1.12-2.73 1.72 1.01-2.93
BMI Level
BMI 0 - < 25 Ref ref
BMI 25 - < 30 1.91 .93-3.93 1.91 .91-4.02
BMI >= 30 2.63 1.38-5.02 2.32 1.12-4.81
Vigorous leisure activity
Unable to do or none 0.58 .34-.98 0.68 .40-1.13
Any per week Ref ref
Perceived health status
Fair/poor 0.56 .36-.86 0.52 .32-.84
Exc/VG/Good|| Ref Ref
Year of survey
2002 NA Ref
2007 NA 0.66 .42-1.04
* CM use, the dependent variable for this study, was defined as use of any of the following in the past 12 months: acupuncture, Ayurveda, biofeedback, chelation therapy, chiropractic care, chiropractic or osteopathic manipulation, energy healing therapy/Reiki, folk medicine, hypnosis, massage therapy, movement based therapies, naturopathy, herbal supplements and other non-vitamin/non-mineral dietary supplements (NVNMDS), homeopathic treatment, diet-based therapies, traditional healers, yoga, tai chi, qi gong, and relaxation techniques.
†unadjusted or crude odds ratio.
‡95% confidence interval.
§ Adjusted Odds Ratio. The model controls for socio-demographic and health status variables significantly associated (p < 0.1) with the dependent variable in Table2: race/ethnicity, region of residence, number of co-morbid conditions, BMI level, presence of coronary heart disease, the ability to perform vigorous leisure activity at least once per week and perceived health status, as well as for year of survey.
AOR= 1.74), the association remained statistically sig-nificant. As an individual measure of diabetes severity, anxiety/depression was not associated with CM use. Stepping down the age cutoff for diagnosis of diabetes from <25 years of age to <10 years of age produced a slight reduction in the strength of the association
between diabetes severity and use of CM (AOR=1.9 to AOR 1.79) that remained statistically significant.
Discussion
[image:12.595.61.539.111.514.2]To our knowledge, this is the first report to examine the association between the use of CM and severity of
Table 5 Use of selected complementary medicine (CM) categories to treat/manage type-2 diabetes, by selected measures of diabetes severity
CM Diets*n=44 NVNMDS†n=55 Other CM‡n=29 Multi CM§n=13
Percent|| S.E.¶ Percent|| S.E.¶ Percent|| S.E.¶ Percent|| S.E.¶
TOTAL 35.19 5.11 33.74 5.07 21.21 4.55 9.86 3.02
Percent# S.E.¶ Percent# S.E. Percent# S.E.¶ Percent#7 S.E.¶ P-value††
Count of diabetes severity measures‡‡
0-2 81.97 6.85 66.86 6.7 56.69 11.7 88.89 10.4 0.195
>=3 18.09 6.85 33.14 6.7 43.31 11.7 11.11 10.4
DM duration(years)
1-< 5 40.5 6.96 30.76 7.5 34.57 13.8 63.31 15.3 0.109
5-<10 23.52 7.93 16.9 6.6 3.27 2.45 4.63 4.64
>= 10 35.89 8.77 52.34 7.98 62.16 13.5 32.06 14.5
Diabetes medication use
None 36.25 10.4 7.99 3.57 5.75 5.6 64.71 13.6 0.009
Any 63.75 10.4 92.01 3.57 94.25 5.6 35.29 13.6
Functional limitation
No 84.88 5.21 78.88 5.24 60.37 11.6 81.73 12.3 0.25
Yes 15.12 5.21 21.12 5.24 39.63 11.6 18.27 12.3
Weak/failing kidneys
No 89.66 6.02 90.36 4.54 98.26 1.76 96.23 4.4 0.304
Yes 10.34 6.02 9.64 4.54 1.74 1.76 3.77 4.4
Coronary Heart Disease
No 94.77 3.09 91.08 4.39 89.7 6 100 0 0.139
Yes 5.23 3.09 8.92 4.39 10.3 6 0 0
Severe vision problems
No 74.67 8.21 82.59 4.75 69.29 10.0 85.7 9.88 0.603
Yes 25.33 8.21 17.41 4.75 30.71 10.0 14.3 9.88
Anxiety or Depression
No 75.38 7.78 79.01 5.66 57.35 13.3 73.45 12.1 0.609
Yes 24.62 7.78 20.99 5.66 42.65 13.3 26.55 12.1
* Vegetarian diet, Macrobiotic diet, Atkins diet, Pritikin diet, Ornish diet, Zone diet, and South Beach.
†herbal supplements and other non-vitamin/non-mineral dietary supplements.
‡acupuncture, Ayurveda, biofeedback, chelation therapy, chiropractic care, chiropractic or osteopathic manipulation, energy healing therapy/Reiki, folk medicine, hypnosis, massage therapy, movement based therapies, naturopathy, homeopathic treatment, traditional healers, yoga, tai chi, qi gong, and relaxation techniques § Any combination of multiple CM therapies.
|| The denominator used in the calculation of percentages was the number of adults with type-2 diabetes who used any CM therapy to treat/manage their diabetes. Estimates were age adjusted using the projected 2000 U.S. population as the standard population and using four age groups: 18–24 years, 25–44 years, 45–64 years, and 65 years and over.
¶ Standard Errors.
# The denominator used in the calculation of percentages was the number of adults with type-2 Diabetes who used the indicated type of CM therapy. Estimates were age adjusted using the projected 2000 U.S. population as the standard population and using four age groups: 18–24 years, 25–44 years, 45–64 years, and 65 years and over.
††Chi-square analyses comparing use of the indicated CM therapies in individuals with Type-2 diabetes who use CM to treat/manage their diabetes
diabetes in a large, nationally representative population sample. We found that only a small proportion of indi-viduals coded with type-2 diabetes used CM to treat or manage their diabetes (3.4%). However, in this small cohort, persons with the most severe disease (as assessed by having 3 or more measures of diabetes severity) had almost twice the odds of using a comple-mentary therapy as those with less severe disease. This association was relatively insensitive to the inclusion of anxiety/depression as a diabetes complication, and to changes in the age at diagnosis cutoff for differentiating type-1 and type-2. Furthermore, we found that persons who had diabetes 10 or more years and those who had a functional limitation resulting from their diabetes were more likely to use at least one CM therapy. Our study could not determine whether the use of CM is a direct result of diabetes severity or whether other unmeasured and uncontrolled factors motivate use.
[image:13.595.58.537.112.412.2]While our observation that 30.9% of individuals with type-2 diabetes used CM for any reason is consistent with early reports [11,12], our finding that only 3.4% of individuals with type-2 specifically use CM to treat or manage their diabetes is substantially lower than that reported by Yeh et al., 2002 (20%)[11]. Although it is possible some of these discrepancies reflect real changes in use over time, it is more likely the discrepancies reflect methodological differences in the two surveys. In calculating their prevalence of CM use in 1997, Yeh and colleagues [11] included four types of therapies not included in the present analyses: folk remedies (2.9%) (included in the 2002 but not 2007 NHIS), commercial diets (6.4%), high dose vitamins (1.7%) and self-help groups (2.3%). In addition, Yeh et al. [11] found higher use of herbal medicines to treat or manage diabetes then we did for NVNMDS in the present study, 6.7% vs. 1.1%, respectively. This discrepancy is most likely explained by
Table 6 Sensitivity Analyses of associations between diabetes severity and use of complementary medicine (CM)* to treat/manage type-2 diabetes
UOR† 95% CI‡ AOR§ 95% CI‡
Analysis includes all individuals coded as having type-2 diabetes
Count of diabetes severity measures includes anxiety or depression
0-2 measures Ref Ref
>=3 measures 1.16 0.77-1.77 1.64 1.07-2.52
Anxiety or Depression
No Ref Ref
Yes 1.05 .65-1.7 1.16 .64-2.12
Alternate coding strategies for type-2 diabetes which vary the age at which diabetes was diagnosis
<20 years old
Original count of diabetes severity measures||
0-2 measures ref Ref
>=3 measures 1.21 .80-1.83 1.78 1.13-2.81
<15 years old
Original count of diabetes severity measures||
0-2 measures ref Ref
>=3 measures 1.18 .78-1.78 1.75 1.11-2.76
<10 years old
Original count of diabetes severity measures||
0-2 measures ref Ref
>=3 measures 1.25 .84-1.85 1.79 1.14-2.80
* CM use, the dependent variable for this study, was defined as use of any of the following in the past 12 months: acupuncture, Ayurveda, biofeedback, chelation therapy, chiropractic care, chiropractic or osteopathic manipulation, energy healing therapy/Reiki, folk medicine, hypnosis, massage therapy, movement based therapies, naturopathy, herbal supplements and other non-vitamin/non-mineral dietary supplements (NVNMDS), homeopathic treatment, diet-based therapies, traditional healers, yoga, tai chi, qi gong, and relaxation techniques.
†unadjusted or crude odds ratio.
‡95% confidence interval.
§ Adjusted Odds Ratio. The model controls for socio-demographic and health status variables significantly associated (p < 0.1) with the dependent variables in Table2: race/ethnicity, region of residence, number of co-morbid conditions, BMI level, the ability to perform vigorous leisure activity at least once per week and perceived health status, as well as for year of survey.
that fact that Yeh et al. [11] employed a global question on use of “herbal medicine”, while in the NHIS partici-pants were asked if they used specific NVNMDS on a list.
While the inverse association between the use of CM and the use of prescription diabetes medications failed to reach significance in either the unadjusted or adjusted logistic regression models, some comment is still war-ranted given concerns of herb-drug interactions [38] or the substitution of CM therapies for proven conven-tional therapies for diabetes [39]. There are two compe-ting interpretations of our observation: 1) those using CM are more likely to forego needed conventional treat-ment; or 2) individuals with less severe disease not requiring medical interventions are more likely to use CM. When examining CM categories, we observed that diabetes medication use predominates in CM users across categories except in participants using multiple CM therapies (only 35.3% of whom used diabetic medi-cations). Except for multiple CM users, the present CM category data are consistent with a regional survey of older rural adults diagnosed with diabetes (N= 679)[40], where no difference in diabetes medication adherence was found between those who used CM and those who didn’t.
Consistent with our observation that most individuals (77%) who use CM for their diabetes also use conven-tional diabetes prescription medications are the data of Garrow and Egede [41] who found that individuals with diabetes using CM (for any reason) were more likely to receive regular preventive care than were individuals with diabetes who did not use CM. These quantitative findings are supported by qualitative research [8] sug-gesting that individuals with diabetes who try CM were highly motivated to control their diabetes and to try all methods available to them, and did not use CM as a substitute for conventional care.
We are aware of only one other article that discussed demographic characteristics of individuals in the United States using CM specifically to treat or manage their dia-betes [7]. In this survey of rural older adults in North Carolina, it was found that in those using CM for their diabetes, home remedies were the prevalent type of CM therapy used, with their use associated with race/ethnicity and the number of co-morbidities. In the present study, we also found that the number of co-morbidities was associated with the overall use of CM but did not see a re-lationship between CM use and race/ethnicity. Unfortu-nately, the NHIS did not specifically look at use of home remedies, which may explain the differences in our find-ings from Arcury et al. [7].
Our analyses revealed an interesting paradox in that persons with more severe diabetes are more likely to use CM to treat/manage their diabetes, but persons with
poorer perceived general health status were less likely to use CM (OR 0.56, 95% CI .33-.86). Using data from the 2007 NHIS, Nguyen and colleagues [42] observed a similar paradox in the general population where indi-viduals“using CAM were more likely to have chronic ill-ness . . . yet also were more likely to report that their health status was excellent and better than the prior year.”Nguyen et al., [42] suggested two possible reasons for the paradox, both of which also apply to our ana-lyses: 1) different timeframes for the health status ques-tions (current status) and illness self-reports (previous 12-months); 2) positive expectations of CM use may positively impact perceived health status.
We found that relatively few individuals with diabetes who used CM for their diabetes used more than one type of CM therapy (<10%). This is in contrast to the general population in 2007 (unpublished observation) where 41.4% of CM users used more than one type of therapy, or in 2002 or 1997 where, respectively, 33.4% [43] and 54% [44] of CM users used more than one type of therapy (as in the present analysis, these studies counted use of multiple NVNMDS or multiple diet-based therapies only once each).
change our findings. However, clearly our study needs to be replicated in a dataset that incorporates confirmed physician diagnosis of diabetes by type and also contains information on the use of CM. Fourth, it is possible that additional measures of diabetes severity (as well as other unexplored factors) explain more of the observed relation-ships. However, the six measures employed are predictors of mortality and morbidity in diabetes [50,51]. Fifth, be-cause our primary focus was to identify factors associated with the use, versus nonuse, of CM, a dichotomous dependent variable was utilized for the primary analysis. By doing so, information on frequency and/or intensity of use was lost. It may be that substantial differences exist between heavy and light users of one or more CM modal-ities [44]. Sixth, it has been found that the use of specific types of CM therapies is associated with specific personal-ity styles [52]. These associations might confound our results if specific personality styles (e.g., “openness” or
“control”) are also related to better diabetes control. Fi-nally, despite combining data from two very large national surveys in the United States, the number of respondents using CM specifically to treat their diabetes was small (141 respondents, equivalent to 3.4% of individuals with type-2 diabetes). While this may have increased the chance of type-2 error (false negatives) in our analyses and certainly prevented assessment of individual CM thera-pies, it does not change our confidence in the positive associations we did observe.
Conclusions
Our results demonstrate that individuals with more se-vere diabetes are more likely to use CM independent of sociodemographic factors. Further studies are essential to determine if CM therapies, either alone or in combi-nation with conventional approaches, actually improve clinical outcomes when used to treat/manage diabetes. Also warranted are studies investigating the cause and effect relationships underlying the associations between diabetes severity and CM use. Knowledge of these spe-cific patterns of use may contribute to tailoring health education programs for diabetes. For health care provi-ders, understanding the motivations behind a patient’s use of CM may assist in the design of an optimal treat-ment plan [53]. The fact that users of CM appear willing to take active control of their health [54-56], suggests that this group of individuals with diabetes may well be open to additional recommendations toward managing their disease.
Competing interests
All authors declare they have no competing interests.
Authors’contributions
RLN and BJS contributed to the study conception and design. DBC programmed the study. RLN and DBC analyzed the data. RLN and NK interpreted the results. RLN developed the first draft of the manuscript. DBC,
BJS, and NK reviewed and edited the manuscript. The final draft for submission was read and approved by all authors. The findings and conclusions in this report are those of the authors and do not necessarily represent the official position of the National Institutes of Health. All authors have read and approved the final manuscript.
Acknowledgements
R.L.N., B.J.S., and N.K. were employees of the federal government during the planning, analysis and writing of this manuscript, and performed their work as part of their official duties. No outside financial support was provided. D.B. C., worked as a federal contractor during the planning, analysis and writing of this manuscript, and performed this work as part of this contract.
Author details
1National Center for Complementary and Alternative Medicine, National
Institutes of Health, 6707 Democracy Blvd, Bethesda, MD 20892-5475, USA. 2Social & Scientific Systems, Inc, 8757 Georgia Avenue, Silver Spring, MD
20910, USA.
Received: 6 February 2012 Accepted: 11 October 2012 Published: 22 October 2012
References
1. American Diabetes Association:Standards of medical care in diabetes– 2011.Diabetes Care2011,34(1):S11–S61.
2. DAFNE Study Group:Training in flexible, intensive insulin management to enable dietary freedom in people with type 1 diabetes: dose adjustment for normal eating (DAFNE) randomised controlled trial.
BMJ2002,325:746.
3. Gaede P, Valentine WJ, Palmer AJ, Tucker DM, Lammert M, Parving HH, Pedersen O:Cost-effectiveness of intensified versus conventional multifactorial intervention in type-2 diabetes: results and projections from the Steno-2 study.Diabetes Care2008,31:1510–1515.
4. Brownson CA, Hoerger TJ, Fisher EB, Kilpatrick KE:Cost-effectiveness of diabetes self-management programs in community primary care settings.Diabetes Educ2009,35:761–769.
5. Hernandez CA, Bradish GI, Rodger NW, Rybansky SI:Self-awareness in diabetes: using body cues, circumstances, and strategies.Diabetes Educ
1999,25:576–584.
6. Paterson B, Thorne S:Expert decision making in relation to unanticipated blood glucose levels.Res Nurs Health2000,23:147–157.
7. Arcury TA, Bell RA, Snively BM, Smith SL, Skelly AH, Wetmore LK, Quandt SA: Complementary and alternative medicine use as health
self-management: rural older adults with diabetes.J Gerontol B Psychol Sci Soc Sci2006,61:S62–S70.
8. Hunt LM, Arar NH, Akana LL:Herbs, prayer, and insulin. Use of medical and alternative treatments by a group of Mexican American diabetes patients.J Fam Pract2000,49:216–223.
9. Eisenberg DM, Kessler RC, Foster C, Norlock FE, Calkins DR, Delbanco TL: Unconventional medicine in the United States. Prevalence, costs, and patterns of use.N Engl J Med1993,328:246–252.
10. Astin JA:Why patients use alternative medicine: results of a national study.JAMA1998,279:1548–1553.
11. Yeh GY, Eisenberg DM, Davis RB, Phillips RS:Use of complementary and alternative medicine among persons with diabetes mellitus: results of a national survey.Am J Public Health2002,92:1648–1652.
12. Bell RA, Suerken CK, Grzywacz JG, Lang W, Quandt SA, Arcury TA: Complementary and alternative medicine use among adults with diabetes in the United States.Altern Ther Health Med2006,12:16–22. 13. Garrow D, Egede LE:National patterns and correlates of complementary
and alternative medicine use in adults with diabetes.J Altern Complement Med2006,12:895–902.
14. Graham RE, Ahn AC, Davis RB, O’Connor BB, Eisenberg DM, Phillips RS:Use of complementary and alternative medical therapies among racial and ethnic minority adults: results from the 2002 National Health Interview Survey.J Natl Med Assoc2005,97:535–545.
16. Barnes PM, Powell-Griner E, McFann K, Nahin RL:Complementary and alternative medicine use among adults: United States, 2002.Adv Data
2004,343:1–19.
17. Barnes PM, Bloom B, Nahin RL:Complementary and alternative medicine use among adults and children: United States, 2007.Natl Health Stat Report2008,12:1–23.
18. Schuster TL, Dobson M, Jauregui M, Blanks RH:Wellness lifestyles I: A theoretical framework linking wellness, health lifestyles, and
complementary and alternative medicine.J Altern Complement Med2004, 10:349–356.
19. Bair YA, Gold EB, Greendale GA, Sternfeld B, Adler SR, Azari R, Harkey M: Ethnic differences in use of complementary and alternative medicine at midlife: longitudinal results from SWAN participants.Am J Public Health
2002,92:1832–1840.
20. Cheung CK, Wyman JF, Halcon LL:Use of complementary and alternative therapies in community-dwelling older adults.J Altern Complement Med
2007,13:997–1006.
21. Gray CM, Tan AW, Pronk NP, O’Connor PJ:Complementary and alternative medicine use among health plan members. A cross-sectional survey.
Eff Clin Pract2002,5:17–22.
22. Downey L, Tyree PT, Lafferty WE:Preventive screening of women who use complementary and alternative medicine providers.J Womens Health (Larchmt)2009,18:1133–1143.
23. Harris MI, Cowie CC, Howie LJ:Self-monitoring of blood glucose by adults with diabetes in the United States population.Diabetes Care1993, 16(8):1116–1123.
24. Ford ES, Malarcher AM, Herman WH, Aubert RE:Diabetes mellitus and cigarette smoking. Findings from the 1989 National Health Interview Survey.Diabetes Care1994,17(7):688–692.
25. Young BA, Lin E, Von Korff M, Simon G, Ciechanowski P, Ludman EJ Everson-Stewart S, Kinder L, Oliver M, Boyko EJ, Katon WJ:Diabetes complications severity index and risk of mortality, hospitalization, and healthcare utilization.Am J Manag Care2008,14(1):15–23.
26. Rosenzweig JL, Weinger K, Poirier-Solomon L, Rushton M:Use of a disease severity index for evaluation of healthcare costs and management of comorbidities of patients with diabetes mellitus.Am J Manag Care2002, 8(11):950–958.
27. Linzer M, Pierce C, Lincoln E, Miller DR, Payne SM, Clark JA, Skinner KM, Greenfield S, Kaplan S, McHorney CA, Lee A, Kazis LE:Preliminary validation of a patient-based self-assessment measure of severity of illness in type 2 diabetes: results from the pilot phase of the Veterans Health Study.
J Ambul Care Manage2005,28(2):167–176.
28. Maddigan SL, Majumdar SR, Toth EL, Feeny DH, Johnson JA, DOVE Investigators:Health-related quality of life deficits associated with varying degrees of disease severity in type 2 diabetes.Health Qual Life Outcomes
2003,1:78–88.
29. Pan A, Lucas M, Sun Q, van Dam RM, Franco OH, Manson JE, Willett WC, Ascherio A, Hu FB:Bidirectional association between depression and type 2 diabetes mellitus in women.Arch Intern Med2010,170(21):1884–1891. 30. Renn BN, Feliciano L, Segal DL:The bidirectional relationship of
depression and diabetes: a systematic review.Clin Psychol Rev2011, 31(8):1239–1246.
31. Nahin RL, Dahlhamer JM, Stussman BJ:Health need and the use of alternative medicine among adults who do not use conventional medicine.BMC Health Serv Res2010,10:220.
32. Schunk M, Reitmeir P, Schipf S, Völzke H, Meisinger C, Thorand B, Kluttig A, Greiser KH, Berger K, Müller G, Ellert U, Neuhauser H, Tamayo T, Rathmann W, Holle R:Health-related quality of life in subjects with and without Type 2 diabetes: pooled analysis of five population-based surveys in Germany.Diabet Med2012,29(5):646–653.
33. Schipf S, Werner A, Tamayo T, Holle R, Schunk M, Maier W, Meisinger C, Thorand B, Berger K, Mueller G, Moebus S, Bokhof B, Kluttig A, Greiser KH, Neuhauser H, Ellert U, Icks A, Rathmann W, Völzke H:Regional differences in the prevalence of known Type 2 diabetes mellitus in 45-74 years old individuals: Results from six population-based studies in Germany (DIAB-CORE Consortium).Diabet Med2012,29(7):e88–e95.
34. SEARCH for Diabetes in Youth Study Group, Liese AD, D’Agostino RB Jr, Hamman RF, Kilgo PD, Lawrence JM, Liu LL, Loots B, Linder B, Marcovina S, Rodriguez B, Standiford D, Williams DE:The burden of diabetes mellitus among US youth: prevalence estimates from the SEARCH for Diabetes in Youth Study.Pediatrics2006,118(4):1510–1518.
35. Bays HE, Bazata DD, Clark NG, Gavin JR 3rd, Green AJ, Lewis SJ, Reed ML, Stewart W, Chapman RH, Fox KM, Grandy S:Prevalence of self-reported diagnosis of diabetes mellitus and associated risk factors in a national survey in the US population: SHIELD (Study to Help Improve Early evaluation and management of risk factors Leading to Diabetes).
BMC Publ Health2007,7:277.
36. Bell RA, Mayer-Davis EJ, Beyer JW, D’Agostino RB Jr, Lawrence JM, Linder B, Liu LL, Marcovina SM, Rodriguez BL, Williams D, Dabelea D, SEARCH for Diabetes in Youth Study Group:Diabetes in non-Hispanic white youth: prevalence, incidence, and clinical characteristics: the SEARCH for Diabetes in Youth Study.Diabetes Care2009, 32(Suppl 2):S102–S111.
37. Mayer-Davis EJ, Beyer J, Bell RA, Dabelea D, D’Agostino R Jr, Imperatore G, Lawrence JM, Liese AD, Liu L, Marcovina S, Rodriguez B, SEARCH for Diabetes in Youth Study Group:Diabetes in African American youth: prevalence, incidence, and clinical characteristics: the SEARCH for Diabetes in Youth Study.Diabetes Care2009,32(Suppl 2):S112–S122. 38. Geil P, Shane-McWhorter L:Dietary supplements in the management
of diabetes: potential risks and benefits.J Am Diet Assoc2008, 108:S59–S65.
39. Ernst E:Complementary medicine: its hidden risks.Diabetes Care2001, 24:1486–1488.
40. Bell RA, Stafford JM, Arcury TA, Snively BM, Smith SL, Grzywacz JG, Quandt SA:Complementary and Alternative Medicine Use and Diabetes Self-Management Among Rural Older Adults.Complement Health Pract Rev 12006,11(2):95–106.
41. Garrow D, Egede LE:Association between complementary and alternative medicine use, preventive care practices, and use of conventional medical services among adults with diabetes.Diabetes Care2006, 29:15–19.
42. Nguyen LT, Davis RB, Kaptchuk TJ, Phillips RS:Use of complementary and alternative medicine and self-rated health status: results from a national survey.J Gen Intern Med2011,26(4):399–404.
43. Neiberg RH, Aickin M, Grzywacz JG, Lang W, Quandt SA, Bell RA, Arcury TA: Occurrence and co-occurrence of types of complementary and alternative medicine use by age, gender, ethnicity, and education among adults in the United States: the 2002 National Health Interview Survey (NHIS).J Altern Complement Med2011,17:363–370.
44. Wolsko PM, Eisenberg DM, Davis RB, Ettner SL, Phillips RS:Insurance coverage, medical conditions, and visits to alternative medicine providers: results of a national survey.Arch Intern Med2002, 162:281–287.
45. Baranowski T:Methodologic issues in self-report of health behavior.J Sch Health1985,55:179–182.
46. Newell SA, Girgis A, Sanson-Fisher RW, Savolainen NJ:The accuracy of self-reported health behaviors and risk factors relating to cancer and cardiovascular disease in the general population: a critical review.Am J Prev Med1999,17:211–229.
47. Dufour MC:If you drink alcoholic beverages do so in moderation: what does this mean?J Nutr2001,131:552S–561S.
48. Brener ND, Billy JO, Grady WR:Assessment of factors affecting the validity of self-reported health-risk behavior among adolescents: evidence from the scientific literature.J Adolesc Health2003,33:436–457.
49. Harris MI, Robbins DC:Prevalence of adult-onset IDDM in the U.S. population.Diabetes Care1994,17(11):1337–1340.
50. Maddigan SL, Majumdar SR, Toth EL, Feeny DH, Johnson JA:Health-related quality of life deficits associated with varying degrees of disease severity in type-2 diabetes.Health Qual Life Outcomes2003,1:78.
51. Young BA, Lin E, Von KM, Simon G, Ciechanowski P, Ludman EJ, Everson-Stewart S, Kinder L, Oliver M, Boyko EJ, Katon WJ:Diabetes complications severity index and risk of mortality, hospitalization, and healthcare utilization.Am J Manag Care2008,14:15–23.
52. Honda K, Jacobson JS:Use of complementary and alternative medicine among United States adults: the influences of personality, coping strategies, and social support.Prev Med2005,40:46–53.
53. van Kleffens T, van Baarsen B, van Leeuwen E:The medical practice of patient autonomy and cancer treatment refusals: a patients’and physicians’perspective.Soc Sci Med2004,58:2325–2336. 54. Vincent C, Furnham A, Willsmore M:The perceived efficacy of
55. McGregor KJ, Peay ER:The choice of alternative therapy for health care: testing some propositions.Soc Sci Med1996,43:1317–1327.
56. Swartzman LC, Harshman RA, Burkell J, Lundy ME:What accounts for the appeal of complementary/alternative medicine, and what makes complementary/ alternative medicine“alternative”?Med Decis Making
2002,22:431–450.
doi:10.1186/1472-6882-12-193
Cite this article as:Nahinet al.:Disease severity is associated with the use of complementary medicine to treat or manage type-2 diabetes: data from the 2002 and 2007 National Health Interview Survey.BMC Complementary and Alternative Medicine201212:193.
Submit your next manuscript to BioMed Central and take full advantage of:
• Convenient online submission
• Thorough peer review
• No space constraints or color figure charges
• Immediate publication on acceptance
• Inclusion in PubMed, CAS, Scopus and Google Scholar
• Research which is freely available for redistribution