Optimizing Process Parameters of Rotary Furnace using
Bio-fuels: An Interactive ANN approach
Purshottam Kumar
Dayalbagh Educational Institute
Dayalbagh, Agra-282005, U.P., INDIA – 282110
Ranjit Singh
Dayalbagh Educational Institute Dayalbagh, Agra-282005, U.P., INDIA - 282110
ABSTRACT
This paper deals with a novel interactive approach of Artificial Neural Network (ANN) as an optimization tool for optimizing process parameters of rotary furnace. This approach solves a very challenging problem in the area of rotary furnace i.e. selection of optimal process parameters for producing homogenous quality castings. Rotary furnace involves several critical parameters like flame temperature, preheat air temperature, rotational speed of the furnace, excess air percentage, melting time, fuel consumption and melting rate of the molten metal which should be controlled throughout the melting process. In this paper the relation between input parameters such as flame temperature, preheat air temperature, rotational speed of the furnace and excess air percentage is established with output parameters such as melting time, fuel consumption and melting rate. Our model of feed-forward and backward ANN can work in practical scenario of industry by predicting the output process parameter in any number, this also help the decision maker to know the impact of input parameter on output of furnace before actually running it and input parameter needed to fed to the rotary furnace to have output of perquisite parameter. Back propagation neural network is used as a decision support tool. The network maps the forward and reverse relationship between process inputs and process output and predicts the optimal process parameters almost instantaneously. Accuracy of the forecast depends on training of the input parameters and a well trained set of parameters provides high accuracy. Trained network replaces the knowledge of an experienced worker reducing labor cost drastically. The input and output process parameters of rotary furnace used in this work are obtained from the intensive experimentation conducted in the faculty of engineering, Dayalbagh Educational Institute, Agra.
Key Words:
Rotary furnace, Artificial Neural Network, Back propagation, Optimization1.
INTRODUCTION
Realizing the fact that process parameters in rotary furnace have direct impact over the quality of casting being produced, it becomes imperative to choose the right combination of these parameters. The correct combination of process parameters leads to fulfill various objectives. These objectives can be in terms of maximizing production, minimizing cost or maximizing quality. In normal course the selection of process parameters for rotary furnace is based on experience which
involves trial and error. This kind of approach does not guarantee to produce quality casting every time and also requires significant investment of time, raw material and human resource. In this paper, we present a solution to the problem of choosing appropriate process parameters for rotary furnace to produce quality homogeneous casting using artificial neural network approach.
[image:1.595.318.534.428.538.2]Nowadays artificial neural networks have been used extensively as a soft computing tool because of its inherent capability to learn mapping between a set of input and output values [2]. The output values can be easily predicted once the network is trained for a given set of input values. Accuracy of the forecast depends on the training of the network. Therefore in the process of forecasting it is necessary to train the network carefully and a well determined trained network provides required accuracy. In this work, the method uses one backpropagating neural network to accomplish the mapping of process inputs and process output. This network can then be used interactively to choose the best rotary furnace set up parameter.
Figure 1: Layout of Rotary Furnace
2.
ARTIFICIAL NEURAL NETWORKS
CONCEPT
Artificial Neural Networks (ANNs) are massively parallel adaptive networks of simple nonlinear computing elements called neurons or nodes which are intended to abstract and model some of the functionalities of the human nervous system in an attempt to partially capture some of its computational strengths.
A neural network consists of simple processing elements (nodes), connection links and learning rules. Each processing element collects input and produces an output after the weighted combined inputs are processed by an activation function. Connections are the links between nodes. The connections are characterized individually by their strength or weights and collectively by their configuration.
Artificial Neural Networks (ANNs) are currently gaining wide popularity in manufacturing field [3,4]. ANNs are proposed to represent the relationship between the operating conditions and the process-related variables because of their data driven approach i.e. they can capture and model extremely complex relationships even without the help of an explicitly stated mathematical model. This property of ANNs is extremely useful in situations where it is difficult to derive the mathematical model that links the various parameters.
3.
BACKPROPAGATION NEURAL
NETWORKS
The Back propagation (BP) neural network is a multiple layer network with one input layer, one output layer and some hidden layers between input and output layers [8]. Its learning procedure is based on gradient search with least sum squared optimality criterion. Calculation of the gradient is done by partial derivative of sum squared error with respect to weights. After the initial weights have been randomly specified and the input has been presented to the neural network, each neuron computed weighted sums of inputs from all neurons in the preceding layer are used as inputs to succeeding layers and final the networks weighted sum is calculated. The sums and activation (output) values for each neuron in each layer are propagated forward through to entire network to compute an actual output and error of each neuron in the output layer. The error for each neuron is computed as the difference between actual output and its corresponding target output, and then the partial derivative of sum-squared errors of all the neurons in the output layer is propagated back through the entire network and the weights are updated. In course of the BP learning, a gradient search procedure is used to find connection weights of the network, but it tends to trap itself into the local minima. The local minima may be avoided by adjusting value of the momentum.
4.
EXPERIMENTAL SET UP AND DATA
COLLECTION
The rotary furnace data used to train the artificial neural networks have been extracted from the experiments conducted on self designed and developed furnace as shown in the Figure 2, at Foundry Shop, Faculty of Engineering, D.E.I, Dayalbagh, Agra, India.
In the experimentation, 200 Kg. of the charge is melted in the rotary furnace. A Circular burner is used for burning bio-diesel blended Diesel Oil as fuel. Due to the heat transfer by conduction, when refractory material comes in contact with
Figure 2: Self Designed and Developed Rotary Furnace at
Foundry Shop, Faculty of Engineering, Dayalbagh Educational Institute, Dayalbagh, Agra
the molten charge, to have better heat transfer, the maximum time is given to refractory to be in contact with the charge. The quantity of fuel consumed is reduced in subsequent heats and normally it is found to be almost constant in third heat onwards [10,11].
Numbers of experiments were conducted at different percentage of excess air varying from 10% to 50% and amount of air preheat from 200oC to 400oC.
Large numbers of heats were taken from the rotary furnace with the variations of the above mentioned parameters and finally a set of 30 heats was obtained from the furnace. This data was used to train the artificial neural network.
5.
ANN APPLICATION FOR ROTARY
FURNACE PARAMETERS
Rotary furnace involves several critical parameters like flame temperature, preheat air temperature, rotational speed of the furnace, excess air percentage, melting time, fuel consumption and melting rate of the molten metal which should be controlled throughout the melting process which in turn are responsible for producing quality homogeneous castings [1,9]. In this section we present an artificial neural network based parameter selection for rotary furnace, considering the process input parameters as:
1) Flame temperature, tf.
2) Preheat air temperature, at.
3) Rotational speed of furnace , rm
4) Excess air percentage, ap
The process output parameters are taken as 1) Melting rate, mr.
2) Melting Time, mt
3) Fuel consumption, fc
In terms of decision making terminology, the decision space is a set of all possible combinations of flame temperature; preheat air temperature, revolutions per minute of the furnace, excess air percentage, melting time and fuel consumption for a particular objective such as maximizing melting rate. The objective space is a set of all mappings from decision space with the objective function such as melting rate. The goal in this rotary furnace set up problem is to choose the most preferred alternative of melting rate for a set of input process parameters (flame temperature, preheat air temperature, revolutions per minute of the furnace, excess air percentage, melting time and fuel consumption).
[image:2.595.315.539.73.190.2]Where x € X. Where X represents the decision space and an objective vector f = (mt, fc, mr )
where f € F. F represents the objective space. We wish to find the best x that maximizes f i.e,
Max f1(x), f2(x), …..fk(x)
s.t. f ≤ fmax
xmin ≤ x ≤ xmax
fmax represents the maximum in terms of process outputs and
xmax is maximum in terms of process inputs.
In this method two backpropagating error network are developed for learning forward mapping between the input and output process vectors and reverse mapping between output and input process vectors. The major advantage of this method is that the decision maker can directly interact between decision space and objective space for selecting the best rotary furnace parameters.
The procedure of optimizing the process parameters of rotary furnace consists of three phases:
1) Training phase and 2) Testing phase 3) Simulation phase
Training phase – In this phase the network is trained to learn the relationship between process inputs and process output. The steps followed in this phase are:
Step 1: Set frequency of progress displays, maximum number of epochs or iterations to train, sum-squared error goal, number of hidden layers, number of neurons in hidden layers, and number of epochs or iterations.
Step 2: Assign the training pair of input and output vectors as shown in table 1 and table 2 to the back propagation neural network.
Step 3: The network will attempt to learn the mapping and if the sum squared error goal is reached before the end of available epochs, the training is stopped. If the network is unavailable to reach the error value at the end of epochs, then error value is presented for further training.
If the error value is not reduced, increase the number of neurons or nodes in the hidden layer or number of hidden layers and go to step 2. Else go to step 3.
Step 4: The network has learned the mapping between input and output. Now, go to testing phase.
Testing phase – The network is provided with the values it is not familiar with and the results are tested with the experimental results. The steps followed in this phase are: Step 1: Present the trained network with input vectors which it is not familiar with as shown in table 3
Step 2: Obtain the output values and as shown in table 5 and compare them with the output obtained from experimentation as shown in table 4.
Step 3: If the process output values exceed the maximum allowable make suitable changes in the network, otherwise if the process output values are satisfactory, select the corresponding input vector and stop.
Simulation Phase – In this phase decision maker can make
desired changes in the output vector and can select the corresponding input vector.
Step 1: Forward mapping network is provided with process input vectors and obtain process outputs.
Step 2: Compare the obtained output process vectors with experimental values obtained from the furnace.
Step 3: If it is desired to make necessary changes in the output vector then these changes can be made and proceed to step 5 Step 4: Otherwise choose the corresponding process input vector if the results are satisfactory. Stop
Step 5: Present the changed process outputs in reverse mapping network and obtain the corresponding process inputs.
Step 6: If the results obtained by reverse mapping network are satisfactory, Stop. Otherwise again make suitable changes in process input vector and go to step 2.
6.
TRAINING,
TESTING
AND
SIMULATING ARTIFICIAL NEURAL
NETWORK
The Artificial Neural Network was implemented by using MATLAB software package (MATLAB version 7.0 with neural network toolbox) using 201 experimental data sets, out of which 180 data sets were used for training, testing and validation and rest 21 were used for verifying the results obtained by simulating the model.
For training the forward mapping artificial neural network following training parameters were used:
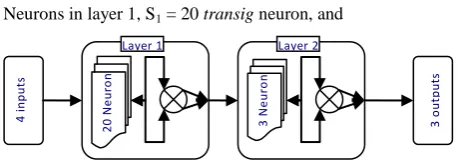
Layers in ANN = 2
Neurons in layer 1, S1 = 20 transig neuron, and
Figure 3: Training the forward mapping artificial neural
network
Neurons in layer 2, S2 = 3 purelin neuron
Network Training function used in the network = Levenberg-Marquardt optimization
Maximum number of epochs to train the network = 50 Maximum allowed system error or Sum-squared error goal = 10-9
Maximum performance increase by 1.04
Network performance function used is Mean squared error with regularization performance function
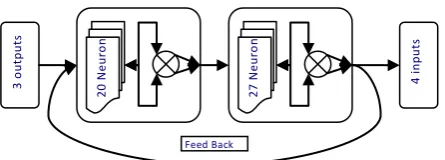
For training the reverse mapping artificial neural network following training parameters were used:
Layers in ANN = 2
Neurons in layer 1, S1 = 20 transig neuron, and Neurons in layer 2, S2 = 27 purelin neuron
Network Training function used in the network = Levenberg-Marquardt optimization
Maximum number of epochs to train = 50
3
o
u
tp
u
ts
4
i
n
p
u
ts
2
0
N
e
u
ro
n
3
N
e
u
ro
n
[image:3.595.314.544.404.486.2]Figure 4: Training the reverse mapping artificial neural network
Maximum allowed system error or Sum-squared error goal = 10-7
Maximum performance increase by 3.04
Network performance function used is Mean squared error with regularization performance function
Train the network. The network uses the default
Levenberg-Marquardt algorithm for training. The code randomly divided input vectors and target vectors into three sets as follows:
60% were used for training.
20% were used to validate that the network is generalizing and to stop training before overfitting.
[image:4.595.54.277.77.157.2] The last 20% were used as a completely independent test of network generalization.
[image:4.595.316.542.107.311.2]Table 1 and Table 2 shows the random data sets from among 180 experimental data sets used for input and output variables used for modeling of forward and reverse mapping neural network.
Table 1:A set of 15 out of 180 random values of process
input variables used for training, testing and validating the neural network
Sl. No.
Excess Air (%)
Flame Tempera ture (°C)
Rotatio nal Speed (RPM)
Preheat Air Temperat
ure (°C)
1 10 2190 0.8 200
2 10 2180 1 200
3 10 2160 1.2 200
4 20 1995 0.8 200
5 20 1985 1 200
6 20 1940 1.2 200
7 30 1905 0.8 200
8 30 1965 1 200
9 30 1915 1.2 200
10 40 1895 0.8 200
11 40 1955 1 200
12 40 1900 1.2 200
13 50 1865 0.8 200
14 50 1930 1 200
15 50 1760 2 400
Table 2:A set of 15 out of 180 random values of process
output variables used for training, testing and validating the neural network
Sl. No.
Melting Time (Minutes)
Fuel Consumed
(Liters)
Experimental Values of Melting Rate (MT/Hr.)
1 35 76 0.343
2 37 78 0.324
3 38 79 0.315
4 42 79 0.285
5 43 82 0.28
6 45 84 0.266
7 43 80 0.28
8 45 82 0.266
9 45 83 0.266
10 44 80 0.272
11 45 81 0.266
12 47 83 0.256
13 42 78 0.285
14 43 80 0.28
15 43 82 0.28
The network provided with input and output values was made to learn the mapping while reducing the error value to the desired value.
The simulation of neural network is done by feeding a new set of input process values for forward mapping and output process values for reverse mapping.
Table 3 shows the random data sets from among 21 input experimental value from rotary furnace, intentionally left for feeding as input data for feed forward ANN and table 4 have the random data sets of output received from rotary furnace for these 21 input values, which were used for verifying the result obtained by simulation of our feed forward ANN model. The vice-versa was used in backward ANN as table 4 was used as input for simulation and table 3 was used to verifying the result after simulation.
Table 3:A set of 10 out of 21 process input/output values
used for simulating the forward/backward neural network
Sl. No.
Excess Air (%)
Flame Temperat
ure (°C)
Rotation al Speed
(RPM)
Preheat Air Temperat
ure (°C)
1 10 2270 1 400
2 10 2110 2 200
3 20 2130 0.8 400
4 20 1935 1.2 200
5 30 1730 2 200
6 40 2065 1 400
7 40 1775 1.6 400
8 50 1960 0.8 300
9 50 2010 1 400
10 50 1750 1.6 400
4
i
n
p
u
ts
3
o
u
tp
u
ts
2
0
N
e
u
ro
n
2
7
N
e
u
ro
n
[image:4.595.314.541.111.311.2] [image:4.595.56.279.458.669.2]Table 4:A set of 10 out of 21 process output/input values used for simulating the forward/backward neural network
Sl. No. Melting
Time (Minutes)
Fuel Consumed
(Liters)
Experimental Values of Melting Rate (MT/Hr.)
1 34 76 0.343
2 38 80 0.315
3 38 78 0.315
4 45 85 0.266
5 50 88 0.24
6 42 80 0.285
7 42 80 0.285
8 41 79 0.292
9 41 79 0.292
10 44 82 0.272
21 output process values predicted by simulation from forward mapping are shown in Table 5 (random set). The 21 input process values predicted by simulation from backward mapping are shown in Table 6 (random set).
Table 5: A set of 10 out of 21 process output values derived
from simulating the forward neural network
Sl. No.
Melting Time (Minutes)
Fuel Consumed (Liters)
Experimental Values of Melting Rate (MT/Hr.)
[image:5.595.54.266.104.257.2]1 34.45072 75.9792 0.332786 2 37.74396 81.60093 0.311308 3 37.73164 76.56029 0.312581 4 45.66143 82.56839 0.266126 5 49.49076 87.46764 0.240535 6 40.63648 78.92834 0.29114 7 41.79862 79.68451 0.285362 8 41.53122 79.12217 0.284344 9 41.5517 78.18727 0.28707 10 42.49034 80.76235 0.279102
Table 6: A set of 10 out of 21 process output values derived
from simulating the backward neural network
Sl. No.
Excess Air (%)
Flame Temperat
ure (°C)
Rotation al Speed (RPM)
Preheat Air Temperatu
re (°C)
1 10.81231 2316.271 1.700759 501.5558 2 13.40073 2157.538 1.112948 245.0214 3 18.01376 2152.952 0.916743 335.4146 4 32.36798 1793.585 2.580477 393.4819 5 27.13644 1809.746 2.320451 230.0821 6 39.57747 1977.138 1.2892 363.6835 7 39.57747 1977.138 1.2892 363.6835 8 39.40025 2002.339 1.138356 430.0755 9 39.40025 2002.339 1.138356 430.0755 10 37.0712 1886.425 1.531582 339.335
Table 7: A set of 10 out of 21 percentage error in Process
output values derived from simulating the forward neural network
Sl. No.
Melting Time (Minutes)
Fuel Consumed
(Liters)
Experimental Values of Melting Rate (MT/Hr.)
1 -0.01308 0.000274 0.030693 2 0.006784 -0.01962 0.011861 3 0.007112 0.018805 0.00774
4 -0.01449 0.02945 -0.00047
5 0.01029 0.006086 -0.00222
6 0.033554 0.013578 -0.02109 7 0.006921 -0.00876 0.000818 8 -0.01279 -0.00154 0.026924 9 -0.01328 0.010395 0.017172 10 0.035529 0.015325 -0.02545
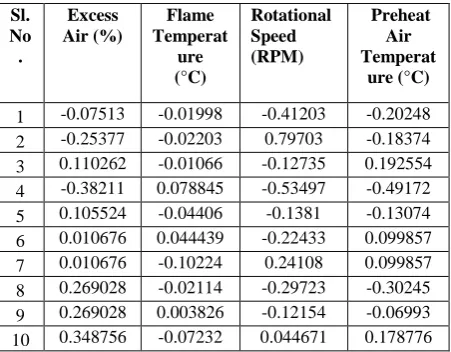
Table 8: A set of 10 out of 21 percentage error in Process
output values derived from simulating the backward neural network
Sl. No .
Excess Air (%)
Flame Temperat
ure (°C)
Rotational Speed (RPM)
Preheat Air Temperat
ure (°C)
1 -0.07513 -0.01998 -0.41203 -0.20248 2 -0.25377 -0.02203 0.79703 -0.18374 3 0.110262 -0.01066 -0.12735 0.192554 4 -0.38211 0.078845 -0.53497 -0.49172 5 0.105524 -0.04406 -0.1381 -0.13074 6 0.010676 0.044439 -0.22433 0.099857 7 0.010676 -0.10224 0.24108 0.099857 8 0.269028 -0.02114 -0.29723 -0.30245 9 0.269028 0.003826 -0.12154 -0.06993 10 0.348756 -0.07232 0.044671 0.178776
7.
RESULTS AND DISCUSSION
Artificial neural network modeling is a tool which helps in knowing about the system and how it will behave in real world. In this paper two NN models for rotary furnace were developed (Feed-forward neural network model and backward neural network model) which would be helpful for the decision maker for optimum functioning of rotary furnace.
The values used for the mapping of feed-forward neural network model are shown in table 4. The simulated results of feed-forward neural network model and its percentage error with experimental process output values are shown in table 5 & table 7 respectively.
[image:5.595.317.543.311.487.2] [image:5.595.54.275.350.517.2]be fed to rotary furnace as shown in table 6, the percentage error of output process values predicted from simulation of backward mapping are shown in table 8, the ANN model calculates the new process input vector by simulation. The decision maker is satisfied with the new input vector and the values are used in rotary furnace setup.
The ANN models used in this paper can investigate and simulate any number of output parameter at one run, this help the decision maker to have various input-output sets available with him for optimum functioning of the rotary furnace.
A comparison of error of 21 output sets obtained each from forward and backward ANN model is shown in figure 5 and figure 7. The polynomial trend curve shown in figure 6 and figure 8 shows the error between actual experimental output results and simulated results obtained from forward and backward NN models. The maximum positive, negative and mean error percentage calculated each from feed-forward and backward NN is shown in table 9 and table 10. As our model of feed-forward and backward NN can work in practical scenario of industry by predicting the output process parameter in any number (which in our case is 21), this also help the decision maker to know the impact of input parameter on output of furnace before actually running it. The backward NN model is a step forward by helping the decision maker to have input available to him for a specific set of output requirement as needed by him.
Error for Forward ANN (% )
-0.04 -0.02 0 0.02 0.04 0.06 0.08 0.1
Experiment no.
E
rr
o
r
in
%
Melting Time (Minutes) Fuel Consumed (Liters) Melting Rate (MT/Hr.)
Figure 5: Error for forward ANN (%)
Table 9: Errors in forward ANN model
Melting Time (Minutes)
Fuel Consume d (Liters)
Experimental Values of Melting
Rate (MT/Hr.) maximum
+ve error 0.0386 0.0294 0.0873
mean error -0.0004 0.0042 0.0110
maximum -ve
error -0.0343 -0.0284 -0.0254
Polynomial trend line for Forward ANN (% )
-0.02 -0.01 0 0.01 0.02 0.03 0.04
Experiment no.
P
o
ly
n
o
m
ia
l
E
rr
o
r
in
%
[image:6.595.316.542.74.198.2]Poly. (Melting Time (Minutes)) Poly. (Fuel Consumed (Liters)) Poly. (Melting Rate (MT/Hr.))
Figure 6: Polynomial trend line for Forward ANN (%)
Error for Backward ANN (%)
-0.6 -0.4 -0.2 0 0.2 0.4 0.6 0.8
Experiment no.
E
rr
o
r
in
%
Excess Air (%) Flame Temperature (°C)
[image:6.595.314.544.235.393.2]Rotational Speed (RPM) Preheat Air Temperature (°C)
[image:6.595.55.280.413.562.2]Figure 7: Error for backward ANN (%)
Table 10: Errors in backward ANN model
Polynomial trend line for Backward ANN (% )
-0.2 -0.1 0 0.1 0.2 0.3 0.4
Experiment no.
P
o
ly
n
o
m
ia
l
E
rr
o
r
in
%
Poly. (Excess Air (%)) Poly. (Flame Temperature (°C)) Poly. (Rotational Speed (RPM)) Poly. ( Preheat Air Temperature (°C) )
Figure 8: Polynomial trend line for backward ANN (%)
Excess Air (%)
Flame Temperatu
re (°C)
Rotational Speed (RPM)
Preheat Air Temperatur
e (°C)
maximum
+ve error 0.3487 0.0788 0.7970 0.1925 mean error 0.0002 -0.0097 -0.0634 -0.0902
maximum
[image:6.595.312.541.441.706.2]8.
CONCLUSION
The proposed approach of using Artificial Neural Networks as an optimization tool solves a very challenging problem of selecting the optimal process output of melting rate for the production of homogenous high quality castings. The forward ANN gives a maximum error of 0.087314 which is quite admissible and accepted by decision maker, the polynomial curve gives an error of maximum .035 and is quite satisfactory. Although for the backward ANN model has a problem that it has only 3 input and 4 output which is quite difficult to implement in a model, but our model gives satisfactory result with a maximum error of 0.79703 and the polynomial curve has an maximum error of .037 which is accepted by decision maker as it is the maximum error among 21 output sets. The decision maker can directly interact with the networks and identify desired process inputs and corresponding process outputs and vice versa through forward and reversed mapping networks. The optimum result obtained is almost instantaneous that guides the decision maker to select best rotary furnace parameters. Although the adopted approach is used for optimizing rotary furnace parameters in this work, it can be applied to other metal cutting or removing operations with the same accuracy [6,7].
9.
REFERENCES
[1] Davis F. and Decrop M., (1958). “Influence of blast input, coke size, and melting coke ratios on cupola performance”, Foundry Trade Journal, pp. 319-325. [2] Fausett L., (1994). “Fundamentals of Neural Networks”,
Prentice Hall, Eaglewood Cliffs, NJ.
[3] Hans Raj K., Sharma R. S., Srivastava S., Patvardhan C., (2000). “Modeling of Manufacturing processes with ANN for intelligent manufacturing”, International Journal of Machine tools & Manufacture, Vol. 40, pp. 851-868.
[4] Karunakar, D. B., Datta, G. L., (2002). “Modeling of cupola furnace parameters using Artificial Neural Networks”, Indian Foundry Journal, Vol. 48, pp. 29-39. [5] Levi W. W., (1947). “Variables affecting carbon control
in cupola operation”, Transactions of APS, Vol.55, pp. 626-632.
[6] Malakooti, B., (1991) “An interactive online multi-objective optimization approach for metal cutting turning operation,” International Journal of Production Research, 29(3), pp 575- 579.
[7] Malakooti, B. and Raman, V., (2000), “An interactive multi-objective artificial neural network approach for machine setup optimization”, Journal of Intelligent Manufacturing, Vol. 11, pp. 41-50.
[8] More, J. J., (1977). “The Levenberg - Maquardt Algorithm: Implementation and theory, Numerical Analysis”, G. A. Watson (Ed.), Lecture Notes in Mathematics, Springer Verlag, Vol. 630, pp.105-116. [9] Pehle R. D., (1963). “Thermo-chemical model of
computer prediction of cupola performance”, AFS Transactions, Vol. 71, pp. 580-587.
[10]Singh Ranjit, et. al. (2000). “Effect of Air- Preheating and Excess Air on the Performance of LDO Fired Rotary Furnace” Indian Foundry Journal, Vol. 46, No. 11, pp. 26-32.