© 2018, IRJET | Impact Factor value: 6.171 | ISO 9001:2008 Certified Journal | Page 1253
Traffic Signal Design and Performance Assessment of 4-Leg
Intersections Using Webster’s Model: A Case of ‘SRS’ and ‘B-Division’
Intersections in Makurdi Town
Paul Terkumbur Adeke*
1, Aondoseer Abraham Atoo
2and Aper E. Zava
31,2,3 Department of Civil Engineering, College of Engineering, University of Agriculture Makurdi,
P.M.B. 2373, Benue State, Nigeria.
---***---ABSTRACT
A fixed-timed signal-controlled traffic system for 4-leg at-grade intersection was designed for two candidate intersections namely the ‘SRS’ and ‘B-Division’ intersections in Makurdi town using Webster’s traffic signal design models, and performances assessed. Geometric layouts of the intersections were measured and manual traffic count carried out to obtain average travel demand (pcu/h) for base year (2017) and projected year (2027) using traffic growth rate of 3%. Design of 4-phased traffic control system for both intersections revealed failed performance for the base year. Though increasing number of lanes from 1 to 2 on major approaches of the SRS junction as permitted by its right-of-way improved its performance slightly from Level of Service (LOS) E to D. Performance of the B-Division junction at base year failed with degree of saturation ratio of unity. Since right-of-way and land-use features at the B-Division intersection do not permit increasing its number of lanes, the redesign and construction of roundabout, grade separated or continuous flow intersection as suggested by other researchers for failed cross-intersection were recommended for improved performance of the intersections. Also, implementation of annotated pavement markings to guide motorist for improve lane discipline as well as stringent enforcement policies to check on-street parking around intersections for improve lane capacity were recommended for efficient operations of cross-intersections.
KEYWORDS: Signal-controlled traffic system, Webster’s Models, degree of saturation, phase cycle length, Level of Service (LOS).
1.0 INTRODUCTION
As human population grows rapidly in urban areas, vehicular traffic volume has also increased proportionally following increased mobility and the geometric increase in the rate of automobile ownership. This accounts for the intense traffic
congestion that is associated with urban areas which affects their livability in terms of congestion, pollution, high travel cost, delay, etc. [1]. Traffic congestions are usually caused by excessive delays at intersections in most cases [2,3]. Because the capacity of an intersection is usually lower than that of other sections of the street, bottleneck effects are bound to be experienced at intersections. Where an intersection cannot efficiently discharge demanding traffic entering into it, there is bound to be congestion. The inability of road intersections to efficiently discharge approaching traffic creates many negative effects on mobility and the environment, including excessive delay with associated increase in travel time; increased air pollutant emissions and high level of noise pollution due to vehicles slowing, idling and acceleration; increased energy consumption and increased vehicle wear and tear caused by stop-and-go movement of traffic; increased rate of accidents, and reduced capacity of the network [4,5,6,7].
© 2018, IRJET | Impact Factor value: 6.171 | ISO 9001:2008 Certified Journal | Page 1254 means of traffic control at road intersections [3,5,10,
11,12].
Makurdi is the capital city of Benue State in middle belt Nigeria. Like every other city, the road network in Makurdi town is punctuated by different types of intersections. These intersections are not signalised. The only existing method of control is the use of traffic wardens mostly during peak periods. This method of control is outdated and not effective as queues are experienced at some of the intersections especially during peak periods. These queues are increasingly getting longer as the volume of traffic in the town is growing very rapidly. Besides, Traffic wardens are not usually available to control traffic during periods of inclement weather.
There has been palpable lack of interest and political will from the city’s public authorities to develop and install traffic signals at busy road intersections to replace traffic wardens for safe and efficient traffic control at intersections; this is so in spite of the numerous limitations associated with traffic wardens. However, as the traffic situation continues to cry out for attention, there is the likelihood that subsequent regimes may accord the much needed attention to traffic control in the town that will finally see the replacement of traffic wardens with traffic signals at intersections, hence the need for this study. The aim of this study was to design a fixed-timed traffic signal for 4-leg, two-way signal-controlled intersections. The intersections considered are namely the ‘SRS’ and ‘B-Division’ junctions in Makurdi town using Webster’s model. Specific objectives of the study were; to access traffic demand at the two candidate intersections; to design a fixed-timed traffic signal control system for the intersections and to assess performance of the designed system over time.
2.0 WEBSTER’S METHOD OF TRAFFIC SIGNAL DESIGN
Various kinds of techniques and computer tools have been developed to help traffic engineers find the optimum traffic signal timing and to predict the performance of signalised intersections in terms of delays and queue lengths. One of such techniques is the Webster’s method. Webster proposed an equation for the calculation of optimum cycle length that seeks to
minimize vehicle delay. Other researchers established that this model tends to fail whenever saturation flow ratio is approximately unity. That is when demand is approximately equal to lane capacity [12].
The Webster’s method of traffic signal design requires estimation of traffic demand (q) on all approaches of the intersection for all movements (straight, left and right turning movements) and the saturation flows (s) of the approaches. Saturation flows are estimated based on lane width, with flow ratio defined as the ratio of traffic demand flow rate to saturation flow rate of individual lane groups [13,14]. These parameters are used to estimate signal cycle length, which is the time required for complete signal sequence. The cycle length includes the green time plus lost times on all phases.
Traffic signals have the effect of causing delay as users on approaches without the right-of-way have to wait for the green signal [2,15]. According to [16] and [17], prolonged delays at signalised intersection encourage red light running as drivers become frustrated. Thus estimation of delays and queue lengths that will result from the adoption of a signal control strategy is sacrosanct and constitutes an essential part of traffic signal design. Delay is relevant to transport management agencies for policy and decision making process [18], since it is the additional travel time experienced by drivers, passenger or pedestrians aside from the actual travel time. It is an essential parameter for assessing intersection performance and network efficiency [3,19,20].
© 2018, IRJET | Impact Factor value: 6.171 | ISO 9001:2008 Certified Journal | Page 1255 respectively; they have been also adopted by other
countries. Other tools include modelling and simulation software such as VISSIM, SIDRA INTERSECTION, TRANSYT, LINSIG, CORSIN, HCM (TRB-2000), etc. [13,14,18,21].
3.0 MATERIAL AND METHODS
3.1 Description of Study Area
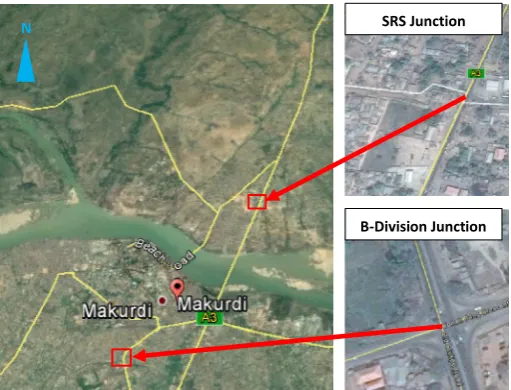
[image:3.595.37.293.505.700.2]Two existing at-grade 4-leg un-signalised road intersections in Makurdi town, Benue state of Nigeria were considered for this study. The intersections are namely the SRS Junction on the Northern side of River Benue and the B-Division Junction on the Southern side of River Benue in Makurdi town. The SRS junction connects a major highway called Makurdi - Jos Road, which runs from north to south and two other highways; one of which leads to the University of Agriculture Makurdi on the eastern direction, and the other serves residential areas in the western direction of the intersection. The B-Division junction connects two major streets that run perpendicular to each other. One of the streets is named Old Otukpo Road, it is a dual-carriageway running from North to south. The second street is named Ishaya Bakut Way, which runs from east to west. Figure 1 is a screenshot of Google map showing Makurdi town and locations of the candidate intersections.
Fig.-1: Screenshot of Google Map showing the SRS and B-Division Junctions in Makurdi town.
It has been observed over the years that these intersections experience high traffic demand on daily
basis, with delays and crashes becoming prolonged and increasingly frequent.
3.2. Data Collection
Traffic count was carried out at each of the candidate intersections from 6:00 am to 6:00 pm for seven (7) days. Traffic enumerators carried out daily counts manually at intervals of 15 minutes. Parameters measured at both intersections included; vehicular traffic flow rate (pcu/h) for all movements (through, left and right); geometric characteristics such as number and width of lanes, and vehicles approaching speeds using speed gun. The field work measured parameters for the base year (2017) which were used to project traffic demand on the intersections for design life of ten years (2027) using 3% annual traffic growth rate. Saturation flow rates per hour on each approach were also computed using standard lanes saturation flow rate values proposed by [13].
3.3 Signal Timing Design Procedure
The input parameters for the signal timing design included the peak 15 minute demand flow rate and the saturation flow rate on all approaches; these were obtained from analysis of the intersection traffic count data and geometric characteristics. The design process involved computation of flow ratios (defined as the ratio of demand flow rate to saturation flow rate), phase design, determination of change and clearance interval, cycle length and green time for each phase.
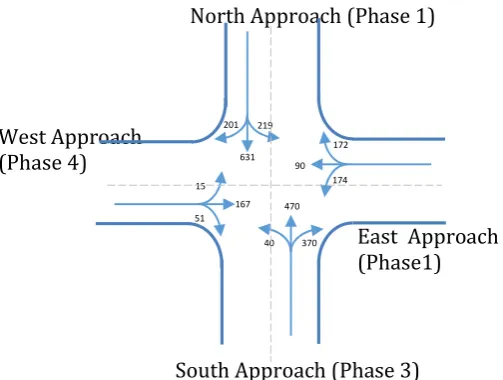
3.3.1 Signal Phasing Plan
A 4-phase signal-control plan was developed for both intersections. The movements of each approach were assigned right-of-way followed by movements of other opposing approach in a given sequence using 4-stages. Every phase controlled both a through and left-turn movement. This phase plan was adopted because through traffic and turning traffic both shared the same lane in most cases. An example of traffic movement configuration or signal phasing plan of a 4-leg intersection is depicted by the phasing and flow diagram shown in Fig. 2.
B-Division Junction
© 2018, IRJET | Impact Factor value: 6.171 | ISO 9001:2008 Certified Journal | Page 1256
Stage 1 Stage 2 Stage 3 Stage 4
Fig.- 2: Signal phasing and Flow Directions
Traffic flow in phases 1, 2, 3, and 4 where assigned right-of-way to movements in 4 stages as shown in Figure 2 to describe the North, East, South and West approaches respectively. in this study, right turning movements were ignored since they do not cause significant conflict to traffic flow. It was assumed that the green time for straight and left turning movements was sufficient to cater for the right turns [4,6].
3.3.2 Cycle Length Estimation
The optimum cycle length (Co) was calculated using the Webster model presented as Eq. (1);
Co =
(1)where, L is the total lost time per cycle (sec), is the sum of flow ratios of individual lanes. In other words,
equal to where yi, is the flow ratio of individual
approaches denoted as i.
3.3.3 Estimation of Total Lost Time per Cycle The time during which an intersection is not used effectively by any movement comprises the start-up lost time and the clearance lost time, which sum to represent total times experienced when a movement is started and stopped. In this project, 4 seconds time was applied per phase to account for the total lost times (2 seconds for start-up lost time and 2 seconds for clearance lost time) based on recommendations of [20]. The total lost time per cycle (L) was calculated using Eq. (2);
(2)
where, N is number of phases, and represent start-up and clearance lost times per phase respectively.
3.3.4 Green Time Estimation
The total lost time per cycle was subtracted from the total estimated cycle time to obtain total green time. The flow ratios were used to estimate the proportion of the total green time to be allocated to each phase. The effective green time (gi) for each phase was calculated using Eq. (3);
gi =
Gt
(3)where, is the flow ratio of the ith lane or approach, Gt is the total green time for the cycle. The actual green time was calculated as the sum of the effective green and total lost times less the amber time.
3.3.5 Estimation of Vehicle Control Delay
The model for estimating average vehicle control delay on queue for a given approach of a signalised intersection is as stated in Eq. (4):
(4)
where, d is vehicle control delay (s/veh), C is the design
cycle time of the intersection (s), is effective green time for a phase divided by the cycle length, x is the degree of saturation, s is saturation flow rate (veh/s) and q is the demand flow rate (veh/s). The first, second and third terms of the delay model represent average delay to vehicles assuming uniform arrival, delay due to randomness of vehicle arrivals and probability of delay surges in vehicle arrivals caused by temporary over-saturation of the approach respectively.
3.3.6 Queue Length
Queue length is another performance measure that is used together with delay to determine the intersection Level of Service (LOS). The expression used for estimating queue length Q per approach is as shown in Eq. (5):
(5)
© 2018, IRJET | Impact Factor value: 6.171 | ISO 9001:2008 Certified Journal | Page 1257 engineers always try to minimize so as to improve the
LOS of intersections [21].
4.0 INTERSECTION PERFORMANCE ANALYSIS PROCEDURE
The volume-capacity ratio, delay and queue length were used to determine the level of service at which the intersections performed under signalised conditions. A LOS was determined for every approach following the criteria provided in [19] for each LOS. These criteria are given in terms of average control delay per vehicle and the average queue length which were used to determine the LOS of the intersections for both base and projected years ahead.
5.0 ANALYSIS AND DISCUSSION OF RESULTS 5.1.1 The SRS Junction
Figure 3 presents the layout of SRS Junction and average traffic flow rates measured in passenger car unit per hour (pcu/h) on all approaches for the base year (2017).
North Approach (Phase 1)
West Approach (Phase 4)
East Approach (Phase1)
South Approach (Phase 3)
Fig.-3: Layout and Traffic flow rate (pcu/h) on the SRS Junction
For every approach, the sum of left-turning and through movement traffic flow rates were obtain as the actual effective travel demand volume for the base year. Traffic flow rate for the base year was projected using 3% growth rate to obtain effective travel demand volume for the design year (2027) as presented in Table 1. Also, standard saturation flow rates of
[image:5.595.307.560.150.326.2]approaching lanes obtained from standard table proposed by Webster is as shown in Table 1.
Table - 1: Characteristics of the SRS Junction
Description Phases
1 2 3 4
Lane width (m) 3.8 3.3 3.8 3.2
Number of lanes 1 1 1 1
Present traffic flow rate (pcu/h)
850 264 510 182
Predicted traffic flow rate (pcu/h)
1142 355 685 245
Saturation Flow rate per lane (pcu/h)
1926 1874 1926 1866
Present flow ratio (yi)
0.2966 0.189 0.178 0.131
Predicted flow ratio (yj)
0.3542 0.190 0.590 0.190
Summation flow ratios for every approaching lane for base year (yi) and design year (yj) are 0.9445 and
1.2694 respectively. The magnitude of these parameters is significantly high and equal to unity approximately. This shows that the intersection operates at full capacity or has insufficient capacity to accommodate travel demand volume. According to the Highways Agency reports (2003), when the sum of flow ratios ( ) for an intersection is greater than 0.8, it indicates that the intersection has potential capacity problems since traffic systems do not operate at 100% of their theoretical maximum capacity in practice.
Based on its present geometric features and travel demand volume, it was concluded that performance of the SRS Junction is very poor since it does not have sufficient capacity to handle its vehicular traffic demand in the base year. This therefore called for redesign of the intersection. The geometric configuration of the junction was re-designed with the number of northbound and southbound lanes increased from one to two on the approaches as permitted by the right-of-way and land-use features surrounding the site. Modified characteristics of the SRS junction for improved performance are as shown in Table 2. The new flow ratios of the intersection summed to 0.6448 and 0.8041 in the base and design years respectively. This indicates relatively improved
201 219
631
51 15
167
174 90
172
370 470
[image:5.595.37.289.412.602.2]© 2018, IRJET | Impact Factor value: 6.171 | ISO 9001:2008 Certified Journal | Page 1258 performance within design life cycle of the redesigned
intersection.
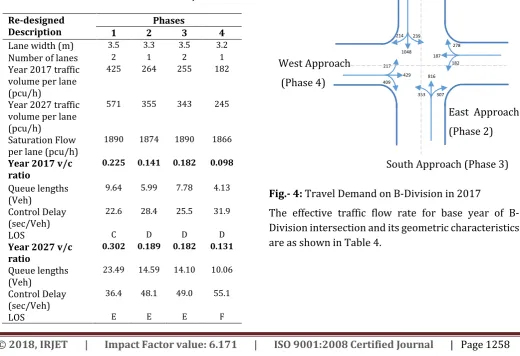
5.1.2 Signal Timing Design
Input parameters used for signal timing design included; Amber time of 3 seconds, start-up lost time of 2 seconds, all-red time of 2 second such that total lost time per phase was 4 seconds. This gave total lost time of the cycle as 16 seconds. Using Webster’s model, the optimum cycle length was obtained as 82 seconds for base year and 149 seconds for the design year. The lost time per cycle was subtracted from the total cycle time to obtain the total green time of 66 seconds and 133 seconds in the base year and design year respectively.
[image:6.595.310.557.161.331.2]Performance parameters of the SRS junction under signalised condition in terms of queue lengths on lanes, control delays and LOS indicated that the north approach performed relatively better than other approach lanes with LOS C for the base year. Performance of the redesigned intersection dose not experience significant improvement. Allocation of green time to each phase is as shown in Table 2.
Table- 2: Characteristics of Modified SRS Junction
Re-designed Description
Phases
1 2 3 4
Lane width (m) 3.5 3.3 3.5 3.2
Number of lanes 2 1 2 1
Year 2017 traffic volume per lane (pcu/h)
425 264 255 182
Year 2027 traffic volume per lane (pcu/h)
571 355 343 245
Saturation Flow per lane (pcu/h)
1890 1874 1890 1866
Year 2017 v/c ratio
0.225 0.141 0.182 0.098
Queue lengths (Veh)
9.64 5.99 7.78 4.13
Control Delay (sec/Veh)
22.6 28.4 25.5 31.9
LOS C D D D
Year 2027 v/c ratio
0.302 0.189 0.182 0.131
Queue lengths (Veh)
23.49 14.59 14.10 10.06
Control Delay (sec/Veh)
36.4 48.1 49.0 55.1
[image:6.595.316.556.411.594.2]LOS E E E F
[image:6.595.39.560.442.798.2]Table 3 shows the performance characteristics of SRS junction.
Table - 3: Signal Timing for redesigned SRS Junction
Description
Phases
1 2 3 4
Base year 2017
Actual Green time per
phase (sec) 22 14 18 10
Effective Green time per
phase (sec) 21 13 17 9
Projected year 2027 Actual Green time per phase (sec)
50 31 30 22
Effective Green time per phase (sec)
49 30 29 21
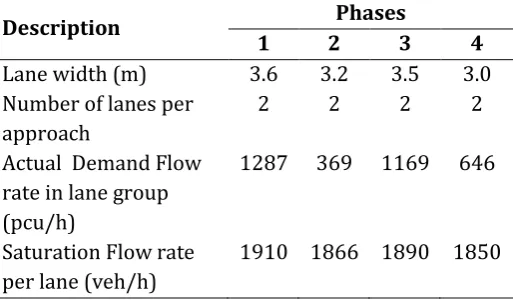
4.2.1 The B-Division Junction
The layout and traffic flow rate (pcu/h) at the B-Division Junction for the base year (2017) is as shown in Fig. 4.
North Approach (Phase 1)
West Approach
(Phase 4)
East Approach
(Phase 2)
South Approach (Phase 3)
Fig.- 4: Travel Demand on B-Division in 2017
The effective traffic flow rate for base year of B-Division intersection and its geometric characteristics are as shown in Table 4.
214 239
1048
409 217
429
182 187
278
307 816
[image:6.595.45.299.454.787.2]© 2018, IRJET | Impact Factor value: 6.171 | ISO 9001:2008 Certified Journal | Page 1259 Table- 4: Characteristics of the B-Division Junction
Description Phases
1 2 3 4
Lane width (m) 3.6 3.2 3.5 3.0
Number of lanes per approach
2 2 2 2
Actual Demand Flow rate in lane group (pcu/h)
1287 369 1169 646
Saturation Flow rate per lane (veh/h)
1910 1866 1890 1850
Table 4 shows the flow ratios of each approach lane. Summation of saturation flow rates for all signal phases at the intersection was 0.9196. This indicates grossly insufficient capacity for travel demand at the B-Division junction for the base year, since the value is greater than 0.8 (with reserve capacity of approximately 8% only which indicates significant capacity problem). This poor performance of the junction at its base year as examined in this study was attributed to high travel demand. The present geometrical configuration of the intersection in its base year discouraged projection and redesign for future year, since all existing approaches had 2 existing lanes each and, land-use features and right-of-way policies do not permit expansion of the roadway to create more lanes that could increase capacity. According to findings of previous researches, conversion of the existing B-Division intersection into modern roundabout with or without signalization, or construction of a continuous flow intersection are suitable methodologies for solving challenges associated with B-Division intersection for improved performance.
6.0 CONCLUSION AND RECOMMENDATIONS
6.1 Conclusion
The design of fixed-timed, 4-phase traffic signal control system at two 4-leg intersections which included the SRS and B-Division intersection in Makurdi town was carried out using Webster’s signal design models. The design and performance assessment were based on base year (2017) and projected year (2027) travel demand on the intersections. Performance analysis of
the SRS junction using its present geometrical configuration showed very poor outputs. Redesign of the intersection by increasing number of lanes from one to two on the north- and south approaches showed improved performance for both the base and future years. On the other hand, performance analysis of the B-Division intersection showed that the intersection is operating at a failed state. This was attributed to high travel demand on the intersection and its geometric design and layout. It was therefore concluded that, though implementation of redesigned SRS junction could partially serve it design purpose for a life cycle of 10 years; on the other hand, performance of the B-Division intersection at present is very poor hence does not required projected study, but rather calls for adoption of other kind of intersection design since its surrounding land-use features and right-of-way policies do not permit further expansion of its approaching lanes for increased traffic capacity and reservations.
6.2 Recommendations
Based on findings of this study, the following recommendations were made;
i. If permissible, layout of intersections be redesigned by adding the number of approaching lanes or increase lane width to accommodate demand efficiently or convert intersections into roundabouts to increase capacity and guarantee safety, or conversion of cross intersections to continuous flow intersections for improved performance.
ii. Implementation of roadway expansion at approaches to achieve standard lane widths with annotated pavement markings to guide motorist and improve lane discipline for efficient use of the intersections.
iii. Traffic management agencies should take disciplinary actions against motorist who reduce lane width by on-street parking around the intersections so as to increase saturation flow and to claim spaces meant for reserve capacity. iv. The local government council should ensure the
© 2018, IRJET | Impact Factor value: 6.171 | ISO 9001:2008 Certified Journal | Page 1260 running which creates accidents and obstructs
free flow of traffic.
ACKNOWLEDGMENTS
We are grateful to Odagboyi Benjamin Edor and Attah Ernest Kizito for their immersed efforts in traffic data collection at the SRS and B-Division road intersections in Makurdi town.
REFERENCES
1. Sheehan, M.D. (2010). Congestion Pricing in Traffic Control, Transportation Issues, Policies and R&D Series. New York: Nova Science Publishers Inc. 2. Reddy, B.S. and Reddy, N.V.H. (2016). Signal Design
for T-intersection by using Webster’s Method in Nandyal Town, Kurnool District of Andhra Pradesh. International Research Journal of Engineering and Technology, 3(4), 1124 – 1131.
3. Findley, D.J.; Schroeder, B.J.; Cunningham, C.M. and Brown, T.H. (2016). Highway Engineering; Planning, Design, and Operations. The boulevard, Langford lane, Oxford, UK.
4. Al-Mudhaffar, A. (2006). Impacts of Traffic Signal Control Strategies, Doctoral Thesis in Traffic and Transport Planning, Infrastructure and Planning, Royal Institute of Technology, Stockholm, Sweden. 5. Jimoh, Y.A.; Adeleke, O.O. and Afolabi, A.A. (2012).
An Evaluation of the operation of a Fixed –Time Signalization Scheme for a Four Leg Intersection in Ilorin Metropolis, Nigeria. Research Journal of Applied Sciences, Engineering and Technology, 4 (17), 2839 – 2845
6. Xi, J.; Wang, S. and Wang, C. (2015). An Approach to an intersection traffic delay study based on shift-share analysis. Journal of Information, Multidisciplinary Digital Publishing Institute, 6, 246 – 257.
7. Wu, N. and Giuliani, S. (2016). Capacity and Delay Estimation at Signalised intersections under unsaturated Flow conditions based on cycle overflow probability. International Symposium on enhancing highway Performance, Transportation Research Procedia, 15, 63 – 74.
8. Garber and Hoel (2009). Traffic and highway Engineering, 4th Edition, Cengage Learning, Canada.
9. Federal Republic of Nigeria – Ministry of Works, Housing and Transportation (2013). Highway Design Manual, Nigeria.
10.Akcelik, R. (1996). Signalised and Unsignalised Intersection Design & Research Aid (SIDRA). Transport Research Ltd, ARRB, Australia.
11.Akcelik, R. and Rouphail, N. (1994). Overflow Queues and Delays with Random and Platoon Arrivals at Signalised Intersections. Journal of Advanced Transportation, 28 (3), 227-251. 12.Zakariya, A. and Rabia, S. (2016). Estimating the
minimum delay optimal cycle length based on a time-dependent delay formula. Alexandria Engineering Journal, Elsevier, Article in Press. 13.Webster, F.V. (1958). Traffic Signal Setting.
Department of Scientific and industrial Research, Road Research Technical Paper No. 39. London, England.
14.Webster, F.V. and Cobbe, B.M. (1966). Traffic Signals. Road Research Laboratory, Road Research Technical Paper No. 56, London, UK.
15.MUTCD (2007). Manual on Uniform Traffic Devices for Streets and Highways, 2007 Edition. United States Department of Transportation, Federal Highway Administration, Washington D.C.
16.Johnson, M.; Charlton, J.; Oxley, J. and Newstead, S. (2013). Why do cyclist infringe at red lights? An investigation of Australian Cyclists’ reasons for red light infringement. Accident Analysis and Prevention, 50, 840 – 847.
17.Yang, C.Y.D and Najm, W.G. (2007). Examining Driver Behaviour using Data gathered from Red light Photo Enforcement Cameras. Journal of Safety Research, 38 (3), 311 – 321.
18.Preethi, P.; Varghese, A. and Ashalatha, R. (2016). Modelling Delay at Signalised Intersections under Heterogeneous Traffic Conditions, 11th Transport Planning and Implementation Methodologies for Developing Countries (TPMDC) 2014, Mumbai, India, Transport Research Procedia, 17, 529-538. 19.Highway Capacity Manual (HCM) (2000).
Transportation Research Board, Washington DC: National Research Council.
20.Bang, K.; Wahlstedt, J and Linse, L. (2016). Methodology for Timing and Impact Analysis of Signalised Intersections. International Symposium on Enhancing Highway Performance. Transport Research Procedia, 15, 75 – 86.