Cluster based Outlier Detection
Pranjali Kasture
Assistant ProfessorThakur College of Engineering and Technology, Kandiwali (E),
Mumbai, India
Jayant Gadge
Assistant Professor Thadomal Shahali College of Engineering, Bandra (W), Mumbai, IndiaABSTRACT
Outlier detection is a fundamental issue in data mining, specifically it has been used to detect and remove anomalous objects from data.mining. The proposed approach to detect outlier includes three methods which are clustering, pruning and computing outlier score. For clustering k-means algorithm is used which partition the dataset into given number of clusters. In pruning, based on some distance measure, points which are closed to centroid of each cluster are pruned. For the unpruned points, local distance based outlier factor (LDOF) measure is calculated. A measure called LDOF, tells how much a point is deviating from its neighbors. The high LDOF value of a point indicates that the point is deviating more from its neighbors and probably it may be an outlier.
General Terms
Outlier, cluster, pruning, outlier score, k nearest neighbor
Keywords
KNN, LDOF
1.
INTRODUCTION
Finding anomalous points among the data points is the basic idea to find out an outlier. Outlier detection signals out the objects mostly deviating from a given data set. Detecting outliers which are inconsistent with the remaining dataset is a major challenge in real-world KDD applications. Existing outlier detection methods are ineffective on scattered real-world datasets due to implicit data patterns and parameter setting issues. Several measures are used to find out the deviation of a point from other points which tells the outlierness of a point. Since the number of outliers in a data set is very few, it is unnecessary to calculate these measures for all points. The purpose of outlier detection based on clustering [1] is to reduce computation time by removing the points which are probably not outliers.
The outlier detection problem in some cases is similar to the classification problem. For example, the main concern of clustering-based outlier detection algorithms is to find clusters and outliers, which are often regarded as noise that should be removed in order to make more reliable clustering. Some noisy points may be far away from the data points, whereas the others may be close. The far away noisy points would affect the result more significantly because they are more different from the data points. It is desirable to identify and remove the outliers, which are far away from all the other points in cluster.
The identification of an outlier is affected by various factors, many of which are of interest for practical applications. For example, fraud, or criminal deception, will always be a costly problem for many profit organizations. Data mining can minimize some of these losses by making use of the massive
collections of customer data. Using web log files becomes possible to recognize fraudulent behavior, changes in behavior of customers or faults in systems. Outliers arise by reasons of such incidents. Thus typical fault detection can discover exceptions in the amount of money spent, type of items purchased, time and location. Many fraud cases can happen, for example, if someone has your name, credit card number, expiration date and billing address. All this information is very easy to obtain even from your home mailbox or any on-line transaction that you had before. So, automatic systems for preventing fraudulent use of credit cards detect unusual transactions and may block such transactions on earlier stages. Another example is a computer security intrusion detection system, which finds outlier patterns as a possible intrusion attempts. Intrusion detection corresponds to a suite of techniques that are used to identify attacks against computers and network infrastructures. Outlier detection is a key element of intrusion detection in which perturbations of normal behavior suggest the presence of intentionally or unintentionally induced attacks, faults and defects. Detecting outliers has practical application in more wide spheres: pharmaceutical research, weather prediction, financial applications, marketing and customer segmentation
This paper is structured as follows. In section 2 an overview of related work of outlier detection is provided. In section 3, proposed work is introduced. Here all three phases of outlier detection algorithm is explained in detail. In section 4, an experimental result of medical diagnosis dataset is shown. Finally, paper is concluded in section 5.
2.
RELATED WORK
KeZhang ,M.Hutter and H.Jin [2] have proposed a novel Local Distance-based Outlier Factor (LDOF) method to measure the outlier-ness of objects in scattered datasets. LDOF uses the relative location of an object to its neighbors to determine the degree to which the object deviates from its neighborhood. In order to facilitate parameter settings in real-world applications, a top-n technique is employed in outlier detection approach, where only the objects with the highest LDOF values are regarded as outliers. Compared to conventional approaches (such as top-n KNN and top-n LOF), top-n LDOF method is more effective at detecting outliers in scattered data. It is also easier to set parameters, since its performance is relatively stable over a large range of parameter values.
statistically-oriented approach. The benefit of this model is that it provides for each data object an outlier probability as score that is easily interpretable and can be compared over the data set. In this, they formulate a local density based outlier detection method providing an outlier “score" in the range of [0; 1] that is directly interpretable as a probability of a data object for being an outlier.
Knorr and Ng [4] were the first to introduce distance based outlier detection techniques. An object p in a data set DS is a DB (q, dist)-outlier if at least fraction q of the objects in DS lie at a greater distance than dist from p. Subsequently, Angiulli and Pizzuti [5] proposed a method to determine the outliers by considering the whole neighborhood of the objects. All the points are ranked basing on the sum of the distances from the k-nearest neighbors, rather than considering solely the distance to the kth nearest neighbor.
Breuniget.al. [6] proposed a Local Outlier Factor (LOF) for each object in the data set, indicating its degree of outlierness. This is the first concept of an outlier which also quantifies how outlying an object is. The outlier factor is local in the sense that only a restricted neighborhood of each object is taken into account. Since the LOF value of an object is obtained by comparing its density with those in its neighborhood, it has stronger modeling capability than a distance based scheme, which is based only on the density of the object itself.
Clustering methods like DBSCAN [7], BIRCH [10] and CURE [8] may detect outliers. However, since the main objective of a clustering method is to find clusters, they are developed to optimize clustering, and not to optimize outlier detection. The definition of outlier used is subjective to the clusters that are detected by these algorithms. While definitions of distance-based outliers are more objective and independent of how clusters in the input data are identified. In distance-based approach, top-n Kth-Nearest Neighbor distance [9] is a typical top-n style outlier detection approach.. In top-n KNN outlier, the distance from an object to its Kth nearest neighbor (denoted as k-distance for short) indicates outlier-ness of the object. Intuitively, for larger k-distance, the object has higher outlier- ness. Top-n KNN outlier regards the n objects with the highest values of k-distance as outliers [9]. In density-based approach, a Local Outlier Factor (LOF) [6] was proposed. In LOF, an outlier factor is assigned for each object with respect to its surrounding neighborhood. The outlier factor depends on how the data object is closely packed in its locally reachable neighborhood. Since LOF uses a threshold to differentiate outliers from normal objects, the same problem of parameter setting arises. A lower outlier-ness threshold will produce high false-detection rate, while a high threshold value will result in missing genuine outliers. In recent real-world applications, researchers have found it more reliable to use LOF in a top-n manner i.e. only objects with the highest LOF values will be considered outliers.
3.
PROPOSED WORK
Many data-mining algorithms find outliers as a side- product of clustering algorithms. The main objective of a clustering method is to find clusters. They are developed to optimize clustering, and not to optimize outlier detection. In the proposed work both clustering method and outlier detection techniques is used to find outliers.
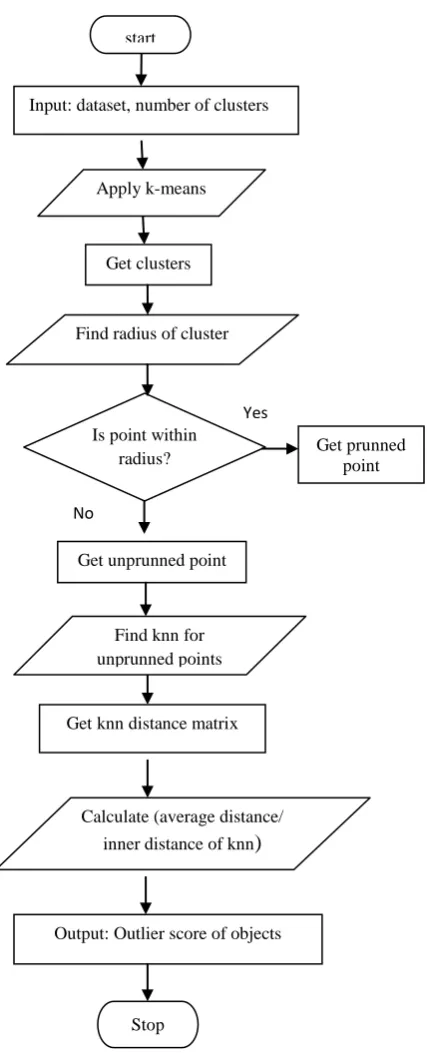
The proposed work to detect outlier is divided into three phases: partitioning dataset, radius based pruning and computing outlier score of objects. The flowchart of algorithm is shown in figure 1.This section, briefs about the phases of algorithm.
3.1
Partitioning Dataset
This is the first stage where the dataset is partition into number of clusters enter by the user. For clustering, k-means algorithm is used. It is one of the simplest unsupervised learning algorithms. The algorithm is given as below:
K-means Clustering Algorithm:
1. Initial centroid for clusters is chosen randomly. 2. Calculate the distance between cluster centroid to
each object using any distance function (e.g. Euclidean distance) to get the distance matrix. 3. Assign each object based on the minimum distance. 4. Compute new centroid of each group based on new
memberships.
5. Repeat step 2, 3, 4 until algorithm has reached its stability.
3.2
Radius based Pruning
K-means Clustering method divide the dataset into number of clusters. In the cluster, some points are very close to the centroid of cluster and some points are far away from the centroid of the cluster. The points which are very close to centroid, has to be removed because probability of having outlier is very less for those points.
Pruning step is used to remove the points which are very close to the centroid of the cluster. For this, radius of each cluster is found out [11]. Average distance from centroid to all objects in the cluster is taken as a measure to find the radius of the cluster. For a cluster having centroid m, Let Cm is the set of
objects consisting of k number of objects. The radius r is calculated using the formula given below.
After calculating the radius of cluster, points which are within the radius of cluster are found out and removed from the cluster. Since points are very close to the centroid, probability of being outlier is very less for those points. If number of points in clusters is less than the number of outliers then pruning should be avoided for such clusters.
Fig 1: Flowchart for outlier detection algorithm
3.3
Computing Outlier Score
In this, for each unpruned points, LDOF (Local Distance-based Outlier Factor) is calculated [2]. A measure called LDOF, tells how much a point is deviating from its neighbors. The high LDOF value of a point indicates that the point is deviating more from its neighbors and probably it may be an outlier.
For computing outlier score of object p, k number of nearest neighbor (knn) points for the object p is found out first. Then average distance from object p to all k nearest neighbors is calculated. Then average distance among the k nearest neighbors is also calculated. The ratio of these values gives outlier score for the object p. Highest score indicates that, the
object is the most probable candidate of outlier. LDOF factor is calculated as follows:
dp (KNN distance of p): Let Np be the set of k-nearest neighbors of object p (excluding p). The k-nearest neighbor distance of p equals the average distance from p to all objects in Np. More formally, let dist (p, q) ≥ 0 be a distance measure between objects p and q. The k-nearest neighbor distance of object p is defined as:
Dp (KNN inner distance of p): Given Np of object p, the k-nearest neighbors inner distance of p is defined as the average distance among objects in Np.
LDOF of p: The local distance-based outlier factor of p is defined as:
LDOF value for all objects is calculated using the formulas given above. All the values are arranged in decreasing order to get the highest values first. Highest value indicates that object is the most probable candidate of being an outlier. Then in Top N points, percentage of outliers detected is evaluated. The proposed work gives the outlier score of objects in dataset in top n fashion. Number of outliers in the dataset is very few in number. To find outlier score for all objects in dataset is computationally expensive. This can be avoided by doing pruning. Since outlier detection is based on clustering and pruning, complexity of algorithm reduces substantially.
4.
EXPERIMENTAL RESULT
In real-world data repositories, it is hard to find a data set for evaluating outlier detection algorithms, because only for very few real-world data sets it is exactly known which objects are really behaving differently. In this experiment, a medical data set of WDBC (Cancer Diagnosis) is used. The data set contains 569 medical diagnosis records (objects), each with32 attributes (ID, diagnosis, 30 real-valued input features).The diagnosis is binary: Benign and Malignant. The objects, labeled as Benign are considered as a normal data. In the experiment, all 357 Benign diagnosis records are used as a normal data and out of 212 Malignant diagnosis records, only ten records are used and considered as an outlier for the dataset.
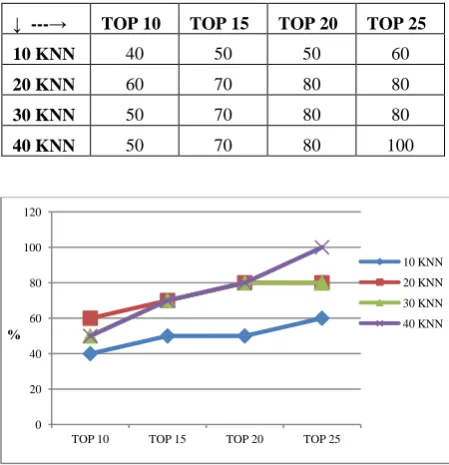
The algorithm is run for different number of clusters with knn value varying from 10 to 40. Number of clusters in should not be more than number of outliers. Here, number of clusters varies from 2 to 9. Finally, the percentage of outliers detected is calculated in Top N fashion with N varying from 10 to 25. Table 1 shows the percentage of outlier detected in WDBC dataset for cluster 4 in top 25 with knn value varying from 10 to 40.
Yes
No
Input: dataset, number of clusters
Find radius of cluster Get clusters Apply k-means
Is point within
radius? Get prunned point
Get unprunned point
Find knn for unprunned points
Get knn distance matrix
Calculate (average distance/ inner distance of knn
)
Output: Outlier score of objects start
Table 1. Percentage of outlier detected for WDBC dataset
↓ ---→ TOP 10 TOP 15 TOP 20 TOP 25
10 KNN 40 50 50 60
20 KNN 60 70 80 80
30 KNN 50 70 80 80
40 KNN 50 70 80 100
Fig 1: Percentage of outlier detected for WDBC data
[image:4.595.70.265.451.635.2]In Figure 1, it is observed that, percentage of outliers detected vary with top-n points and neighborhood size k. When neighborhood size is less then percentage of outlier detected is also less. As neighborhood size increases, the outlier score for objects also increases. As shown in the Figure 1, when neighborhood size 40 is considered, then in Top 25, all outliers are detected by the algorithm.
Table 2. Pruning percentage for WDBC data set
Sr.No.
Number of clusters
% of prunned
objects
% of outliers detected
1 2 59.95 70
2 3 55.86 90
3 4 53.13 100
4 5 51.77 100
5 6 50.95 100
6 7 52.59 100
7 8 53.68 100
8 9 55.31 100
In Table 2, for given number of clusters, percentage of data pruned is calculated. It is observed that, more than 50% of data is removed from the dataset. Thus the computation cost required in computing outlier score for all objects in a dataset is reduced using pruning technique.
Table 3 gives the comparative study of proposed method verses the existing method. In existing method, plain LDOF measure was used to compute the outlier score of each object in a dataset. In proposed work, dataset is filtered out using clustering and pruning methods. Computing outlier score for
all objects was computationally expensive in the existing method. Whereas, computation cost and complexity, both can be reduced by the proposed method.
Table 3. Comparative study of proposed method verses existing method
Points Existing Method Proposed Method
Approach Plain LDOF measure
Clustering and Pruning based LDOF measure Complexity O(N2) Less than O(N2) Computation
cost
Computationally
expensive Less expensive Data
Filtration
Dataset cannot be
filtered Dataset is filtered
5.
CONCLUSION
In this work, an efficient outlier detection method based on clustering is proposed. Numbers of outliers in a dataset are generally very few. Computing outlier score for all objects in dataset is computationally expensive. This can be avoided by pruning some of the points in the dataset which are not the probable candidate for outliers. In the proposed work, k means clustering method is used which partition the dataset into number of clusters. Then radius based pruning is done which removes 50% points in the dataset. Finally, to compute the outlier score of unprunned points, a Local Distance-based Outlier Factor measure is used. This measure uses the concept of k nearest neighbors. It is observed that, as the k nearest neighbor value increases, the outlier score of object also increases. Thus it becomes easier to detect outlier at top position and remain stable over large range of neighborhood sizes
.
6.
REFERENCES
[1] Rajendra Pamula, Jatindra Kumar Deka, Sukumar Nandi.Distance based Fast Outlier Detection Method. 2010, Annual IEEE, India Conference (INDICON). [2] K. Zhang, M. Hutter, and H. Jin. A new local distance-
based outlier detection approach for scattered real-world data. In PAKDD ’09: Proceedings of the 13th Pacific- Asia Conference on Advances in Knowledge Discovery and Data Mining, pages 813–822, 2009.
[3] Hans-Peter Kriegel, Peer Kröger, Erich Schubert, Arthur Zimek. LoOP: Local Outlier Probabilities. CIKM’09, November 2–6, 2009, Hong Kong, China. Copyright 2009 ACM pages 1649-1652, 2009
[4] E. M. Knorr and R. T. Ng. Algorithms for mining distance based outliers in large datasets. In Proc. 24th Int. Conf. Very Large Data Bases, VLDB, pages 392–403, 1998.
[5] F. Angiulli, S. Basta, and C. Pizzuti. Distance-based detection and prediction of outliers. IEEE Transactions on Knowledge and Data Engineering, 18:145–160, 2006.
0 20 40 60 80 100 120
TOP 10 TOP 15 TOP 20 TOP 25
%
[6] M. M. Breunig, H.-P. Kriegel, R. T. Ng, and J. Sander. Lof: identifying density-based local outliers. SIGMOD Rec., 29(2):93–104, 2000
[7] M. Ester, H.-P. Kriegel, and X. Xu. A database interface for clustering in large spatial databases. In Proceedings of 1st International Conference on Knowledge Discovery and Data Mining (KDD-95), 1995
[8] S. Guha, R. Rastogi, and K. Shim. CURE: An efficient clus tering algorithm for large databases. SIGMOD Rec., 27(2):73–84, 1998.Sannella, M. J. 1994 Constraint Satisfaction and Debugging for Interactive User Interfaces. Doctoral Thesis. UMI Order Number: UMI Order No. GAX95-09398., University of Washington.
[9] S. Ramaswamy, R. Rastogi, and K. Shim. Efficient algorithms for mining outliers from large data sets. pages 427–438, 2000
[10]T. Zhang, R. Ramakrishnan, and M. Livny. Birch: an efficient data clustering method for very large databases. SIGMOD Rec., 25(2):103–114, 1996.