Performance Evaluation and Analysis of Reactive
Routing Protocols in MANET
Neha Verma
C.E.T, I.F.T.M University Moradabad U.P 244001 India
Vijay Joshi
SCEA, I.F.T.M University Moradabad U.P 244001 India
Arun Kumar
IT Officer, PNB Moradabad U.P 244001 India
ABSTRACT
MANET is the collection of mobile devices which formed a self configuring infrastructure less temporary network. In this paper we are doing performance evaluation and analysis of three reactive routing protocols (DSR, AODV and TORA) in MANET for different performance metrics Such as Average Throughput, Packet Delivery ratio, Packet Drop Ratio, Average End-to-End Delay, Routing Overhead and Average Jitter with same simulation parameters for number of nodes variation and pause time variation, and find the best one routing protocol for communication in MANET. NS-2 simulator is used for implementation of these routing protocols.
Keywords
MANET, AODV, DSR, TORA
1.
INTRODUCTION
One of the most promising and discussed technology in the last decade is the wireless network technology which allows users to utilize devices that enable the access to information at any time any place. These needs make wireless networks the best solution for interconnecting devices and people. Wireless networks are comprised of devices that communicate through media such as radio signals and infra-red, and they are generally classified into two categories: Infrastructure-based and ad-hoc wireless networks. Infrastructure-based wireless network consists of base stations localized in convenient places, which provide wireless connectivity to devices within their coverage area. On the other hand, an ad hoc network is a collection of mobile nodes that form a temporary network itself. Each node in ad hoc network is responsible for routing or each node in ad-hoc networks work like as router. Although the majority of the wireless networks are infrastructure, ad-hoc networks have several important applications, especially when infrastructure network cannot setup easily. Some example uses can be listed as sensor networks, emergency response or military applications [1].
2.
MOBILE AD-HOC NETWORK
ROUTING PROTOCOLS
MANET is the type of wireless ad-hoc network consists of various mobile nodes which are connected by wireless links and forms a self organizing infrastructure less network. Each node in mobile ad-hoc network has limited wireless transmission range, so the routing in mobile ad-hoc networks is depends on the co-operative engagement of the mobile nodes [2]. MANET Routing protocols are basically two types. 2.1 Proactive (Table Driven)
2.2 Reactive (ON Demand)
2.1 Proactive Routing Protocol
Proactive routing protocols periodically discover and update
routes connecting every pair of nodes in the network. This allows nodes to communicate without delay, as available routes are generally known in advance. This advantage is counterbalanced by increased congestion, due to the flow of control packets needed to discover routes [3]. Some proactive routing protocols are Destination Sequenced Distance Vector (DSDV), Wireless Routing Protocol (WRP), Global State Routing (GSR) and Cluster head Gateway Switch Routing (CGSR).
2.2
Reactive Routing Protocol
Reactive Routing Protocol is the On-demand routing protocol. In this Protocol, we find the route information for the destination when needed. In this routing protocol we discover the route information when one node wants to communicate to the other node. Some reactive protocols are Cluster Based Routing Protocol (CBRP), Ad hoc On-Demand Distance Vector (AODV), Dynamic Source Routing (DSR), Temporally Ordered Routing Algorithm (TORA), Associatively Based Routing (ABR), Signal Stability Routing (SSR) and Location Aided Routing (LAR).
3.
OVERVIEW OF AODV, DSR AND
TORA
3.1 Ad-hoc On-Demand Distance Vector
Routing (AODV)
message of the broken link then the source node restart the process of route discovery again if they still require a route for communication from source to destination. If the source node wants to establish a new route from source to destination, it sends out an RREQ packets with a new sequence number again, which is greater than 1 from the previous sequence number of the RREQ packets. It uses new sequence number to ensure that it builds a new viable route. If a node receives an invalid or unknown destination packet then it generates route error (RERR) packets.
3.2
Dynamic Source Routing protocol
(DSR)
DSR routing protocol is On-Demand routing protocol. It is also based on two mechanisms: Route Discovery and Route Maintenance.
When a node wants to communicate with another node and the route of this node is not present in its Route cache, the node starts the route discovery process to find the suitable route for that destination. The source node broadcast the RREQ (Route Request) packet to specifying the target and the unique identifier to all the neighbouring nodes. When a node receives the RREQ packet, if it has been already received the same RREQ packet, packet is discarded. Otherwise, it appends its own node address to a list in the Route Request and rebroadcasts the RREQ. Neighbours broadcast the RREQ packet to their neighbours until it reaches the destination or until it find the suitable route from source to destination. When the RREQ reaches its destination node, the destination node sends the RREP packet to the initiator of the RREQ including a copy of the accumulated list of addresses from the REQUEST. When the REPLY reaches the initiator of the RREQ, it stores the new route in its Route Cache [4, 5]. When the network topology has changed and the route of source to destination is not working properly and by using this route we cannot communicate from source to destination. If link is failure the source node of the route will be notified with a RERR packet, the source node discovers another suitable route for destination again. The Route maintenance process is used only when Source node is actually wants to communicate with the destination node.
3.3
Temporary Ordered Routing Algorithm
(TORA)
TORA [5, 11] is an On-Demand routing protocol. It creates the route from source to destination and maintains it. It can erase the route which is no longer valid. It performs the three functions which are as follows Route creation, Route maintenance and Route erasure. TORA [11] uses three types of control packets: query (QRY), update (UPD), and clear (CLR). It uses the Direct Acyclic Graph (DAG) for define the route and rooted at the destination node. Nodes use the height metric for create the DAG. Height metric consist the five parameters which is (1) logical time of link failure, (2) unique ID of the node defining the new reference level, (3) reflection indicator bit, (4) a propagation ordering parameter with respect to common reference level and (5) unique ID of node. During the route creation which node wants to communicate with the destination, it sends the QRY (query) packets and sets it route required flag. The QRY packets contain the id of the destination node.
UPD packets are used to indicate link failure. Upon link failures, route maintenance is necessary to re-establish the DAG rooted at the same destination.
It uses CLR (clear) packets for the route erasure. The CLR packets contain the reflected reference level and the destination id. CLR packets are used to erase the invalid route.
4.
SIMULATION ENVIRONMENT
The simulation experiments are performed using NS-2 by evaluating following performance metrics:
4.1
Average Throughput
Throughput shows the rate of communication per unit time or the amount of data transferred over the period of time. Average throughput is the average rate of communication per unit time. It describes the completeness and accuracy of the routing protocol [5, 7].
4.2
Packet Delivery Ratio
This is the ratio of the data packets which is successfully delivered to the destinations to those generated by the CBR sources [8].
4.3
Packet Drop Ratio
It is the ratio of the number of packet sent and the number of packets which are not received to the destinations.
4.4
Average End-To-End Delay
The End-to-End Delay of the packet is defined as the time a packet takes to travel from the source node to the destination node. The average to-end delay is the average of the end-to-end delays taken over all received packets [9].
4.5 Routing Overhead
The number of extra routing packets “transmitted” per data packet “delivered” at the destination [10].
4.6
Average Jitter
Jitter is the variation in delay for the packets belonging to the same flow. Average jitter is the average of the variation in delays for the packets belonging to the same flow.
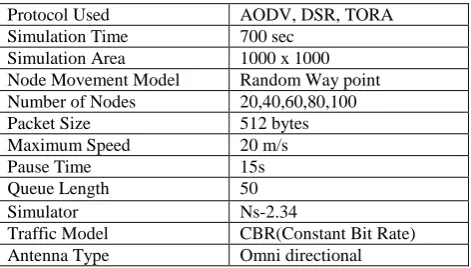
[image:2.595.312.548.604.738.2]The simulation process is divided in to two parts. In the first simulation process, the maximum speed of node is 20 m/s, pause time is 15s, simulation time is 700 sec, dimension of X and Y is (1000, 1000) and the number of nodes is varied as 20, 40, 60, 80, and 100. In the second simulation process, the number of nodes is 55, the maximum speed of node is 10 m/s, simulation time is 800 sec, dimension of X and Y is (670, 670) and the pause time is varied as 0s, 25s, 100s, 300s, and 600s. And all other simulation parameters are fixed for the both parts of simulation process. Simulation parameters are shown in Table 1 and Table 2 for first simulation process and second simulation process respectively.
Table 1: Simulation parameters for no. of nodes variation
Protocol Used AODV, DSR, TORA
Simulation Time 700 sec Simulation Area 1000 x 1000 Node Movement Model Random Way point Number of Nodes 20,40,60,80,100
Packet Size 512 bytes
Maximum Speed 20 m/s
Pause Time 15s
Queue Length 50
Simulator Ns-2.34
Traffic Model CBR(Constant Bit Rate) Antenna Type Omni directional
Table 2: Simulation parameters for pause time variation
Protocol Used AODV, DSR, TORA
Simulation Time 800 sec Simulation Area 670 x 670
Node Movement Model Random Way point
Number of Nodes 55
Packet Size 512 bytes
Maximum Speed 10 m/s
Pause Time 0s,25s, 100s, 300s, 600s
Queue Length 50
Simulator Ns-2.34
Traffic Model CBR(Constant Bit Rate)
5.
SIMULATION RESULTS &
OBSERVATIONS
The simulation results are shown in the following section in the form of line graphs. Graphs show comparison between the three reactive routing protocols by varying different numbers of nodes and pause time variation on the basis of the above-mentioned metrics.
5.1
Results for no. of nodes variation
Results of the three reactive routing protocols (AODV, DSR, and TORA) are shown in the form of graphs.
5.1.1 Average Throughput
Fig 1 shows the comparison between these routing protocols.
Fig 1: Average Throughput with varying no. of nodes
Fig 1 shows the clear result of Average Throughput. AODV performs best in terms of Average Throughput. The performance of DSR is good only for less no. of nodes. AODV performs better for less number of nodes and large number of nodes. The performance of TORA is good for large number of nodes.
[image:3.595.317.541.148.279.2]5.1.2 Packet Delivery Ratio
Fig 2 shows the comparison result of these routing protocols.
Fig 2: Packet Delivery Ratio with varying no of nodes
AODV and TORA perform best from DSR in terms of Packet Delivery Ratio. DSR performs better only less number of nodes. The PDR of DSR is decreased whenever the number of nodes increases.
5.1.3
Packet Drop Ratio
Fig 3 shows the comparison result of packet delivery ratio.
Fig 3: Packet Drop Ratio with nodes variation
TORA performs best in terms of packet drop Ratio. AODV outperforms DSR in terms of Packet Drop Ratio. DSR shows the worst performance.
5.1.4
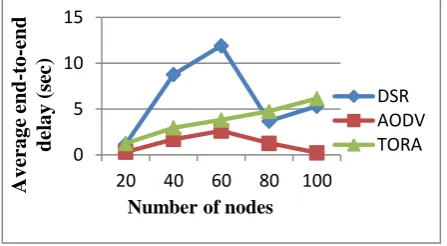
Average End-to-End Delay
[image:3.595.54.276.363.491.2]Fig 4 shows the comparison results of Average End -to-End Delay for these routing protocols.
Fig 4: End-to-End Delay with varying no. of nodes
AODV performs best in case of average end-to-end delay. AODV shows the less Average end-to-end delay when the number of nodes increases. So it performs best on large number of nodes and less number of nodes also. The performance of DSR is poor in terms of Average end-to-end delay. The performance of TORA is decreased whenever the no. of nodes increases.
5.1.5 Routing Overhead
Fig 5 shows the comparison result of Routing Overhead for these routing protocols.
Fig 5: Routing Overhead with varying no. of nodes 0
50 100 150 200
20 40 60 80 100
Av
era
g
e
T
hro
ug
hp
ut
(k
bp
s)
Number of nodes
DSR AODV
0 20 40 60 80 100
20 40 60 80 100
P
D
R
(
%
)
Number of Nodes
DSR
AODV
TORA
0 20 40 60 80 100
20 40 60 80 100
Pa
ck
et
Dro
p
Ra
tio
(%)
Number of Nodes
DSR
AODV
TORA
0 5 10 15
20 40 60 80 100
A
verage
end
-to
-end
del
ay
(se
c
)
Number of nodes
DSR AODV TORA
0 50 100 150
20 40 60 80 100
Ro
uting
O
v
er
hea
d
Number of Nodes
DSR
AODV
[image:3.595.316.540.368.491.2] [image:3.595.54.277.610.737.2] [image:3.595.317.535.623.752.2]Routing overhead is less in case of DSR only when the network size is less. AODV performs best in case of routing overhead on the large and small network size. DSR performance is little better in case of overhead than AODV on the small network scenario. The performance of TORA is decreased whenever the no of nodes increases. So TORA performs worst in terms of Routing Overhead.
5.1.6
Average Jitter
[image:4.595.318.542.97.246.2]Fig 6 shows the comparison result of Average Jitter.
Fig 6: Average Jitter with nodes variation
The performance of AODV is best in case of Average Jitter. DSR performs well on the less network scenario. The performance of TORA decreases in terms of Average Jitter whenever the number of nodes increases. TORA outperforms DSR in terms of Average Jitter whenever the number of nodes increases.
5.2
Results for pause time variation
Results for the pause time variation of these reactive routing protocols are also shown in the form of graphs.
5.2.1
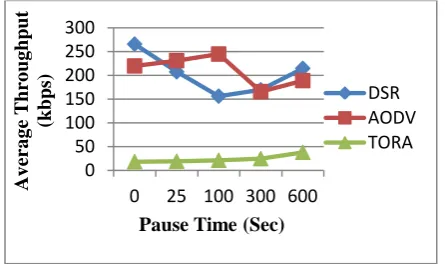
Average Throughput
Fig 7 shows the clear difference between these routing protocols.
Fig 7: Average Throughput with pause time variation
AODV performs best in case of Average Throughput. DSR performs well. TORA performs poor in terms of Average Throughput. The performance of all routing protocols is increased whenever the pause time increases.
5.2.2
Packet Delivery Ratio
Fig 8 shows the comparison result of packet delivery ratio for these routing protocols.
TORA outperforms in terms of packet delivery ratio from DSR and AODV. The performance of AODV is good and DSR performs poor in case of packet delivery ratio. The performance of AODV is improved when the pause time is
300 sec and 600 sec. AODV and TORA works better when the pause time increases.
Fig 8: Packet Delivery Ratio with varying pause time
5.2.3
Packet Drop Ratio
[image:4.595.55.265.174.315.2]Fig 9 shows the comparison results of these routing protocols.
Fig 9: Packet Drop Ratio with Pause time variation
The performance of TORA is best in terms of packet drop ratio. AODV performs well but DSR shows the poor performance in terms of packet drop ratio.
[image:4.595.319.539.296.419.2]5.2.4
Average End-to-End Delay
Fig 10 shows the comparison result of these routing protocols for pause time variation.
Fig 10: Average End-to-End Delay with varying pause time
AODV performs best and TORA outperforms DSR in terms of Average End-to-End Delay. DSR shows the poor performance result. The performance of AODV is increased whenever the pause time increases.
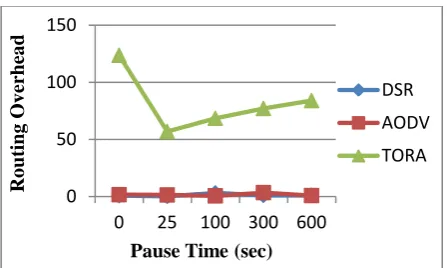
5.2.5 Routing Overhead
Fig 11 shows the comparison result of these routing protocols.
0 2 4 6 8 10
20 40 60 80 100
Av
er
a
g
e
J
it
ter
(
sec
)
No of nodes
DSR AODV TORA
0 50 100 150 200 250 300
0 25 100 300 600
Av
er
a
g
e
T
hro
ug
hp
ut
(k
bp
s)
Pause Time (Sec)
DSR AODV TORA
0 20 40 60 80 100
0 25 100 300 600
P
a
ck
et
Deliv
er
y
Ra
tio
(%)
Pause Time (sec)
DSR
AODV
TORA
0 20 40 60 80 100
0 25 100 300 600
P
a
ck
et
Dro
p Ra
tio
(%)
Pause Time (sec)
DSR
AODV
TORA
0 2 4 6 8 10 12
0 25 100 300 600
Av
er
a
g
e
E
nd
-to
-E
nd
Dela
y
(
sec
)
Pause Time (sec)
[image:4.595.53.276.483.615.2] [image:4.595.316.542.512.651.2]Fig 11: Routing Overhead with pause time variation
In terms of Routing Overhead DSR and AODV performs better and the performance of TORA is worst.
[image:5.595.55.280.281.420.2]5.2.6
Average Jitter
Fig 12 shows the comparison result of these routing protocols.
Fig 12: Average Jitter with pause time variation
AODV shows the best performance in terms of Average Jitter. DSR performs better than TORA in terms of Average Jitter with pause time variation. TORA performs worse in case of Average Jitter.
6.
CONCLUSION
AODV performs best with DSR and TORA in terms of Average Throughput, Average End-to-End Delay, Average Jitter, Packet Delivery Ratio and Routing Overhead with nodes variation and pause time variation. DSR performs well only for less number of nodes. DSR shows the highest Packet Drop Ratio with nodes variation and pause time variation. DSR performs better than TORA in terms of Average Jitter with pause time variation. TORA performs better than DSR in terms of Average jitter, Packet Delivery Ratio and Average End-to-End Delay with nodes variation. AODV shows the best overall performance in our simulation experiment.
FUTURE WORK
In the future, we can evaluate these routing protocols performance with different simulation parameters and using other existing performance metrics so we can analysis the behavior of these routing protocols more in-depth. We can also evaluate other new protocols performance.
REFERENCES
[1] Yavuz Tokgoz and Anthony Acampora, IEEE 2005. Improving Connectivity and Power Efficiency in Wireless Ad Hoc Networks through Agent Nodes. [2] Sandhya Khurana, Neelima Gupta and Nagender Aneja,
IEEE 2006. Reliable Ad-hoc On-demand Distance Vector Routing Protocol.
[3] Annand Nayyar, IEEE 2012. Simulation Based Evaluation of Reactive Routing Protocol for MANET. [4] Shaily Mittal and Prabhjot Kaur, IEEE 2009.
Performance Comparison of AODV, DSR and ZRP Routing Protocols in MANET.
[5] Anuj K. Gupta, Dr. Harsh Sadawarti and Dr. Anil K. Verma, IEEE 2010. Performance analysis of AODV, DSR and TORA Routing Protocols.
[6] Geetam S. Tomar, Manish Dixit and Shekhar Verma, IEEE 2009. AODV Routing Protocol with Selective Flooding.
[7] Deepak Dembla and Yogesh Chaba, IEEE 2010. Performance Modeling of Efficient & Dynamic Broadcasting Algorithm in MANETs Routing Protocols. [8] Saurabh Rastogi, IEEE 2006.Optimizing Routing
Protocols for Ad Hoc Network.
[9] Yogesh Chaba, Yudhvir Singh and Manish Joon, IEEE 2009.Performance Evaluation and Analysis of Cluster Based Routing Protocols in MANETs.
[10]Yogesh Chaba, Yudhvir Singh and Manish Joon, IEEE 2010.Simulation based Performance Analysis of On-Demand Routing Protocols in MANETs.
[11]Vincent D. Park and M. Scott Corson, IEEE 1998.A Performance Comparison of the Temporally-Ordered Routing Algorithm and Ideal Link-State Routing.
0 50 100 150
0 25 100 300 600
Ro
uting
O
v
er
hea
d
Pause Time (sec)
DSR
AODV TORA
0 1 2 3 4 5 6
0 25 100 300 600
Av
er
a
g
e
J
it
ter
(
sec
)
Pause Time (sec)
DSR
AODV