Resolution Typing of
Enterococcus faecium
Mark de Been,aMette Pinholt,b,cJanetta Top,aStefan Bletz,d Alexander Mellmann,dWillem van Schaik,aEllen Brouwer,a Malbert Rogers,aYvette Kraat,eMarc Bonten,aJukka Corander,fHenrik Westh,b,cDag Harmsen,gRob J. L. Willemsa
Department of Medical Microbiology, University Medical Center Utrecht, Utrecht, the Netherlandsa
; Department of Clinical Microbiology, Hvidovre University Hospital, Hvidovre, Denmarkb
; Faculty of Health and Medical Sciences, University of Copenhagen, Copenhagen, Denmarkc
; Institute of Hygiene, University of Münster, Münster, Germanyd
; Department of Microbiology and Infection Prevention, Atrium-Orbis Medical Center, Sittard, the Netherlandse
; Department of Mathematics and Statistics, University of Helsinki, Helsinki, Finlandf
; Department for Periodontology, University of Münster, Münster, Germanyg
Enterococcus faecium, a common inhabitant of the human gut, has emerged in the last 2 decades as an important multidrug-resistant nosocomial pathogen. Since the start of the 21st century, multilocus sequence typing (MLST) has been used to study the molecular epidemiology ofE. faecium. However, due to the use of a small number of genes, the resolution of MLST is limited. Whole-genome sequencing (WGS) now allows for high-resolution tracing of outbreaks, but current WGS-based approaches lack standardization, rendering them less suitable for interlaboratory prospective surveillance. To overcome this limitation, we de-veloped a core genome MLST (cgMLST) scheme forE. faecium. cgMLST transfers genome-wide single nucleotide polymorphism (SNP) diversity into a standardized and portable allele numbering system that is far less computationally intensive than SNP-based analysis of WGS data. TheE. faeciumcgMLST scheme was built using 40 genome sequences that represented the diversity of the species. The scheme consists of 1,423 cgMLST target genes. To test the performance of the scheme, we performed WGS analysis of 103 outbreak isolates from five different hospitals in the Netherlands, Denmark, and Germany. The cgMLST scheme performed well in distinguishing between epidemiologically related and unrelated isolates, even between those that had the same sequence type (ST), which denotes the higher discriminatory power of this cgMLST scheme over that of conventional MLST. We also show that in terms of resolution, the performance of theE. faeciumcgMLST scheme is equivalent to that of an SNP-based approach. In conclusion, the cgMLST scheme developed in this study facilitates rapid, standardized, and high-resolution tracing ofE. faeciumoutbreaks.
I
n the last 2 decades, Enterococcus faeciumhas emerged as an important multidrug-resistant nosocomial pathogen causing an increasing number of bloodstream infections, mainly in debili-tated patients (1–3). Currently,⬎90% of theE. faeciumstrains causing infections have acquired ampicillin resistance, and an in-creasing number of health care-associated infections and out-breaks are caused byE. faeciumstrains that are resistant to both ampicillin and vancomycin (4). The global emergence of ampicil-lin- and vancomycin-resistantE. faecium(VRE) as nosocomial pathogens started in the United States in the late 1980s/early 1990s and occurred in other parts in the world 1 or 2 decades later. In Europe, more particularly in France, Germany, Denmark, and the Netherlands, VRE first spread among livestock due to the use of the vancomycin analog avoparcin as a growth promoter, and it only relatively recently became an important nosocomial patho-gen (5,6).Different molecular typing methods have been used to study the epidemiology ofE. faecium, ranging from fingerprint-based methods, like pulsed-field gel electrophoresis (PFGE) (7), ri-botyping (8), and amplified fragment length polymorphism (9), to PCR-based methods, like multilocus variable-number tandem-repeat analysis (10) and the sequenced-based method multilocus sequence typing (MLST) (11). PFGE was for a long time consid-ered the gold standard for typingE. faecium. However, the extent of genome plasticity inE. faecium, which results in a high degree of DNA banding pattern polymorphisms among strains, compli-cates the assignment of strains to outbreaks (12,13). The devel-opment of MLST forE. faeciumhas boosted our insight into the population structure of this organism. Extensive MLST analyses
revealed that the majority of isolates causing clinical infections in hospitalized patients and hospital outbreaks are genotypically dif-ferent from commensal isolates from healthy humans and isolates from farm animals, and they formed a distinct subpopulation, which was initially termed clonal complex 17 (CC17) (14). Sub-sequent Bayesian analysis of the population structure (BAPS) ofE.
faeciumconfirmed the separate grouping of hospital, commensal,
and farm animal isolates in distinct BAPS groups, of which BAPS groups 2.1a and 3.3a represent the isolates previously contained in CC17 (15,16). Whole-genome sequence (WGS)-based phylog-enomics corroborated MLST analyses, since the majority of hospital-derived isolates (from clinical sites and hospital outbreaks), farm an-imal isolates, and commensal isolates from healthy humans clustered in the distinct clades A1, A2, and B, respectively (17).
Received18 July 2015 Returned for modification13 August 2015
Accepted15 September 2015
Accepted manuscript posted online23 September 2015
Citationde Been M, Pinholt M, Top J, Bletz S, Mellmann A, van Schaik W, Brouwer E, Rogers M, Kraat Y, Bonten M, Corander J, Westh H, Harmsen D, Willems RJL. 2015. Core genome multilocus sequence typing scheme for high-resolution
typing ofEnterococcus faecium. J Clin Microbiol 53:3788 –3797.
doi:10.1128/JCM.01946-15.
Editor:K. C. Carroll
Address correspondence to Rob J. L. Willems, [email protected].
Supplemental material for this article may be found athttp://dx.doi.org/10.1128
/JCM.01946-15.
Copyright © 2015, American Society for Microbiology. All Rights Reserved.
on May 16, 2020 by guest
http://jcm.asm.org/
The major advantage of MLST lies in the creation of an unam-biguous nomenclature for clones and thus, the generation of a common typing language. Furthermore, the fact that MLST re-sults in an allelic profile assigned from sequences of a limited number of genes makes this technique well suited for library typ-ing, i.e., the establishment of a Web-based central database that can be interrogated to study the epidemiology ofE. faeciumover time and to track the regional and global spread of particularE.
faeciumclones (11, 18,19). One drawback of MLST is that its
resolving power is insufficient for hospital outbreak investigations (13,20).
WGS has revolutionized research about the molecular epide-miology of microorganisms. It allows mapping of genome-wide variation, thereby providing the optimal resolution to infer phy-logenetic relatedness, thus identifying possible, probable, or un-likely cases of epidemiological linkage of isolates. WGS has already been used to study the epidemiology of VRE (13,21–23). In these four studies, an SNP-based approach was used in which VRE out-break strains were sequenced, and reads were mapped against a reference genome. This provided high-resolution epidemiological typing data, allowing accurate discrimination between outbreak and nonoutbreak isolates. A potential drawback when using SNP detection with reads being mapped to reference genomes is the use of different reference genomes between studies, which compli-cates comparisons of data between studies. This limitation may be overcome by using a genome-wide gene-by-gene comparison ap-proach, as in classical MLST, but with an important extension of the number of analyzed genes from seven to several hundreds or even⬎1,000 genes (24). This approach is generally applicable and has been used to study the epidemiology of various microbial pathogens, including Campylobacter jejuni, Campylobacter coli,
Listeria monocytogenes,Neisseria meningitidis,Mycobacterium
tu-berculosis, methicillin-resistantStaphylococcus aureus,Francisella
tularensis, andEscherichia coliand has been termed whole-genome
MLST (wgMLST), core genome MLST (cgMLST), or MLST⫹
(24–31).
In this study, we established a cgMLST scheme to study the genetic relatedness ofE. faeciumusing 40E. faeciumisolates rep-resenting the majorE. faeciumclades and BAPS groups, and we evaluated this scheme using epidemiologically linked isolates from five hospital outbreaks of VRE in three countries as well as epidemiologically unlinked isolates.
MATERIALS AND METHODS
cgMLST.AnE. faeciumcgMLST scheme was set up using SeqSphere⫹ version 2.3 (Ridom GmbH, Münster, Germany [http://www.ridom.de /seqsphere/]) using 40E. faeciumwhole-genome sequences publicly avail-able in GenBank (ftp://ftp.ncbi.nih.gov/genomes/) as of August 2014 (see Table S1 in the supplemental material) (17,32–35). This set included three completed genome sequences, of whichE. faeciumstrain Aus0004 (36) (GenBank accession no.NC_017022.1) was used as a reference for setting up the cgMLST scheme. Genome assemblies were imported into SeqSphere⫹as Fasta files. For the draft genomes, we considered only contigs/scaffolds ofⱖ500 bp. To determine the cgMLST target gene set, a genome-wide gene-by-gene comparison was performed using the MLST⫹target definer (version 1.0) function of SeqSphere⫹, with default parameters. These parameters included the following filters for genes of the Aus0004 reference genome that are excluded from the cgMLST scheme: a minimum length filter that discards all genes with a length of
⬍50 bp; a start codon filter that discards all genes that contain no trans-lation start codon at the beginning of the gene; a stop codon filter that
discards all genes that contain no stop codon, multiple stop codons, or a stop codon that is not at the end of the gene; a homologous gene filter that discards all genes with fragments that occur in multiple copies within a genome (with⬎90% identity and⬎100-bp overlap); and a gene overlap filter that discards the shortest of two overlapping flanking genes if these genes overlap⬎4 bp. The remaining genes were then used in a pairwise comparison using BLAST version 2.2.12 (37) against 24Enterococcus plas-mid sequences and the other 39 query genomes. These plasplas-mids came from the following strains (with GenBank accession numbers): Enterococ-cus faecalis D32 (NC_018222.1 and NC_018223.1), E. faecalis V583 (NC_004669.1,NC_004670.1, andNC_004671.1),E. faeciumAus0004 (NC_017023.1,NC_017024.1, andNC_017032.1),E. faeciumAus0085 (NC_021987.1,NC_021988.1,NC_021989.1,NC_021990.1,NC_021995.1, andNC_021996.1),E. faeciumDO (NC_017961.1,NC_017962.1, and
NC_017963.1),E. faeciumNRRL B-2354 (NC_020208.1),Enterococcus hirae ATCC 9790 (NC_015845.1), and Enterococcus mundtii QU 25 (NC_022879.1, NC_022880.1, NC_022881.1, NC_022883.1, and
NC_022884.1). First, all reference genes that were detected in any of the 24 availableEnterococcusplasmid sequences with a sequence identity of
ⱖ90% and 100% overlap were discarded. Second, all remaining genes of the reference genome that were detected in all query genomes with a sequence identity ofⱖ90% and 100% overlap and that passed the (de-fault) SeqSphere⫹parameter stop codon percentage filter (this discards all genes that have internal stop codons in⬎20% of the query genomes) formed the final cgMLST scheme.
Isolate collection for validating the cgMLST scheme.A collection of 103 hospital-associated VRE strains was sequenced to assess the perfor-mance of theE. faeciumcgMLST scheme as an epidemiological typing scheme. The strains had been isolated in a German hospital (DEU-A) in the period 2003 to 2006 (46 isolates), two Danish hospitals (DNK-A and DNK-B) in the period 2012 to 2013 (37 isolates), and two Dutch hospitals (NLD-A and NLD-B) in the period 2012 to 2013 (20 isolates) (see Results; see also Table S2 in the supplemental material for details). Except for two hospital environmental strains, all strains had been isolated from hospitalized patients or from individuals with a recent history of hos-pitalization. All isolates were typed by MLST (http://pubmlst.org /efaecium/) (11).
The German VRE strain collection included 46 isolates from a single hospital (DEU-A). Most isolates (n⫽44) were of human origin, all being collected from different patients from diagnostic specimens (urine spec-imens and wound swabs) or during screening efforts (anal swabs and stool specimens). The two remaining isolates were of environmental origin. The isolates had been collected from six different hospital departments representing 11 different wards in the time periods September 2003 (2 isolates), April to August 2004 (18 isolates), and December 2005 to Janu-ary 2006 (26 isolates). The most abundant ST among the isolates was ST18 (36 isolates), which was detected in all three time periods. Other detected STs included ST17 (4 isolates, detected in December 2005 to January 2006), ST16 (3 isolates, June to July 2004), ST78 (2 isolates, September 2003 and January 2006), and ST192 (1 isolate, December 2005).
The Danish VRE strain collection included 37 isolates from two hos-pital outbreaks. The first Danish VRE hoshos-pital outbreak (hoshos-pital DNK-A) included 16 isolates collected from different patients (one isolate per pa-tient) from the same hospital ward in June 2013. All isolates were typed as ST192. Based on epidemiological data, the isolates were considered to be part of one clonal outbreak. An additional ST192 isolate (V45) was col-lected already in December 2012 from a patient hospitalized in a different department. Based on epidemiological data, this isolate was considered to be unrelated to the outbreak that followed in June 2013, but it was in-cluded in the current study for control purposes. The second Danish VRE hospital outbreak (hospital DNK-B) included 19 isolates collected from different patients from the same ward in January to December 2013. All isolates were typed as ST80 and, based on epidemiological data, were considered to be clonally related. An additional unrelated ST80 isolate
on May 16, 2020 by guest
http://jcm.asm.org/
(V13) from a different hospital (DNK-A), collected in December 2012, was included in this study for control purposes.
The Dutch VRE strains included 20 isolates from two hospital out-breaks. The first outbreak included 4 isolates (hospital NLD-A) collected from different patients from the same ward. All isolates were typed as ST117. For three isolates, there was a clear epidemiological link, because these isolates had been collected from three patients that shared the same room at the same time (April 2013). The fourth isolate had been collected in August 2012 and had no clear link with the other isolates. The second outbreak from hospital NLD-B included 16 isolates collected from differ-ent patidiffer-ents from several differdiffer-ent wards, in which patidiffer-ents were fre-quently transferred between wards in March to July 2013. All isolates were typed as ST192 and, according to epidemiological data, were assumed to belong to one clonal outbreak.
Whole-genome sequencing and assembly.Genomic DNA was iso-lated from cell pellets using a DNeasy blood and tissue kit (Qiagen, Co-penhagen, Denmark); for the isolates from Denmark, the Wizard genomic DNA purification kit (Promega Benelux BV, Leiden, the Neth-erlands) was used, except those from hospital NLD-A; and the Qiagen MagAttract HMW-kit (Qiagen, Hilden, Germany) was for the isolates from Germany and from the Dutch hospital NLD-A, according to the manufacturer’s instructions. Samples were prepared using Nextera XT chemistry (Illumina, Inc., San Diego, CA, USA) and were sequenced lo-cally using Illumina MiSeq paired-end read technology, generating reads of 150, 250, or 300 bp in length. For a subset of isolates, two sequencing runs were performed to increase the total sequencing depth (see Table S2 in the supplemental material for details). Raw Illumina reads were ana-lyzed centrally at the University Medical Center (UMC) Utrecht and quality filtered using Nesoni version 0.109 (Victorian Bioinformatics Consortium, Monash University, Melbourne, Australia). Default fil-tering options were used, including clipping of low-quality and am-biguous bases (Nesoni options: -quality 10, -clip-amam-biguous yes) and adapter sequences (Nesoni options: -match 10, -max-errors 1). Reads of⬍130 nucleotides and their corresponding paired reads were ex-cluded from further analysis (Nesoni option: -length 130). Quality-filtered reads were assembledde novousing SPAdes version 3.0.0 (38) (the -careful option was used). Short-read assemblers, like SPAdes, make use ofk-mer overlapping to build an assembly. Ak-mer refers to all possible subsequences of lengthkfrom the sequencing reads. SPAdes does not make a single assembly using a single preselectedk-mer value but rather makes a combined assembly using multiple preselectedk-mer values. This is advantageous because smallerk-mer values allow for increased sensitivity (but may result in spurious overlaps), whereas largerk-mer values allow for increased specificity (but decreased sensitivity). Therefore, it is suggested by the developers to use a broad range of
k-mer sizes, and we used a preselected set ofk-mers of sizes 25, 45, 65, 85, 105, and 125. Scaffolds of size ⬍500 bp or a mean nucleotide assembly depth of⬍10-fold were discarded. The scaffold mean nucle-otide assembly depth was calculated using the formula Ck⫻L/(L⫺k ⫹1), where Ckis thek-mer coverage as reported by SPAdes,Lis the average read length, andkis the size of the largestk-mer used (i.e., 125). The assemblies of the 103 VRE genomes were loaded into Se-qSphere⫹and were used to evaluate the applicability of theE. faecium
cgMLST scheme. In a well-defined cgMLST scheme,ⱖ95% of the cg-MLST genes should be present in all isolates.
A NeighborNet phylogenetic network was constructed to visualize the relationship between 176E. faeciumisolates. These isolates included the 40E. faeciumisolates used to build the cgMLST scheme, the 103 VRE outbreak isolates, and 33 additionalE. faeciumisolates for which whole-genome sequences were publicly available (see Table S3 in the supplemen-tal material). For this, allelic profiles were extracted from SeqSphere⫹, and a distance matrix was built from all pairwise allelic profile compari-sons. Subsequently, the network was constructed using the NeighborNet algorithm, as implemented in SplitsTree version 4 (http://www.splitstree .org).
Whole-genome sequence analysis for inferring an SNP-based phy-logeny.A whole-genome sequence alignment of the 103 sequencedE. faeciumisolates was built using theE. faeciumcgMLST scheme in Se-qSphere⫹. For each isolate, a concatenated Fasta sequence, containing the cgMLST target gene sequences that were conserved in all 103 isolates, was extracted from SeqSphere⫹. In these concatenated Fasta sequences, the order and orientation of the cgMLST target gene sequences were the same as in the reference strain Aus0004. The concatenated Fasta sequences of all 103 isolates were subsequently aligned outside the SeqSphere⫹software using MAFFT version 7.215 (39) (used option: -auto), after which gapped positions were removed from the alignment using anad hocPython script. Recombination filtering was performed with Gubbins (40), using default settings. A phylogenetic tree was built on the filtered (recombination-free) polymorphic sites using RAxML version 7.2.8 (41) under the GTRCAT model. Confidence was inferred by running 1,000 bootstrap replicates under the same model.
Nucleotide sequence accession number.All generated raw reads were submitted to the European Nucleotide Archive (ENA) of EBI under the study accession number PRJEB9270. The ENA sample identification numbers (IDs) are listed in Table S2 in the supplemental material.
RESULTS
Development of anE. faeciumcgMLST scheme. To set up a cgMLST scheme for E. faecium, 40 whole-genome-sequenced strains were used. Of these 40 strains, 37 were described previously in Lebreton et al. (17). We selected these 37 strains to represent the
E. faeciumphylogeny. Together with three additional strains (DO
[TX16], NRRL B-2354 [33,35], and E1293 [GenBank accession no.NZ_AHWU00000000]), the set of 40 strains used for building the cgMLST scheme included clade A1 (9 isolates), clade A2 (18 isolates), clade B (12 isolates), and one strain that appears to be a hybrid of clades A and B. In total, 36 different STs were repre-sented, and these were previously allocated to 11 different BAPS groups (16). All of the selected strains had high-quality genome sequences, as reflected by the relatively low number of contigs or scaffolds (median, 13; range, 3 to 109) for the 37 draft genome sequences (see Table S1 in the supplemental material).
The completed chromosomal sequence ofE. faeciumAus0004 (36) (GenBank accession no.NC_017022) was used as a reference for building the cgMLST scheme. The final scheme consisted of 1,423 cgMLST target genes (49.8% of the 2,860 chromosomal coding sequences in this strain) corresponding to 1.35 Mbp (45.7% of the 2.96 MbpE. faeciumAus0004 chromosome) (see Data Set S1 in the supplemental material).
Sequencing ofE. faeciumhospital outbreak isolates.To test the applicability of theE. faeciumcgMLST scheme to distinguish epidemiologically linked isolates from unlinked isolates, i.e., to identify isolates belonging to a single outbreak, we sequenced a collection of 103 hospital-associated VRE strains that had been isolated from different hospitals in Germany, Denmark, and the Netherlands. Based on the STs of these strains, they are all ex-pected to belong to the hospital-associated clade A1 and BAPS groups 2.1a and 3.3a, respectively (16,17). An overview of these isolates is provided in Table S2 in the supplemental material.
All 103 isolates were sequenced using Illumina MiSeq technol-ogy. Raw reads were quality filtered and assembledde novo, gen-erating assemblies with a mean⫾standard deviation (SD) size of 2.94⫾0.089 Mbp, a mean⫾SD number of 173⫾24 scaffolds, and a mean⫾SD nucleotide assembly depth of 87.3-fold⫾ 37.1-fold. The mean⫾SD contigN50was 44.9⫾6.7 kbp (see Table S2 in the supplemental material). These assembly statistics are com-parable to those previously found for other hospital-associatedE.
on May 16, 2020 by guest
http://jcm.asm.org/
faeciumstrains using similar sequencing technologies (42), and they show that the draft genome sequences generated here were of high quality.
Evaluation of theE. faeciumcgMLST scheme.TheE. faecium
cgMLST scheme with 1,423 genes was evaluated using the whole-genome assemblies of the 103 VRE outbreak isolates sequenced in this study. Loading the assemblies into the cgMLST scheme using SeqSphere⫹showed that for each isolate,ⱖ97.4% of the cgMLST target genes were present, with a mean⫾SD of 99.1%⫾0.4% cgMLST target genes present per isolate (see Data Set S2 in the supplemental material). The fact that not all targets were identi-fied in all of the VRE outbreak strains can be explained by the fact that the target gene (i) was not (fully) covered during sequencing just by chance, (ii) was incorrectly assembled, (iii) is really absent from the corresponding isolate, or (iv) did not pass the Se-qSphere⫹quality controls, because it carried a frameshift or an internal stop codon, etc. Furthermore, as with all core-genome-based methods, the size of the core genome inevitably decreases when the number of analyzed isolates increases. To assess the re-lationship between the 103 isolates, we visualized the distances between their allelic profiles in a minimum spanning network by
ignoring missing values (relating to the missing cgMLST target genes) in each pairwise allelic profile comparison. The resulting network is depicted inFig. 1and shows that the isolates grouped in accordance to their ST and place of isolation. Based on ST, geo-graphic location, and position in the network, six clusters of at least three VRE are observed, of which the largest one is formed by the 36 German (hospital DEU-A) ST18 isolates. The other five clusters include the Danish ST80 (DNK-B hospital, plus one out-lier from DNK-A) (20 isolates) and ST192 (DNK-A hospital; 17 isolates) VRE, the Dutch ST192 (NLD-B hospital; 16 isolates) and ST117 (NLD-A hospital; 4 isolates) VRE, and the German ST17 (DEU-A hospital; 4 isolates). The German ST16 VRE (DEU-A; 3 isolates) appeared to be relatively unrelated to each other (Fig. 1). The German ST18 isolates UW5429 and UW6476 and the Danish ST80 isolate V13 and ST192 isolate V45 are relative outliers within their indicated clusters, differing byⱖ30, 28, 283, and 20 alleles, respectively, from any other cluster member. In contrast, all of the other distances within these associated clusters shown inFig. 1do not exceed 11 different alleles. In terms of isolation place and date, the outlying clustering position of the two German ST18 isolates could not be readily explained (see Discussion). In contrast, the FIG 1Minimum spanning network built from the core genome allelic profiles of 103 clinicalE. faeciumisolates. The core genome allelic profiles were determined by loadingde novoassemblies into theE. faeciumcgMLST scheme developed in this study using the SeqSphere⫹software. TheE. faeciumcgMLST scheme targets 1,423 single-copy core genes. The distance matrix underlying the network was built from all pairwise allelic profile comparisons, using the pairwise ignoring missing values option in SeqSphere⫹. Using this option, genes with at least one missing value are not completely removed from the comparison but are ignored only during a pairwise comparison in case of a missing value. Only allelic distances ofⱖ20 are shown. The seven clusters that contain at least three isolates are color-coded. Isolates that are discussed in the main text are indicated with arrows. dept., department.
on May 16, 2020 by guest
http://jcm.asm.org/
clustering position of the two Danish isolates agreed with available epidemiological data (see Table S2 in the supplemental material) (V13, different hospital; V45, different ward and different date). In addition, it has to be noted that within our isolate collection, ST192 was represented by isolates from all three countries, and the cgMLST scheme is capable of distinguishing between these iso-lates according to their country of isolation, thereby underlining the considerable increase in resolution provided by cgMLST over MLST. The Dutch and Danish ST192 VRE are located in distinct clusters (Fig. 1), which are connected to each other via the German ST192 isolate UW6455, from which they differ by a relatively large number of alleles, 80 and 65, respectively. The above data show that theE. faeciumcgMLST scheme performs well and has suffi-cient resolution to distinguish between nonepidemiologically re-lated isolates, even between those that have the same ST.
To gain more detailed insight into the allelic diversity among epidemiologically linked isolates, we analyzed all pairwise allelic differences between isolates that (i) had the same ST and (ii) had been isolated in the same hospital.Figure 2Ashows a histogram of the 1,073 pairwise allelic profile comparisons. The distribution of allele differences was multimodal. The bulk of the distribution encompassed 984 pairwise comparisons (92% of all comparisons) and included a range of 0 to 17 allelic differences, with a mean⫾ SD difference of 6.4⫾3.8 alleles. An allele difference of 3 was found most frequently (110⫻) within this part of the distribution. The remainder of the distribution mostly included allele differ-ences ranging from 20 to 41 (85 comparisons [7.9% of all com-parisons]). Closer inspection of the data showed that this part of the distribution was virtually completely formed by comparisons between the Danish ST192 isolate V45 and its cocluster members
and between the German ST18 isolates UW5429 and UW6476 and their cocluster members. Because 92% of all likely epidemiologi-cally related pairs of isolates differed byⱕ20 alleles, we used this difference as a threshold for cluster types (CT), i.e., a threshold for identifying clonally relatedE. faeciumisolates using the cgMLST scheme developed here. Based on this threshold, the positive pdictive value for defining isolates as being epidemiologically re-lated (i.e., same ST, same hospital) is 100%, while the negative predictive value for defining isolates as being nonepidemiologi-cally related is 97.7%.
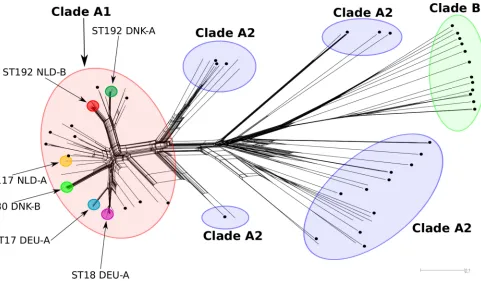
To further evaluate the threshold ofⱕ20 alleles difference for defining clonally relatedE. faeciumisolates, the genetic relatedness of the 103 outbreak isolates with the 40 isolates used to build the cgMLST scheme and 33 additionalE. faeciumisolates for which whole-genome sequences were publicly available (see Table S3 in the supplemental material) was inferred by constructing a phylo-genetic network (Fig. 3). This network illustrates the diversity that was captured by selecting these 40 strains. It also revealed that the VRE hospital outbreak isolates from the Netherlands, Denmark, and Germany formed dense clusters of isolates, as expected, within clade A1. Based on the distance matrix built from the 176 isolates underlying this phylogenetic network displayed inFig. 3, we also calculated the average number of nonidentical alleles of isolates belonging to one of the six outbreak clusters with an iso-late that was closest to an outbreak cluster (but not part of it) in the phylogenetic network. This comparison revealed that isolates that are genetically closest to the outbreak isolates differed more than the threshold for clonality ofⱕ20 alleles difference, as defined above. Furthermore, apart from the 103 VRE outbreak isolates, only one of the 2,628 pairwise comparisons between 73 presumed FIG 2Distribution of allele differences (A) and recombination-filtered SNPs (B) for pairs ofE. faeciumisolates with the same ST and isolated from the same hospital. The distributions represent 1,073 pairwise comparisons. Allelic profiles were extracted from SeqSphere⫹, after which pairwise isolate allelic differences were determined using anad hocPython script. Missing values were ignored, similar to the pairwise ignoring missing values option in SeqSphere⫹. The number (nr.) of recombination-free SNPs between isolates was extracted from a core genome sequence alignment of all 103 isolates sequenced in this study. The alignment was built, using MAFFT (39), from the concatenated nucleotide sequences of the cgMLST target genes present in all isolates. The alignment was filtered for recombination using Gubbins (40). Anad hocPython script was used to extract pairwise recombination-free SNPs from this alignment.
on May 16, 2020 by guest
http://jcm.asm.org/
[image:5.585.41.540.60.315.2]to be epidemiologically nonlinkedE. faeciumisolates resulted in a difference of⬍20 alleles. The single pairwise comparison in which the allelic difference was⬍20 alleles involved anE. faeciumisolate from a Belgian dog from 1995 and an isolate from a hospitalized patient from the Netherlands also from 1995. This finding might indicate a cryptic epidemiological link, although unlikely; more likely, it indicates a swab or mixture of isolates, isolated genomic data, or sequence libraries, since both strains were sequenced as part of the same whole-genome sequencing project (17).
Comparison between cgMLST and an SNP-based phyloge-netic method.As a final evaluation of the applicability and reso-lution of theE. faeciumcgMLST scheme, we compared the level of genetic relatedness of isolates based on allelic profiles and at the nucleotide level. To make a fair comparison, we used the nucleo-tide sequences of the same 1,423 cgMLST target genes to build a whole-genome sequence alignment of the same 103 isolates. For each isolate, a concatenated sequence of all cgMLST target genes was extracted using SeqSphere⫹. We used only cgMLST target genes that were present in all 103 isolates, meaning that 177 of the 1,423 genes were not used. The concatenation of gene sequences was done by proceeding in the order and orientation of ortholo-gous genes in strain Aus0004. The resulting alignment had a length of 1.18 Mbp, including 7,813 polymorphic sites. We used Gubbins (40) to detect recombinant genomic regions, i.e., regions containing significantly elevated numbers of SNPs. Isolates be-longing to the same CT generally carried the same recombinant regions. The exceptions were isolates UW5445 (German ST18) and V107 (Danish ST192), which both carried an additional
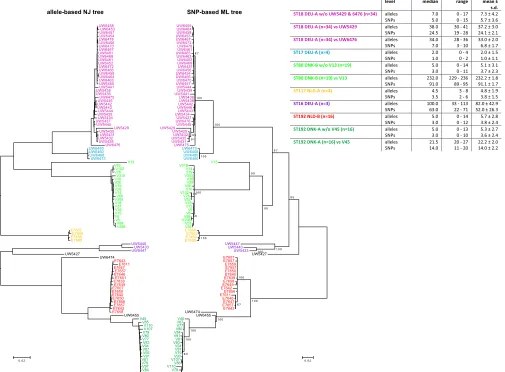
re-combinant region (13 and 49 bp, respectively) compared to their cocluster members. Considering one representative isolate per CT, we found that on average, each CT carried 14.8 (SD, 6.5) recombination events, with an average size of 13.4 kbp (SD, 14.8 kbp). After recombination filtering, 680 polymorphic sites were left for phylogenetic analysis. We compared the resulting SNP-based maximum likelihood (ML) tree against a neighbor-joining (NJ) tree built using the cgMLST profiles of the 103 isolates (Fig. 4). This revealed that the topologies of the two trees were highly congruent. The same seven clusters of isolates described above were observed in both trees, including the German ST18 (36 iso-lates), ST17 (4 isoiso-lates), and ST16 (3 isoiso-lates), the Danish ST80 (20 isolates) and ST192 (17 isolates), and the Dutch ST192 (16 iso-lates) and ST117 (4 isoiso-lates) clusters. In the ML tree, strong boot-strap support was found for each of these clusters.
To further compare the cgMLST-based allelic diversity and SNP-based diversity, we quantified the number of recombina-tion-filtered SNPs in the same 1,073 isolate pairs with the same ST and isolated from the same hospital, as described above.Figure 2B
shows the distribution of these pairwise comparisons. Similar to the distribution of allele differences (Fig. 2A), the bulk of the pair-wise SNP comparisons are concentrated within a narrow range of 0 to 16 SNPs (1,033 comparisons [96% of total comparisons]), strongly suggesting a clonal relationship between two isolates, at least when the number of SNPs between them isⱕ16 (Fig. 4). Given these data, it is important to note that the application of the two different thresholds for clonality (i.e.,ⱕ20 different alleles or FIG 3NeighborNet phylogenetic network to visualize the relationships between 176E. faeciumisolates. The distance matrix underlying the network was built from all pairwise allelic profile comparisons. Allelic profiles were extracted from SeqSphere⫹.E. faeciumclades inferred from the STs and based on Lebreton et al. (17) are indicated by large red (clade A1), blue (clade A2), and green (clade B) circles. Small black circles indicate the 40E. faeciumisolates used to build the cgMLST. The epidemiologically linked VRE outbreak isolates (ST117 NLD-A, ST192 NLD-B, ST17 DEU-A, ST18 DEU-A, ST192 DNK-A, and ST80 DNK-B) are indicated by small colored circles, using the same color-coding as inFig. 1, and by arrows and information in the text.
on May 16, 2020 by guest
http://jcm.asm.org/
[image:6.585.57.538.65.346.2]ⱕ16 SNPs between isolates) results in the prediction of virtually identical clusters of clonally related isolates.
The combined allelic and SNP-based diversity data also sup-port the fact that isolate V13 was indeed not part of the ST80 outbreak in hospital DNK-B, confirming the epidemiological data (V13 was isolated in another Danish hospital, DNK-A). Isolate V13 differed substantially (229 to 236 different alleles and 89 to 95 SNPs) from the other ST80 isolates from this hospital, and phylo-genetic clustering also placed this isolate outside the large ST80 branch in both trees (Fig. 4). For isolate V45 from the other Dan-ish outbreak in hospital DNK-A, the situation is less clear. Isolate V45 clusters outside the Danish ST192 branch in both trees (Fig. 4), but it is not particularly distinct from the other Danish ST192 isolates, from which it differs by 20 to 27 alleles and by 11 to 20 SNPs, which partially overlaps the threshold for inclusion in an outbreak, as defined in this study. Isolate V45 was recovered from the same hospital (DNK-A) as the other ST192 VRE but from a different department, 6 months before the large ST192 outbreak. Given previous core genome mutation rate estimates for clinicalE.
faeciumranging from 1.5⫻10⫺6to 4.9⫻10⫺5substitutions/site/
year (17,21), the expected number of SNPs to accumulate in an 1.18-MbpE. faeciumcore genome in 6 months is 1 to 29. The maximum of 20 SNPs (per 1.18-Mbp alignment) found here thus lies within the expected range of SNPs to arise, suggesting that isolate V45 is probably clonally related to the ST192 outbreak that occurred 6 months later.
DISCUSSION
Here, we describe the establishment of a cgMLST scheme forE.
faecium. The scheme was built from 40 previously sequencedE.
faeciumgenomes that represented the known population diversity
ofE. faeciumand consisted of 1,423 cgMLST target genes. This is
in the same range as previous estimates of the number ofE. fae-ciumcore genes. For instance, a set of 1,512 single-copy core genes has been found in 34E. faeciumgenomes (42), and a set of 1,344 single-copy core genes has been found in 73E. faeciumgenomes (17), using OrthoMCL-based methods (43). The scheme was val-idated by sequencing the genomes of 103 VRE from five hospitals FIG 4Allele-based neighbor-joining (NJ) and SNP-based maximum likelihood (ML) trees of 103 clinicalE. faeciumisolates. The allele-based NJ tree (left) was built using theE. faeciumcgMLST scheme developed in this study using the SeqSphere⫹software. The SNP-based ML tree (right) was built from a recombi-nation-filtered alignment of the concatenated cgMLST target gene sequences present in all 103 isolates. The ML tree was built using RAxML (41) (general time-reversible [GTR] model, 1,000 bootstraps). Relevant statistics relating to the number of different alleles and SNPs within the sevenE. faeciumclusters are shown in the top right table. The same color-coding inFig. 1is used for the sevenE. faeciumclusters.
on May 16, 2020 by guest
http://jcm.asm.org/
[image:7.585.42.547.70.442.2]in three countries. Based on the results, we propose the following thresholds and epidemiological interpretation for allelic differ-ences that are observed when using theE. faeciumcgMLST scheme described here: (i) isolates that differ by 0 to 20 alleles are either indistinguishable (0 differences) or closely related and most likely belong to the same outbreak, (ii) isolates that differ by 21 to 40 alleles possibly belong to the same outbreak, and (iii) isolates that differ by⬎40 alleles are most likely unrelated and do not belong to the same outbreak. Based on these criteria, we decided to set the threshold for CT at a maximum difference of 20 alleles. We believe this threshold is broadly applicable to the speciesE. faeciumbut not automatically to other species; however, as with other typing methods, the thresholds and criteria formulated for theE. faecium
cgMLST-based CT assignment should be handled with a certain level of flexibility. Furthermore, as with other typing methods, cgMLST-based criteria or thresholds help stratify and refine data by providing more sensitive and specific measurements; however, they should not substitute for clinical epidemiological investiga-tions. Particularly for isolates differing between 21 to 40 alleles, additional epidemiological data need to be assessed to increase the likelihood that these isolates are correctly assigned to a single out-break. Also, clustering the allelic profiles using the neighbor-join-ing method and analyzneighbor-join-ing branch topologies will indicate whether isolates that differ by 21 to 40 alleles cluster within or outside a branch containing related isolates. If more time and resources are available, an SNP-based phylogenetic approach, such as the one discussed here, could be used alongside the cgMLST approach. An SNP-based approach may reveal additional information, such as recombination events or the existence of hypermutators, but this is not strictly necessary to reliably infer epidemiological linkage, which is the main purpose of molecular typing. In addition, the calculation of exact evolutionary distances (based on SNPs) be-tween isolates allows for an estimation of the mutation rate and the dating of the most recent common ancestor of clones.
We show here that the developed cgMLST forE. faecium per-forms equally well as an SNP-based phylogenetic approach. How-ever, the advantage of the cgMLST scheme over SNP-based ap-proaches is that, as in conventional MLST, cgMLST enables storing and curating allelic data in a central database, which is a prerequisite for ensuring a universal and expandable nomencla-ture that is pivotal for global and long-term epidemiological stud-ies. An open and public nomenclature database with software tools and an interface for users, which is the ultimate goal, is cur-rently under construction and is anticipated to be launched at the end of 2015 or early 2016. An additional advantage of an allele-based approach is that it treats both a genetic mutation, which creates an SNP, and a genetic recombination event, which likely introduces multiple SNPs, correctly as one evolutionary event (24,
29), which better defines genetic relationships in bacteria with high recombination rates, likeE. faecium(42). However, it has to be emphasized that recombination events that affect multiple flanking genes are misinterpreted by allele-based approaches as multiple (i.e., equal to the number of affected genes) evolutionary events. Thus, cgMLST is not completely insensitive to recombina-tion. For this reason, we used an SNP-based (plus recombination filtering) approach alongside the cgMLST approach. Because the two methods produced highly comparable outcomes, we are con-fident in the applicability of cgMLST to studyE. faecium epidemi-ology.
In the evaluation data set of 103 isolates, two isolates did not
meet the CT criterion ofⱕ20 different alleles for inclusion in a larger outbreak, whereas based on ST, geographic location, and time of isolation, these isolates were predicted to be part of that outbreak. One of these exceptions was the ST18 strain UW5429, which was isolated on 14 July 2004 from hospital DEU-A during the ST18 hospital outbreak period. However, this isolate differed by 30 to 41 alleles from the other ST18 isolates from this hospital, which falls outside the CT criterion for the cgMLST scheme. Nev-ertheless, the nested placement of UW5429 within the ST18 branch in both allele- and SNP-based trees (Fig. 4) suggests a clonal relationship between UW5429 and the other ST18 isolates. The relatively large distance of UW5429 from the other ST18 iso-lates in terms of different alleles (30 to 41) and SNPs (19 to 28) may point to a hypermutating phenotype. Similarly, isolate UW6476, which is also an ST18 isolate from hospital DEU-A, was isolated during the outbreak period. Based on these epidemiolog-ical data, this isolate was also expected to be part of the ST18 outbreak in hospital DEU-A. However, the isolate differed by 28 to 36 alleles from the other ST18 outbreak isolates. Again, epide-miological data and the fact that UW6476 is nested within the ST18 branch in both allele- and SNP-based trees (Fig. 4) suggest that UW6476 is part of the same ST18 outbreak. Remarkably, the number of recombination-filtered SNPs between UW6476 and any of the other ST18 isolates was low (3 to 10 SNPs). Observed discrepancies between allele- and SNP-based approaches, such as for this particular case, are likely due to recombinant genes that can affect the number of allelic differences but are filtered out from the whole-genome sequence alignment after correction for recombinations.
The cgMLST scheme also disclosed epidemiological links that were not previously apparent. This is exemplified by the four ST117 VRE isolates from hospital NLD-A. Based on initial epide-miological criteria, three of these VRE (E7662, E7686, and E7689) were most likely part of one circulating clone, because they were isolated from three patients (patients 2, 3, and 4) who shared the same hospital room during overlapping time periods in April 2013. One VRE isolate (E7486), however, was recovered 8 months prior (August 2012) from patient 1, with no apparent epidemio-logical link with patients 2 to 4. Applying cgMLST revealed that all four isolates were closely related, differing by no more than eight alleles, strongly suggesting a clonal relationship between them. Careful reexamination of possible epidemiological links between the patients from which these four VRE were recovered revealed that patient 1 shared rooms with patient 2 in August 2012, during which the acquisition of VRE by patient 2 might have occurred. This became apparent only after a positive clinical culture result in April 2013.
A similar example is the ST18 outbreak in the German hospital DEU-A. Based on the time of isolation (April to August 2004 and December 2005 to January 2006) and PFGE profile (data not shown), the initial interpretation was that these two clusters of ST18 isolates were not epidemiologically linked. cgMLST of these isolates clearly indicated that with two possible exceptions that are discussed above (isolates UW5429 and UW6476), all ST18 isolates from both time periods were clonally and thus epidemiologically linked.
These examples illustrate the strengths of the cgMLST scheme in disclosing clonal linkage when epidemiological linkage is less obvious. This is especially important for nosocomial pathogens, such as VRE, which are able to survive and circulate for long time
on May 16, 2020 by guest
http://jcm.asm.org/
periods in hospital wards (44). In addition, cgMLST can be per-formed on a desktop computer and does not necessitate the use of advanced bioinformatics tools. The ease of use of cgMLST opens up possibilities for routine outbreak investigations in clinical set-tings, where bioinformatics support is limited. In conclusion, the cgMLST scheme developed in this study facilitates rapid, stan-dardized, and high-resolution tracing ofE. faeciumoutbreaks.
ACKNOWLEDGMENTS
This work was supported by The European Union Seventh Framework (http://ec.europa.eu/research/fp7/) program “Evolution and transfer of antibiotic resistance” (EvoTAR) (FP7-HEALTH-2011-single-stage, grant 282004 to M.D.B., W.V.S., and R.J.L.W.), by grant 251170 from the Acad-emy of Finland to J.C., and partly funded by the European Community’s Seventh Framework Program (grant FP7/2007-2013 to A.M. and D.H.) under grant 278864 in the framework of the European Union (EU) Patho-NGen-Trace project.
D.H. is a codeveloper of the Ridom SeqSphere⫹software mentioned in the manuscript, which is a development of the company Ridom GmbH (Münster, Germany) that is partially owned by him. All other authors declare no conflicts of interest.
REFERENCES
1.Willems RJ, van Schaik W.2009. Transition ofEnterococcus faeciumfrom commensal organism to nosocomial pathogen. Future Microbiol4:1125– 1135.http://dx.doi.org/10.2217/fmb.09.82.
2.Arias CA, Murray BE.2012. The rise of theEnterococcus: beyond vanco-mycin resistance. Nat Rev Microbiol 10:266 –278.http://dx.doi.org/10 .1038/nrmicro2761.
3.Gilmore MS, Lebreton F, van Schaik W.2013. Genomic transition of enterococci from gut commensals to leading causes of multidrug-resistant hospital infection in the antibiotic era. Curr Opin Microbiol16:10 –16.
http://dx.doi.org/10.1016/j.mib.2013.01.006.
4.Cattoir V, Giard J-C.2014. Antibiotic resistance inEnterococcus faecium
clinical isolates. Expert Rev Anti Infect Ther12:239 –248.http://dx.doi.org /10.1586/14787210.2014.870886.
5.Bonten MJM, Willems RJL, Weinstein RA.2001. Vancomycin-resistant enterococci: why are they here, and where do they come from? Lancet Infect Dis1:314 –325.http://dx.doi.org/10.1016/S1473-3099(01)00145-1. 6.Werner G, Coque T, Hammerum A, Hope R, Hryniewicz W, Johnson A, Klare I, Kristinsson K, Leclercq R, Lester C, Lillie M, Novais C, Olsson-Liljequist B, Peixe L, Sadowy E, Simonsen G, Top J, Vuopio-Varkila J, Willems R, Witte W, Woodford N.2008. Emergence and spread of vancomycin resistance among enterococci in Europe. Euro Sur-veill13:pii⫽19046.http://www.eurosurveillance.org/ViewArticle.aspx ?ArticleId⫽19046.
7.Clark NC, Cooksey RC, Hill BC, Swenson JM, Tenover FC. 1993. Characterization of glycopeptide-resistant enterococci from U.S. hospi-tals. Antimicrob Agents Chemother37:2311–2317.http://dx.doi.org/10 .1128/AAC.37.11.2311.
8.Brisse S, Fussing V, Ridwan B, Verhoef J, Willems RJ.2002. Automated ribotyping of vancomycin-resistantEnterococcus faeciumisolates. J Clin Microbiol40:1977–1984.http://dx.doi.org/10.1128/JCM.40.6.1977-1984 .2002.
9.Willems RJ, Top J, van Den Braak N, van Belkum A, Endtz H, Mevius D, Stobberingh E, van Den Bogaard A, van Embden JD. 2000. Host specificity of vancomycin-resistantEnterococcus faecium. J Infect Dis182:
816 – 823.http://dx.doi.org/10.1086/315752.
10. Top J, Schouls LM, Bonten MJ, Willems RJ. 2004. Multiple-locus variable-number tandem repeat analysis, a novel typing scheme to study the genetic relatedness and epidemiology ofEnterococcus faeciumisolates. J Clin Microbiol 42:4503– 4511. http://dx.doi.org/10.1128/JCM.42.10 .4503-4511.2004.
11. Homan WL, Tribe D, Poznanski S, Li M, Hogg G, Spalburg E, Van Embden JD, Willems RJ.2002. Multilocus sequence typing scheme for
Enterococcus faecium. J Clin Microbiol40:1963–1971.http://dx.doi.org/10 .1128/JCM.40.6.1963-1971.2002.
12. Morrison D, Woodford N, Barrett SP, Sisson P, Cookson BD.1999. DNA banding pattern polymorphism in vancomycin-resistant
Enterococ-cus faeciumand criteria for defining strains. J Clin Microbiol37:1084 – 1091.
13. Pinholt M, Larner-Svensson H, Littauer P, Moser CE, Pedersen M, Lemming LE, Ejlertsen T, Søndergaard TS, Holzknecht BJ, Justesen US, Dzajic E, Olsen SS, Nielsen JB, Worning P, Hammerum AM, Westh H, Jakobsen L.2015. Multiple hospital outbreaks ofvanA Enterococcus fae-ciumin Denmark, 2012–13, investigated by WGS, MLST and PFGE. J Antimicrob Chermother70:2474 –2482.
14. Willems RJ, Top J, van Santen M, Robinson DA, Coque TM, Baquero F, Grundmann H, Bonten MJ. 2005. Global spread of vancomycin-resistantEnterococcus faeciumfrom distinct nosocomial genetic complex. Emerg Infect Dis11:821– 828.http://dx.doi.org/10.3201/1106.041204. 15. Willems RJL, Top J, van Schaik W, Leavis H, Bonten M, Sirén J, Hanage
WP, Corander J.2012. Restricted gene flow among hospital subpopula-tions ofEnterococcus faecium. mBio3(4):e00151–12.http://dx.doi.org/10 .1128/mBio.00151-12.
16. Tedim AP, Ruiz-Garbajosa P, Corander J, Rodríguez CM, Cantón R, Willems RJ, Baquero F, Coque TM.2015. Population biology of intes-tinalenterococcusisolates from hospitalized and nonhospitalized individ-uals in different age groups. Appl Environ Microbiol81:1820 –1831.http: //dx.doi.org/10.1128/AEM.03661-14.
17. Lebreton F, van Schaik W, McGuire AM, Godfrey P, Griggs A, Ma-zumdar V, Corander J, Cheng L, Saif S, Young S, Zeng Q, Wortman J, Birren B, Willems RJL, Earl AM, Gilmore MS. 2013. Emergence of epidemic multidrug-resistant Enterococcus faecium from animal and commensal strains. mBio4(4):e00534 –13.http://dx.doi.org/10.1128/mBio .00534-13.
18. Maiden MCJ.2006. Multilocus sequence typing of bacteria. Annu Rev Microbiol60:561–588.http://dx.doi.org/10.1146/annurev.micro.59.030804 .121325.
19. Willems RJL, Hanage WP, Bessen DE, Feil EJ.2011. Population biology of Gram-positive pathogens: high-risk clones for dissemination of antibi-otic resistance. FEMS Microbiol Rev 35:872–900. http://dx.doi.org/10 .1111/j.1574-6976.2011.00284.x.
20. Werner G, Klare I, Witte W.2007. The current MLVA typing scheme for
Enterococcus faeciumis less discriminatory than MLST and PFGE for epi-demic-virulent, hospital-adapted clonal types. BMC Microbiol7:28.http: //dx.doi.org/10.1186/1471-2180-7-28.
21. Howden BP, Holt KE, Lam MMC, Seemann T, Ballard S, Coombs GW, Tong SYC, Grayson ML, Johnson PDR, Stinear TP.2013. Genomic insights to control the emergence of vancomycin-resistant enterococci. mBio4(4):e00412–13.http://dx.doi.org/10.1128/mBio.00412-13. 22. Reuter S, Ellington MJ, Cartwright EJP, Köser CU, Török ME,
Gou-liouris T, Harris SR, Brown NM, Holden MTG, Quail M, Parkhill J, Smith GP, Bentley SD, Peacock SJ.2013. Rapid bacterial whole-genome sequencing to enhance diagnostic and public health microbiology. JAMA Intern Med173:1397–1404.http://dx.doi.org/10.1001/jamainternmed .2013.7734.
23. Salipante SJ, SenGupta DJ, Cummings LA, Land TA, Hoogestraat DR, Cookson BT.2015. Application of whole-genome sequencing for bacte-rial strain typing in molecular epidemiology. J Clin Microbiol53:1072– 1079.http://dx.doi.org/10.1128/JCM.03385-14.
24. Maiden MCJ, Jansen van Rensburg MJ, Bray JE, Earle SG, Ford SA, Jolley KA, McCarthy ND.2013. MLST revisited: the gene-by-gene ap-proach to bacterial genomics. Nat Rev Microbiol11:728 –736.http://dx .doi.org/10.1038/nrmicro3093.
25. Cody AJ, McCarthy ND, Jansen van Rensburg M, Isinkaye T, Bentley SD, Parkhill J, Dingle KE, Bowler ICJW, Jolley KA, Maiden MCJ.2013. Real-time genomic epidemiological evaluation of humanCampylobacter
isolates by use of whole-genome multilocus sequence typing. J Clin Mi-crobiol51:2526 –2534.http://dx.doi.org/10.1128/JCM.00066-13. 26. Schmid D, Allerberger F, Huhulescu S, Pietzka A, Amar C, Kleta S,
Prager R, Preußel K, Aichinger E, Mellmann A.2014. Whole genome sequencing as a tool to investigate a cluster of seven cases of listeriosis in Austria and Germany, 2011–2013. Clin Microbiol Infect20:431– 436. 27. Bratcher HB, Corton C, Jolley KA, Parkhill J, Maiden MCJ.2014. A
gene-by-gene population genomics platform:de novoassembly, annota-tion and genealogical analysis of 108 representativeNeisseria meningitidis
genomes. BMC Genomics15:1138.http://dx.doi.org/10.1186/1471-2164 -15-1138.
28. Kohl TA, Diel R, Harmsen D, Rothgänger J, Walter KM, Merker M, Weniger T, Niemann S.2014. Whole-genome-basedMycobacterium tu-berculosissurveillance: a standardized, portable, and expandable
on May 16, 2020 by guest
http://jcm.asm.org/
proach. J Clin Microbiol52:2479 –2486.http://dx.doi.org/10.1128/JCM .00567-14.
29. Leopold SR, Goering RV, Witten A, Harmsen D, Mellmann A.2014. Bacterial whole-genome sequencing revisited: portable, scalable, and stan-dardized analysis for typing and detection of virulence and antibiotic re-sistance genes. J Clin Microbiol52:2365–2370.http://dx.doi.org/10.1128 /JCM.00262-14.
30. Antwerpen MH, Prior K, Mellmann A, Höppner S, Splettstoesser WD, Harmsen D.2015. Rapid high resolution genotyping ofFrancisella tular-ensisby whole genome sequence comparison of annotated genes (“MLST⫹”). PLoS One10:e0123298.http://dx.doi.org/10.1371/journal .pone.0123298.
31. Mellmann A, Harmsen D, Cummings CA, Zentz EB, Leopold SR, Rico A, Prior K, Szczepanowski R, Ji Y, Zhang W, McLaughlin SF, Henkhaus JK, Leopold B, Bielaszewska M, Prager R, Brzoska PM, Moore RL, Guenther S, Rothberg JM, Karch H.2011. Prospective genomic charac-terization of the German enterohemorrhagicEscherichia coliO104:H4 outbreak by rapid next generation sequencing technology. PLoS One
6:e22751.http://dx.doi.org/10.1371/journal.pone.0022751.
32. Palmer KL, Godfrey P, Griggs A, Kos VN, Zucker J, Desjardins C, Cerqueira G, Gevers D, Walker S, Wortman J, Feldgarden M, Haas B, Birren B, Gilmore MS. 2012. Comparative genomics of entero-cocci: variation inEnterococcus faecalis, clade structure inE. faecium, and defining characteristics ofE. gallinarumandE. casseliflavus. mBio3(1):
e00318 –11.http://dx.doi.org/10.1128/mBio.00318-11.
33. Qin X, Galloway-Peña JR, Sillanpaa J, Roh JH, Nallapareddy SR, Chowdhury S, Bourgogne A, Choudhury T, Muzny DM, Buhay CJ, Ding Y, Dugan-Rocha S, Liu W, Kovar C, Sodergren E, Highlander S, Petrosino JF, Worley KC, Gibbs RA, Weinstock GM, Murray BE.2012. Complete genome sequence ofEnterococcus faeciumstrain TX16 and com-parative genomic analysis ofEnterococcus faeciumgenomes. BMC Micro-biol12:135.http://dx.doi.org/10.1186/1471-2180-12-135.
34. Van Schaik W, Top J, Riley DR, Boekhorst J, Vrijenhoek JE, Schapen-donk CM, Hendrickx AP, Nijman IJ, Bonten MJ, Tettelin H, Willems RJ.2010. Pyrosequencing-based comparative genome analysis of the nos-ocomial pathogenEnterococcus faeciumand identification of a large trans-ferable pathogenicity island. BMC Genomics11:239.http://dx.doi.org/10 .1186/1471-2164-11-239.
35. Kopit LM, Kim EB, Siezen RJ, Harris LJ, Marco ML.2014. Safety of the surrogate microorganismEnterococcus faeciumNRRL B-2354 for use in
thermal process validation. Appl Environ Microbiol80:1899 –1909.http: //dx.doi.org/10.1128/AEM.03859-13.
36. Lam MMC, Seemann T, Bulach DM, Gladman SL, Chen H, Haring V, Moore RJ, Ballard S, Grayson ML, Johnson PDR, Howden BP, Stinear TP.2012. Comparative analysis of the first complete Entero-coccus faeciumgenome. J Bacteriol194:2334 –2341.http://dx.doi.org/10 .1128/JB.00259-12.
37. Altschul SF, Gish W, Miller W, Myers EW, Lipman DJ.1990. Basic local alignment search tool. J Mol Biol215:403– 410.http://dx.doi.org/10.1016 /S0022-2836(05)80360-2.
38. Bankevich A, Nurk S, Antipov D, Gurevich AA, Dvorkin M, Kulikov AS, Lesin VM, Nikolenko SI, Pham S, Prjibelski AD, Pyshkin AV, Sirotkin AV, Vyahhi N, Tesler G, Alekseyev MA, Pevzner PA.2012. SPAdes: a new genome assembly algorithm and its applications to single-cell sequencing. J Comput Biol 19:455– 477.http://dx.doi.org/10.1089 /cmb.2012.0021.
39. Katoh K, Standley DM.2013. MAFFT multiple sequence alignment soft-ware version 7: improvements in performance and usability. Mol Biol Evol
30:772–780.http://dx.doi.org/10.1093/molbev/mst010.
40. Croucher NJ, Page AJ, Connor TR, Delaney AJ, Keane JA, Bentley SD, Parkhill J, Harris SR.2015. Rapid phylogenetic analysis of large samples of recombinant bacterial whole genome sequences using Gubbins. Nu-cleic Acids Res43:e15.http://dx.doi.org/10.1093/nar/gku1196. 41. Stamatakis A.2006. RAxML-VI-HPC: maximum likelihood-based
phy-logenetic analyses with thousands of taxa and mixed models. Bioinformat-ics22:2688 –2690.http://dx.doi.org/10.1093/bioinformatics/btl446. 42. de Been M, van Schaik W, Cheng L, Corander J, Willems RJ.2013.
Recent recombination events in the core genome are associated with adap-tive evolution inEnterococcus faecium. Genome Biol Evol5:1524 –1535.
http://dx.doi.org/10.1093/gbe/evt111.
43. Li L, Stoeckert CJ, Jr, Roos DS. 2003. OrthoMCL: identification of ortholog groups for eukaryotic genomes. Genome Res13:2178 –2189.
http://dx.doi.org/10.1101/gr.1224503.
44. de Regt MJ, van der Wagen LE, Top J, Blok HE, Hopmans TE, Dekker AW, Hene RJ, Siersema PD, Willems RJ, Bonten MJ. 2008. High acquisition and environmental contamination rates of CC17 ampicillin-resistantEnterococcus faeciumin a Dutch hospital. J Antimicrob Che-mother62:1401–1406.http://dx.doi.org/10.1093/jac/dkn390.