Proceedings
Associating multiple longitudinal traits with high-dimensional
single-nucleotide polymorphism data: application to the
Framingham Heart Study
Sandra Waaijenborg* and Aeilko H Zwinderman
Address: Department of Clinical Epidemiology, Biostatistics and Bioinformatics, Academic Medical Center, Amsterdam, PO Box 22700, 1100 DE, The Netherlands
E-mail: Sandra Waaijenborg* - [email protected]; Aeilko H Zwinderman - [email protected] *Corresponding author
fromGenetic Analysis Workshop 16 St Louis, MO, USA 17-20 September 2009
Published: 15 December 2009
BMC Proceedings2009,3(Suppl 7):S47 doi: 10.1186/1753-6561-3-S7-S47
This article is available from: http://www.biomedcentral.com/1753-6561/3/S7/S47 ©2009 Waaijenborg and Zwinderman; licensee BioMed Central Ltd.
This is an open access article distributed under the terms of the Creative Commons Attribution License (http://creativecommons.org/licenses/by/2.0), which permits unrestricted use, distribution, and reproduction in any medium, provided the original work is properly cited.
Abstract
Cardiovascular diseases are associated with combinations of phenotypic traits, which are in turn caused by a combination of environmental and genetic factors. Because of the diversity of pathways that may lead to cardiovascular diseases, we examined the so-called intermediate phenotypes, which are often repeatedly measured. We developed a penalized nonlinear canonical correlation analysis to associate multiple repeatedly measured traits with high-dimensional single-nucleotide polymorphism data.
Background
Cardiovascular diseases (CVD) are associated with combina-tions of phenotypical traits, such as increased blood pressure, blood glucose, or cholesterol, and many other risk factors. These traits are in their turn caused by a combination of environmental and genetic factors. Because of the high diversity of pathways that may lead to CVD, our focus lies on the so-called intermediate phenotypes that often have a much stronger relationship with genetic markers. The disadvantage of this approach is that there are many such intermediate phenotypes, and moreover they are often repeatedly measured in patients, e.g., lipid profiles, blood pressure, and glucose. We developed a new method to associate multiple repeatedly measured phenotypical traits with high-dimensional single-nucleotide polymorphism
(SNP) data, and illustrate its use with the data sampled in the Framingham Heart Study, as provided by the Genetic Analysis Workshop 16 (GAW16).
We have previously shown that penalized canonical correlation analysis (CCA) can be a valuable tool to study the association between two high-dimensional sets of variables [1,2]. It penalizes the two datasets such that it finds a linear combination of a selection of variables in one set that maximally correlates with a linear combina-tion of a seleccombina-tion of variables in the other set, thereby making the results more interpretable.
Although CCA accounts for the correlation between variables within the same set, it neglects the longitudinal
nature of the variables. Furthermore, it does not deal well with categorical data, such as we encounter when dealing with SNP data. We adapted CCA such that it captures the correlation between the multivariate long-itudinal responses instead of the correlation between separate measurements within one set. The set with SNP variables is transformed via optimal scaling [3], such that each SNP variable is transformed into one continuous variable, which captures the measurement characteristics of the SNP. Hereafter, this set is penalized such that the number of suspected SNPs is reduced to an interpretable number. Using these approaches, we are able to extract groups of SNPs that have a high association with multiple longitudinal traits.
Methods
DataData from the Framingham Heart Study containing information about common characteristics that contri-bute to CVD, together with genetic data of about 550,000 SNPs were provided by the GAW16. Three generations were followed over a period of several years, when at regular time-points characteristics of CVD were measured.
In our analysis we focused on individuals of the offspring generation because the repeated measurements in these individuals were taken under approximately similar conditions; we considered the measurements of total cholesterol, high-density lipoprotein (HDL) cho-lesterol, triglycerides, and blood glucose, each measured four times. Furthermore, we analyzed the data of the Affymetrix 50 k chip containing 50,000 SNPs. The offspring generation exists of 2,760 individuals, with at most four measurements taken every 7 to 12 years. We only took the individuals (over the age of 17) for whom both phenotypical data and genetic data were available (2,584), and discarded the individuals with more than 5% missing SNP data (6) and individuals who attended only one exam (26). Six individuals with extremely high measures for one of the four traits were also deleted from further analysis.
Monomorphic SNPs and SNPs with a missing percentage of 5% or more were deleted from further analysis. Remaining missing data was randomly imputed once based only on the marginal distribution of the SNP in all other individuals; no assumptions were made about the variation in the imputation. We were primarily inter-ested in common SNP variants, so we grouped SNP classes with less than 1% observations with a neighbor-ing SNP-class; i.e., we grouped homozygotes of the rare allele together with the heterozygotes, if there were less than 1% homozygotes.
This research was in accordance with the Helsinki Declaration of Human Rights, compliant with the data use agreement for the Framingham Heart Study, and was approved by the local medical ethics committee of the Academic Medical Center Amsterdam (date of decision, 1 April 2008).
Penalized nonlinear CCA
Consider the n × p matrix Y, containing p (measured trait) variables, and then×qmatrix Xcontaining the q (SNP) variables, obtained fromnsubjects. CCA captures the common features in the different sets by finding a weighted linear combination of all the variables in one set that correlates maximally with a weighted linear combination of all the variables in the other set. These linear combinations are the so-called canonical variates
ωandξ, such thatω=Yuandξ=Xv, with weight vectors
uT= (u1, ...,u
p) andvT= (v1, ...,vq).
Because CCA neglects the longitudinal nature of the variables, each repeatedly measured trait is summar-ized into two measures, one representing the slope and one the intercept for each individual (see next section). Moreover, CCA cannot deal with categorical variables, therefore each SNP variable is trans-formed into one continuous variable via optimal scaling [3]. Each of the transformed variables are restricted to the measurement characteristics of the SNP. That is,
where a is wildtype, b is heterozygous, and c is homozygous. This restriction indicates that the effect of the heterozygous form of SNPjalways lies between the effect of the wildtype and homozygous genotype. To make the results more interpretable, the SNP set is penalized using univariate soft-thresholding. The cano-nical variates are optimized via the following alternating least squares algorithm (see Figure 1):
1. StandardizeY andX. 2. Set k←0.
3. Assign arbitrary starting valueω1.
4. Estimateω,ξ,vandu iteratively as follows
Repeat
(a) Obtain the transformed matrixX* by minimizing the distance betweenωˆk andX. That is, cj=(G Gtj j)−1Gtj(ωk)
j= 1,2, ...,q, withGjthen×gjindicator matrix for variablej withgjthe number of categories of variablej. Restrict cj to
(b) Compute vˆ( )k with univariate soft-thresholding,
ˆ( ) ˆ ( ˆ )
vjk =⎛ ktxj − sign ktxj
⎝⎜ ⎞⎠⎟
∗ +
∗
ω λ2 ω j= 1,2, ...,q(withf+=f
iff > 0 andf+= 0 iff≤0.) and normalize vˆ( )k .
(c) k←k + 1 (d) ξˆk ←X* (vˆk−1)
( e ) C o m p u t e uˆ( )k w i t h l i n e a r r e g r e s s i o n ,
ˆ( ) ˆ
uk =
( )
Y Yt −1ξktY and normalize ˆ( ) uk .(f) wˆk ←Y∗uˆ( )k
until uˆ( )k and vˆ( )k have converged.
Summary method for the repeatedly measured phenotypes
The four traits (total cholesterol, HDL cholesterol, triglycerides, and blood glucose levels) are log-trans-formed. Because of the linear nature of the repeated measures, for each subjectiits repeatedly measured trait
Figure 1
Penalized nonlinear canonical correlation analysis. Association between repeatedly measured phenotypes and a large number of SNPs. The longitudinal measured phenotypes are summarized into two measures, one representing the interceptYi
variables can be summarized into two measures, an intercept (b0) and a slope (b1); after correcting for the treatment effect of cholesterol-lowering drugs, according to the following model, at aget:yit=b0i+bliAge+b2itrt+
b3itrt* Age + eit, where y is the trait and trt = 0 if no treatment was taken andtrt= 1 if cholesterol treatment was taken. Hereafter, the sex-effect was removed from the eight newly obtained intercept and slope variables. The new datasetYcontains eight variables, two for each of the four phenotypical measures.
Model optimization
Optimization of the penalty parameter is determined via
k-fold cross-validation. The weight vectors u and v and the transformation functions τj per SNP variable are estimated for different penalties in the training set and validated in the validation set.
Instead of determining the penaltyl, for interpretation it is easier to determine the optimal number of SNP variables. The optimal number of variables are obtained when the mean difference between the canonical correlation of the training and the validation set is minimized, i.e., and the validation set X∗j transformed following the
transformations of the training set X∗−j.
Results and discussion
To decrease computation time, the number of SNP variables was reduced, using univariate analysis. Each of the four intercept variables were separately associated with the SNPs set using the optimal scaling method. Only the intercept variables were used because the absolute correlation between the intercept and slope of the same phenotype was at least 0.89. For each intercept variable, the top 10% of SNPs with the highest weights were selected for further analysis, i.e., SNP variables that received a high weight for any of the four intercept variables were selected. This resulted in a data set with 12,682 SNP variables.
Next we performed penalized nonlinear CCA; ten-fold cross-validation was performed to determine the optimal number of SNP variables. The optimal number of variables was the number where the canonical correla-tion of the validacorrela-tion set was closest to the canonical correlation of the training set. Figure 2 shows the effect of the number of selected SNP variables on the difference
in canonical correlation of the validation set and the training set. It shows that as the number of selected variables increased, the difference in canonical correla-tion also increased, which caused the predictive perfor-mance of the selected variables to decrease.
If the number of variables is very large, then there is a high probability that a random pair of variables has a very high correlation by chance. To identify a canonical correlation that was large by chance only, a permutation-analysis on the validation sets was performed. We permuted the canonical variate ξ (SNP variables) and kept the canonical variate ω (phenotypical variables) fixed, then the difference in canonical correlation of the permuted validation sets and the training set was determined (Figure 2).
Furthermore, we performed an additional simulation test in which we associated the actual set of phenotypical variables with a set of permuted SNP variables. For each SNP variable the observations were randomly distributed over the different subjects, then a ten-fold cross-valida-tion was performed (see Figure 2).
The difference in canonical correlation obtained from the permuted data and the simulated data were small (Figure 2), while the difference in the canonical correlation of the real data was smaller, indicating that the simulation set only contained noise data and the results of the real data were larger than would be expected by chance. Figure 2 shows a decreasing trend as
Figure 2
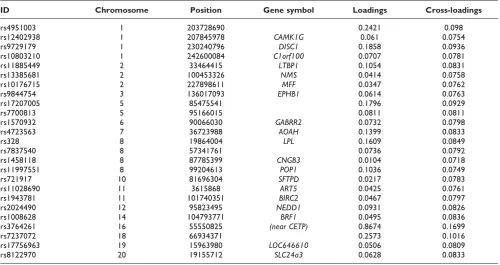
the number of SNPs decreases, with a minimum at 25 variables. Although it appears that this trend could decrease even further by minimizing the number of SNPs, we decided not to investigate this to avoid the absence of important SNPs in the final results. We performed penalized nonlinear CCA on the whole dataset, obtaining the 25 SNP variables given in Table 1. The canonical correlation of this model was 0.29.
In Tables 1 and 2 the loadings (correlation of each variable and their respective canonical variates) and the cross-loadings (correlation of each variables with their opposite canonical variate) show how the variables were associated with each other. The selected SNPs were highly associated with the HDL intercept (cross-loading: 0.1419), and had a lower association with the other variables, especially the slope variables. SNP rs3764261 highly associated with the phenotypical
variables, while all the other SNPs had comparable cross-loadings.
Conclusion
Our penalized nonlinear CCA is able to identify SNPs that are associated with repeatedly measured phenoty-pical markers. In this study two important SNPs (rs328 and rs3764261) were found that are located close to or in a gene that has been reported to be associated with HDL concentrations [4].
Although we chose to model the repeated measurements with a linear random effects model, more complex and more flexible models can be easily incorporated in our penalized nonlinear CCA. Besides the first pair of canonical variates, different pairs can be obtained using the residual matrices of the preceding canonical variate pairs.
The family structure in this study was ignored. McArdle et al. [5] noticed that ignoring the family structure mainly affects the type I error rate and not the bias of the point estimate. Because we focused on the point estimates, we expect no major changes when family structure is considered.
List of abbreviations used
CCA: Canonical correlation analysis; CVD: Cardiovascu-lar diseases; GAW16: Genetic Analysis Workshop 16;
Table 1: Selected SNPs with associating loadings
ID Chromosome Position Gene symbol Loadings Cross-loadings
rs4951003 1 203728690 0.2421 0.098
rs12402938 1 207845978 CAMK1G 0.061 0.0754
rs9729179 1 230240796 DISC1 0.1858 0.0936
rs10803210 1 242600084 C1orf100 0.0707 0.0781
rs11885449 2 33464415 LTBP1 0.1054 0.0831
rs13385681 2 100453326 NMS 0.0414 0.0758
rs10176715 2 227898611 MFF 0.0347 0.0762
rs9844754 3 136017093 EPHB1 0.0614 0.0763
rs17207005 5 85475541 0.1796 0.0929
rs7700813 5 95166015 0.0811 0.0811
rs1570932 6 90066030 GABRR2 0.0732 0.0798
rs4723563 7 36723988 AOAH 0.1399 0.0833
rs328 8 19864004 LPL 0.1609 0.0849
rs7837540 8 57341761 0.0736 0.0792
rs1458118 8 87785399 CNGB3 0.0104 0.0718
rs11997551 8 99204613 POP1 0.1036 0.0749
rs721917 10 81696304 SFTPD 0.0217 0.0783
rs11028690 11 3615868 ART5 0.0425 0.0761
rs1943781 11 101740351 BIRC2 0.0467 0.0797
rs2024490 12 95823495 NEDD1 0.0931 0.0826
rs1008628 14 104793771 BRF1 0.0495 0.0836
rs3764261 16 55550825 (near CETP) 0.8674 0.1699
rs7237072 18 66934371 0.2573 0.1016
rs17756963 19 15963980 LOC646610 0.0506 0.0809
rs8122970 20 19155712 SLC24a3 0.0628 0.0833
Table 2: Phenotypes with associating loadings
HDL: High-density lipoprotein; SNP: Single-nucleotide polymorphism.
Competing interests
The authors declare that they have no competing interests.
Authors
’
contributions
Both authors contributed equally to this analysis.
Acknowledgements
The Genetic Analysis Workshops are supported by NIH grant R01 GM031575 from the National Institute of General Medical Sciences. This research was funded by the Netherlands Bioinformatics Centre (NBIC).
This article has been published as part of BMC Proceedings Volume 3 Supplement 7, 2009: Genetic Analysis Workshop 16. The full contents of the supplement are available online at http://www.biomedcentral.com/ 1753-6561/3?issue=S7.
References
1. Waaijenborg S, Verselewel de Witt Hamer PC and Zwinderman AH: Quantifying the association between gene expressions and DNA-markers by penalized canonical correlation analysis.
Stat Appl Genet Mol Biol2008,7, Article 3.
2. Waaijenborg S and Zwinderman AH:Penalized canonical correla-tion analysis to quantify the associacorrela-tion between gene expression and DNA markers.BMC Proc2007,1(Suppl 1):S122. 3. de Leeuw J, Young F and Takane Y: Additive structure in qualitative data: an alternating least squares method with optimal scaling features.Psychometrika1976,41:471–503. 4. Willer CJ, Sanna S, Jackson AU, Scuteri A, Bonnycastle LL, Clarke R,
Heath SC, Timpson NJ, Najjar SS, Stringham HM, Strait J, Duren WL, Maschio A, Busonero F, Mulas A, Albai G, Swift AJ, Morken MA, Narisu N, Bennett D, Parish S, Shen H, Galan P, Meneton P, Hercberg S, Zelenika D, Chen WM, Li Y, Scott LJ, Scheet PA, Sundvall J, Watanabe RM, Nagaraja R, Ebrahim S, Lawlor DA, Ben-Shlomo Y, Davey-Smith G, Shuldiner AR, Collins R, Bergman RN, Uda M, Tuomilehto J, Cao A, Collins FS, Lakatta E, Lathrop GM, Boehnke M, Schlessinger D, Mohlke KL and Abecasis GR:Newly identified loci that influence lipid concentrations and the risk of coronary artery disease.Nat Genet2008,40:161–169. 5. McArdle PF, O’Connell JR, Pollin TI, Baumgarten M, Shuldiner AR,
Peyser PA and Mitchell BD: Accounting for relatedness in family based association studies.Hum Hered2007,64:234–242.
Publish with BioMed Central and every scientist can read your work free of charge
"BioMed Central will be the most significant development for disseminating the results of biomedical researc h in our lifetime."
Sir Paul Nurse, Cancer Research UK
Your research papers will be:
available free of charge to the entire biomedical community peer reviewed and published immediately upon acceptance cited in PubMed and archived on PubMed Central yours — you keep the copyright