Proceedings
Comparing gene set analysis methods on single-nucleotide
polymorphism data from Genetic Analysis Workshop 16
Nathan L Tintle*
1, Bryce Borchers
2, Marshall Brown
3and Airat Bekmetjev
1Addresses:1Department of Mathematics, Hope College, 27 Graves Place, Holland, Michigan 49423, USA,2Department of Mathematics, Rose-Hulman Institute of Technology, 5500 Wabash Avenue, Terre Haute, Indiana 47803, USA and3Department of Mathematics, Seattle Pacific University, 3307 Third Avenue West, Seattle, Washington 98119, USA
E-mail: Nathan L Tintle* - [email protected]; Bryce Borchers - [email protected]; Marshall Brown - [email protected]; Airat Bekmetjev - [email protected]
*Corresponding author
fromGenetic Analysis Workshop 16 St Louis, MO, USA 17-20 September 2009
Published: 15 December 2009
BMC Proceedings2009,3(Suppl 7):S96 doi: 10.1186/1753-6561-3-S7-S96
This article is available from: http://www.biomedcentral.com/1753-6561/3/S7/S96 ©2009 Tintle et al; licensee BioMed Central Ltd.
This is an open access article distributed under the terms of the Creative Commons Attribution License (http://creativecommons.org/licenses/by/2.0), which permits unrestricted use, distribution, and reproduction in any medium, provided the original work is properly cited.
Abstract
Recently, gene set analysis (GSA) has been extended from use on gene expression data to use on single-nucleotide polymorphism (SNP) data in genome-wide association studies. When GSA has been demonstrated on SNP data, two popular statistics from gene expression data analysis (gene set enrichment analysis [GSEA] and Fisher’s exact test [FET]) have been used. However, GSEA and FET have shown a lack of power and robustness in the analysis of gene expression data. The purpose of this work is to investigate whether the same issues are also true for the analysis of SNP data. Ultimately, we conclude that GSEA and FET are not optimal for the analysis of SNP data when compared with the SUMSTAT method. In analysis of real SNP data from the Framingham Heart Study, we find that SUMSTAT finds many more gene sets to be significant when compared with other methods. In an analysis of simulated data, SUMSTAT demonstrates high power and better control of the type I error rate. GSA is a promising approach to the analysis of SNP data in GWAS and use of the SUMSTAT statistic instead of GSEA or FET may increase power and robustness.
Background
Gene set analysis (GSA) methods of analyzing genome-wide gene expression data (DNA microarray) are increasingly popular [1-12]. GSA techniques view the statistical significance of sets of genes, instead of examining significance on a gene-by-gene basis. GSA is purported to have more power to detect subtle, but consistent, changes in expression levels than gene-by-gene significance tests of gene-by-gene expression data.
Recently, Wang et al. [13] and Chasman [14] have proposed applying GSA methods to SNP data in genome-wide association studies, providing a new method to address one of the biggest challenges facing genome-wide single-nucleotide polymorphism (SNP) studies today: namely, a lack of sufficient power to detect small effects as significant [15]. Instead of focusing only on the SNPs that are most significant as would be done in a standard analysis, GSA evaluates sets
of SNPs for significance by first associating SNPs with genes. Genes are then grouped into biologically mean-ingful sets (e.g., genes in the same cytogenetic band or pathway). Typically, many of the gene sets tested overlap (i.e., genes, and thus SNPs, are in multiple gene sets). The statistical significance of each set of SNPs/genes is then computed. In their implementation of GSA, Wang et al. [13] chose what is arguably the most popular of the GSA statistics: the weighted Kolmogorov-Smirnov-like running-sum statistic of gene set enrichment analysis (GSEA) [2,3]. However, increasing evidence in the analysis of gene expression data suggests that the GSEA statistic may not be optimal compared with other methods. Efron and Tibshirani [5], Dinu et al. [4], and Tintle et al. [12] have all argued that GSEA has less power than other test statistics. To address the shortcomings of GSEA, Efron and Tibshirani proposed the MAXMEAN statistic [5] and Dinu et al. proposed SAM-GS [4]. Tintle et al. [12] compared these methods and found that the MAXMEAN statistic provides increased power compared with SAM-GS and GSEA. Chasman [14] followed similar methods as Wang et al. [13] while also comparing GSEA to the hyper-geometric distribution/Fisher’s exact test (FET) method. Chasman [14] found that FET was more powerful for sets containing a few highly significant genes, while GSEA was more powerful for sets containing many more weakly associated genes. However, FET has been criticized by others due to a lack of robustness and low power when compared with other statistics [9,12].
Because GSEA and FET have been demonstrated to be less than optimal for gene expression data, in the following analysis we compare alternative GSA statistics (based on MAXMEAN and SAM-GS) following the general outline of the Wang et al. method [13] using SNP and phenotype (real and simulated) data available from the Framingham Heart Study as part of Genetic Analysis Workshop 16 (GAW16).
Methods
Obtaining gene sets
In general, we followed the methods of Wang et al. [13] to assign SNPs to gene sets. Approximately 550,000 SNPs were available for analysis. SNPs were screened to ensure a minor allele frequency >5%, consistency with Hardy-Weinberg equilibrium (p-value for goodness of fit test > 0.001), and less than 10% no calls. The remaining SNPs were tested for association with each of the two phenotypes of interest (diabetes and heart disease) using a standard c2 test of association. We then used the Ensembl database [16] to create a list of all known human genes. Each SNP was assigned to the gene closest to it, as long as the closest gene was within 500 kb of the SNP. Each gene was then assigned a statistic equal to the
largestc2statistic of the SNPs associated with that gene. Gene sets (assignments of genes to biologically mean-ingful groups) were then downloaded from the Broad Institute’s MsigDB [3]. Gene sets considered here are a portion of all those available from MsigDB. Specifically, we consider 306 positional (cytogenetic band) gene sets and all 396 gene sets based on the Gene Ontology’s
“molecular function”classification.
Statistical analysis
In order to evaluate the statistical significance of sets of genes, we compared the GSEA statistic used by Wang et al. [13] to three other statistics considered in the literature. To aid in the description of the different statistics, lett1,t2, ...,trrepresent thec2test statistics for each of thergenes in the gene set. In order to compute the GSEA-like test statistic we follow the method of Subramanian et al. [3] and Wang et al. [13]. In essence, the statistic is a weighted Kolmogorov-Smirnov-like running sum statistic, where the “weight” is ti for the
ith
gene. Two of the other gene set test statistics
considered were SUMSTAT ( ti i Lastly, the FET method was considered [14]. FET first classifies each gene as either “significantly associated with the phenotype” or not, and then compares the proportion of significant genes in the set of interest with the proportion of significant genes not in the set of interest using Fisher’s exact test. In order to decide if a gene was significantly associated with the phenotype, we used c2 (1 d.f.) quantiles as cutoffs (5.992, 9.210, 13.816, and 18.421) for the individual gene test statistics. Each statistic (GSEA, SUMSTAT, SUMSQ, and FET) was then computed on each gene set for each of the two phenotypes of interest. For GSEA, SUMSTAT, and SUMSQ, the observed statistics were compared with the same statistics computed on 1000 randomly selected gene sets containing the same number of genes as the set of interest. Thep-value of each set was then computed as the fraction of times the observed statistic was greater than the statistic based on the random sets. Finally, a false-discovery rate (FDR) procedure (5%) was used to adjust for multiple testing of multiple gene sets.
Sample
We selected a single person to represent each pedigree. To increase the number of cases in the sample, we selected individuals to represent a family if they had heart disease, diabetes, or were the oldest in the family (in that order of preference), leaving 730 individuals. In addition to the 6525 individuals in pedigrees, there were 227 genotyped and phenotyped individuals who were singletons. We combined all genetically unrelated individuals (730+227), leaving a total analysis sample of 957. Of the 957 individuals, 158 have ever had a heart disease diagnosis and 167 have ever had diabetes.
Results
Comparing different test statistics on Framingham Heart Study data
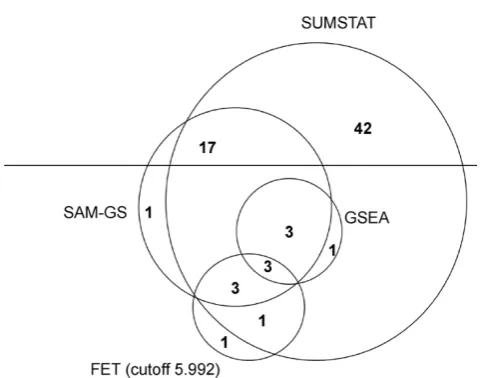
After computing thep-value of each of the 706 gene sets for each of the two phenotypes using the different statistical methods (GSEA, SUMSTAT, SUMSQ, and FET), a FDR of 5% was applied to determine significance. Overall, the SUMSTAT method identified 70 sets as significant, SUMSQ identified 27, GSEA identified 7, FET with a 5.992 cutoff identified 8, and the FET with three other cutoffs identified 0 sets as significant. As repre-sented in Figure 1, 26 of the 27 significant sets identified by SUMSQ, 7 of the 8 FET (5.992 cutoff), and all 7 of the sets identified by GSEA as significant were also identified as significant by the SUMSTAT method.
Comparing different test statistics on simulated data Because simulated phenotype data were not available for all individuals in the real data sample, in the simulated data analysis there are 876 individuals. Of these, there are 210 who have ever had a (simulated) myocardial infarction and 666 who have not. Two types of gene sets were considered in the analysis of the simulated data. First, the cytogenetic band sets and the GO-Molecular Function sets were used. Each set was identified as containing no, some weak (1-9), many weak (10+) genes, or one to two strongly associated gene. Second, pseudo-gene sets were created to contain large numbers of genes associated with the phenotype. Both the real and pseudo-gene sets were then analyzed using the same procedures as for the real data analysis. In the simulated data analysis 2000 SNPs were weakly associated with myocardial infarction or a related phenotype (e.g., high-density lipoprotein cholesterol level), while 19 were more strongly associated.
Table 1 shows that gene sets containing weakly associated genes were more likely to be identified as significant (p < 0.05; 1000 permutations) by the SUMSTAT method than by SUMSQ, GSEA, or FET with any cutoff, regardless of whether the gene sets were real or pseudo-gene sets. Pseduo-gene sets containing strongly associated genes were best identified by SUM-STAT, SUMSQ, or FET with a cutoff of 18.421. None of the methods performed well at finding major genes when there was only one or two of them in a set. We note that the optimal FET cutoff reverses when compar-ing pseudo-gene sets containcompar-ing weak or strongly associated genes. All methods controlled type I error rates for both pseudo-genes and real sets of genes.
Results of gene set analysis on Framingham data
Based on Figure 1, Table 1, and previous findings by Efron and Tibshirani [5] and Tintle et al. [12], the SUMSTAT method appears to provide the most powerful and robust results, so we only provide a detailed set of SUMSTAT findings here (Tables 2 and 3).
Conclusion
GSA offers a promising approach to genome-wide studies. Recently, Wang et al. [13] and Chasman [14] extended the GSA methodology from DNA microarrays (gene expression data analysis) to genome-wide SNP data. However, recent evidence suggests that the statistics selected by Wang et al. (GSEA) [13] and Chasman [14] (FET/GSEA) are less powerful and robust then other methods when analyzing gene expression data. In this paper we have presented evidence that this limitation also holds true for analysis of real and simulated SNP data. The SUMSTAT method found many more sets to be
Figure 1
significant than the other methods while controlling the type I error rate. The FET method was also shown to lack robustness to different types of sets (strong or weakly associated genes), an inherent limitation of an approach that requires choosing an arbitrary cutoff.
As pointed out by Wang et al. [13], the method used here to assess significance (random gene sets) is inherently biased due to assignment of the maximum SNP statistic to the gene. However, the analysis here, the results of Wang et al. [13], as well as results in other papers [12], all find that assessing significance with random gene sets provides reasonable results. In addition to the random set approach, Wang et al. [13] use a more traditional subject permutation strategy to assess significance. Goe-man and BuhlGoe-man [10] as well as Efron and Tibshirani
Table 1: Percent of sets found as significant for the simulated data
FET
5.9 9.2 13.8 18.4 GSEA SUMSQ SUMSTAT
Pseudo-gene sets
No associated genes 1.4 2.8 0.0 0.9 3.2 3.7 3.7
1-9 weakly associated genes 9.8 3.3 1.6 3.3 8.5 8.2 8.2 10+ weakly associated genes 10.6 7.7 1.9 1.9 11.5 11.5 15.4 1-2 strongly associated genes, but no weakly associated genes 0.0 0.0 5.3 0.0 0.0 0.0 0.0 Real gene sets
Many weakly associated genes 51.7 49.2 13.3 5.0 58.3 60.0 70.8 Some strongly associated genes 2.5 3.8 7.5 33.8 6.3 36.3 23.8 Null sets (no associated genes) 0.0 6.7 1.7 3.3 1.7 5.0 3.3
Table 2: The cytogenetic band sets found to be significant by SUMSTAT (FDR 5%)
Diabetes
2q34 2q36 3p14 3p26 4q22 4q32 5q14 5q23 5p14 9p24 9q21 10p14 10p15 11q21 12p12 12q23 13q12 13q22 14q13 18q12 18q21 18q22
Heart Disease
1p31 2q24 3p26 4p15 5p13 6p24 6p25 9p24 9q 9q21 10p12 10p15 12q15 18q21 18q22 20p12 21q21
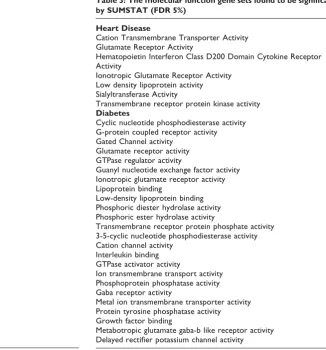
Table 3: The molecular function gene sets found to be significant by SUMSTAT (FDR 5%)
Heart Disease
Cation Transmembrane Transporter Activity Glutamate Receptor Activity
Hematopoietin Interferon Class D200 Domain Cytokine Receptor Activity
Ionotropic Glutamate Receptor Activity Low density lipoprotein activity Sialyltransferase Activity
Transmembrane receptor protein kinase activity
Diabetes
Cyclic nucleotide phosphodiesterase activity G-protein coupled receptor activity Gated Channel activity
Glutamate receptor activity GTPase regulator activity
Guanyl nucleotide exchange factor activity Ionotropic glutamate receptor activity Lipoprotein binding
Low-density lipoprotein binding Phosphoric diester hydrolase activity Phosphoric ester hydrolase activity
Transmembrane receptor protein phosphate activity 3-5-cyclic nucleotide phosphodiesterase activity Cation channel activity
Interleukin binding GTPase activator activity
Ion transmembrane transport activity Phosphoprotein phosphatase activity Gaba receptor activity
Metal ion transmembrane transporter activity Protein tyrosine phosphatase activity Growth factor binding
[5] provide clear and helpful discussions of the implica-tions of the different strategies for assessing significance in GSA.
A potential concern in GSA is the linkage disequilibrium structure of the genes in the set. GSA, as implemented for genome-wide association studies, ignores gene-gene correlation. However, as argued by Wang et al. [13], this is only an issue if the genes overlap the same linkage disequilibrium block or have an epistatic interaction. In these cases GSA will overestimate significance of gene sets.
Lastly, in the analysis presented here, sample sizes are relatively small. Larger sample sizes would increase the precision of initial SNP association tests and, thus, increase the power of the related tests. In addition to sample size, the power of tests in GSA is related to the number of genes in the gene set and the size of the shift in distribution of statistics between the genes in the set compared with those not in the set. Further work is necessary to fully explore potential modifications to the current methods of GSA in order to maximize their power in analyzing genome-wide association data.
The analysis presented here provides additional evidence that the use of GSEA for pathway-based testing in SNP genome-wide association studies is less than optimal. Using the SUMSTAT statistic in lieu of the GSEA statistic offers a promising step forward in GSA of genome-wide SNP data.
List of abbreviations used
GAW16: Genetic Analysis Workshop 16; GSA: Gene set analysis; GSEA: Gene set enrichment analysis; FDR: False-discovery rate; FET: Fisher’s exact test; SNP: Single-nucleotide polymorphism.
Competing interests
The authors declare that they have no competing interests.
Authors
’
contributions
NLT and AB helped conceive of the study and mentored BB and MB in carrying it out. BB and MB implemented and conducted all preliminary analyses. Final analyses and drafting the manuscript was done by NLT. All authors read and approved the final manuscript.
Acknowledgements
This project was funded in part by the National Human Genome Research Institute, grant number R15HG004543. The content is solely the responsibility of the authors and does not necessarily represent the official view of the National Human Genome Research Institute or the National Institutes of Health. Further, this research was supported in part
by the Tanis Fund for Statistics Research at Hope College. The Genetic Analysis Workshops are supported by NIH grant R01 GM031575 from the National Institute of General Medical Sciences.
This article has been published as part of BMC Proceedings Volume 3 Supplement 7, 2009: Genetic Analysis Workshop 16. The full contents of the supplement are available online at http://www.biomedcentral.com/ 1753-6561/3?issue=S7.
References
1. Khatri P and Draghici S:Ontological analysis of gene expression data: current tools, limitations, and open problems. Bioinfor-matics2005,21:3587–3595.
2. Mootha VK, Lindgren CM, Eriksson KF, Subramanian A, Sihag S, Lehar J, Puigserver P, Carlsson E, Ridderstrale M, Laurila E, Houstis N, Daly MJ, Patterson N, Mesirov JP, Golub TR, Tamayo P, Spiegelman B, Lander ES, Hirschhorn JN, Altshuler D and Groop LC: PGC-1alpha-responsive genes involved in oxidative phosphorylation are coordinately downregulated in human diabetes.Nat Genet2003,34:267–273.
3. Subramanian A, Tamayo P, Mootha VK, Mukherjee S, Ebert BL, Gillette MA, Paulovich A, Pomeroy SL, Golub TR, Lander ES and Mesirov JP:Gene set enrichment analysis: a knowledge-based approach for interpreting genome-wide expression profiles. Proc Natl Acad Sci USA2005,102:15545–15550.
4. Dinu I, Potter JD, Mueller T, Liu Q, Adewale AJ, Jhangri GS, Einecke G, Famulski KS, Halloran P and Yasui Y:Improving gene set analysis of microarray data by SAM-GS.BMC Bioinformatics
2007,8:242.
5. Efron B and Tibshirani R:On testing the significance of sets of genes.Ann Appl Stat2007,1:107–129.
6. Tian L, Greenberg SA, Kong SW, Altschuler J, Kohane IS and Park PJ:
Discovering statistically significant pathways in expression profiling studies.Proc Natl Acad Sci USA2005,102:13544–13549. 7. Newton MA, Quintana FA, den Boon, Johan A, Sengupta S and Ahlquist P:Random-set methods identify distinct aspects of the enrichment signal in gene-set analysis.Ann Appl Stat2007,
1:85–106.
8. Nettleton D, Recknor J and Reecy JM: Identification of differentially expressed gene categories in microarray studies using nonparametric multivariate analysis. Bioinfor-matics2008,24(b):192–201.
9. Allison DB, Cui X, Page GP and Sabripour M: Microarray data analysis: from disarray to consolidation and consensus.Nat Rev Genet2006,7:55–65.
10. Goeman JJ and Buhlmann P:Analyzing gene expression data in terms of gene sets: methodological issues.Bioinformatics2007,
23:980–987.
11. Nam D and Kim SY:Gene-set approach for expression pattern analysis.Brief Bioinform2008,9:189–197.
12. Tintle NL, Best AA, DeJongh M, Van Bruggen D, Heffron F, Porwollik S and Taylor RC:Gene set analyses for interpreting microarray experiments on prokaryotic organisms. BMC Bioinformatics2008,9:469.
13. Wang K, Li M and Bucan M: Pathway-based approaches for analysis of genomewide association studies.Am J Hum Genet
2007,81:1278–1283.
14. Chasman DI:On the utility of gene set methods in genome-wide association studies of quantitative traits.Genet Epidemiol
2008,32:658–668.
15. Amos CI: Successful design and conduct of genome-wide association studies. Hum Mol Genet 2007, 16(Spec No. 2):
R220–R225.
16. Flicek P, Aken BL, Beal K, Ballester B, Caccamo M, Chen Y, Clarke L, Coates G, Cunningham F, Cutts T, Down T, Dyer SC, Eyre T, Fitzgerald S, Fernandez-Banet J, Graf S, Haider S, Hammond M, Holland R, Howe KL, Howe K, Johnson N, Jenkinson A, Kahari A, Keefe D, Kokocinski F, Kulesha E, Lawson D, Longden I, Megy K, Meidl P, Overduin B, Parker A, Pritchard B, Prlic A, Rice S, Rios D, Schuster M, Sealy I, Slater G, Smedley D, Spudich G, Trevanion S, Vilella AJ, Vogel J, White S, Wood M, Birney E, Cox T, Curwen V, Durbin R, Fernandez-Suarez XM, Herrero J, Hubbard TJ, Kasprzyk A, Proctor G, Smith J, Ureta-Vidal A and Searle S: