Probabilistic Seismic Hazard Analysis Considering Nonlinear Soil Effects and
Variability of Soil Parameters
Bo Li1, Shun-Hao Ni2, Wei-Chau Xie3, and M. D. Pandey4
1Graduate student, Dept. of Civil and Environmental Engineering, University of Waterloo, Canada
2 Graduate student, Dept. of Civil and Environmental Engineering, University of Waterloo, Canada 3 Professor, Dept. of Civil and Environmental Engineering, University of Waterloo, Canada 4 Professor, Dept. of Civil and Environmental Engineering, University of Waterloo, Canada
ABSTRACT
This paper presents a probabilistic framework to accurately estimate ground motions at the soil surface. In this framework, the variability of soil parameters, the nonlinear property of soils, and the vector-valued seismic site responses analysis comprehensively integrate into Probabilistic Seismic Hazard Analysis (PSHA) for soil sites. Local soil conditions greatly affect ground motions propagating from bedrock to soil surface; the evaluation of ground motions at the soil surface needs to consider effects of the local soil conditions. Ground Motion Prediction Equations (GMPEs) using the generic soil to characterize local soil conditions are possible to estimate ground motions at the soil surface, but the estimation is not acceptable for critical structures because of lacking accuracy. Site amplification is used to modify the bedrock GMPEs to make them suitable for soil site. Based on the modified GMPEs, PSHA for soil sites are performed accurately and a method to construct acceptable soil UHS are proposed. Finally, this paper constructs the soil UHS for an example soil site by GMPEs and by the modified GMPEs, respectively, compares the soil UHS by the different methods, studies influences of variability of soil parameters and nonlinear property of soils on spectral shapes and spectral amplitudes of UHS.
INTRODUCTION
Hazard curves calculated from Probabilistic Seismic Hazard Analysis (PSHA) for general surficial rock condition–with shear wave velocity of the rock material greater than 750 m/sec according to U.S. Geological Survey classification criteria–should be consistent with the definition of rock for the Ground Motion Prediction Equations (GMPEs) used in the PSHA. Because the surficial shear wave velocities of Nuclear Power Plant (NPP) sites are generally less than the shear wave velocity threshold, the effects of local soil conditions on PSHA need to be considered.
In the design of NPPs, Safe Shutdown Earthquakes (SSEs) are used and represented by Design Response Spectra (DRS), such as Uniform Hazard Spectra (UHS), derived from PSHA. When incident bedrock motions propagate from bedrock to soil surface, the soil deposit changes characteristics of ground motions; the extent of this change largely depends on features of the incident bedrock motions and characteristics of the local soil deposit. Thus, differences between Uniform Hazard Spectra at soil sites (soil UHS) and Uniform Hazard Spectra at rock sites (rock UHS) are caused and governed by this change. Some empirical GMPEs (Abrahamson 1997; Campbell 2003; Boore 2008) could to be used to construct the soil UHS in the same way as constructing the rock UHS. However, they use generic soils to characterize various practical soil sites. Thus, empirical GMPEs are constrained by the ground motion data that they used to develop their attenuation relationships, and it is only appropriate to use the attenuation relationships to probabilistically estimate ground motions at the soil surface above a similar soil deposit with consideration of the effects of differences between the practical site-specific profile and the generic profile used in the estimation (ANS 2008). This requirement actually greatly restricts the usage of empirical GMPEs to construct the soil UHS.
To overcome this problem, McGuire et al. (2001) have suggested that site amplification be used to
analysis method. Tsai (2000) and Bazzurro (2004b) focused on the nonlinear property of soils in PSHA for soil sites, not considering the variability of soil parameters and the vector-valued site response analysis method.
In this paper, the variability of soil parameters, the nonlinear properties of soils, and the vector-valued seismic site response analysis method are comprehensively considered in PSHA for soil sites. Using site amplification regression model, the bedrock GMPEs are modified. The frameworks for PSHA for soil sites are presented, and a method to construct the soil UHS is proposed. Using the proposed methods in this paper, PSHA for an example site is performed, and acceptable soil UHS for the example site are also constructed.
LACAL SITE CONDITIONS
In many earthquakes, local geology and soil conditions profoundly influenced the important characteristics−amplitude, frequency content, and duration−of strong ground motions (Beresnev 1996). Extent of their influence depends on geometries and properties of the subsurface materials, topographies of the sites, and characteristics of the incident bedrock motions. Shear wave velocity, normalized shear modulus, and damping ratio are three most important parameters of subsurface materials affecting seismic site responses.
Uncertainties in geotechnical properties of soils are very common. Past research (Lumb 1996) showed that variability of soil parameters can be modeled by either normal distribution or lognormal distribution. Examples of randomized normalized shear modulus with average coefficients of variation 0.12 and randomized shear wave velocity with average coefficients of variation 0.3 are shown in Figures 1 and 2.
SEISMIC SITE RESPONSE ANALYSIS
The computer program DEEPSOIL is used to perform seismic site response analysis, which uses
Modified Konder and Zelasko (MKZ) model to characterize the nonlinear behavior of soils under
dynamic loads. To perform site response analysis, 65 seismograms from 23 different earthquakes occurring between 1971 and 2002 are selected from Pacific Earthquake Engineering Research (PEER) Center strong ground motion database.
At a specific soil site, if 𝐺𝑘 is taken as a response measure of the soil site corresponding to a vibration period𝑇𝑘, its probability is given by
𝑝(𝑔𝑘) =∫ ∫ ⋯ ∫ 𝑝−∞∞ −∞∞ −∞∞ (𝑔𝑘|𝑖𝑚1,𝑖𝑚2, … ,𝑖𝑚𝑛)𝑓𝐼𝑚1𝐼𝑚2…𝐼𝑚𝑛(𝑖𝑚1,𝑖𝑚2, … ,𝑖𝑚𝑛)𝑑𝑖𝑚1𝑑𝑖𝑚2…𝑑𝑖𝑚𝑛 (1)
where𝐼𝑚1,𝐼𝑚2, … ,𝐼𝑚𝑛are incident bedrock motion intensity measures, and 𝑓𝐼𝑚1𝐼𝑚2…𝐼𝑚𝑛(𝑖𝑚1,𝑖𝑚2, … ,𝑖𝑚𝑛)
is the joint probability density function.
SITE AMPLIFICATION
Site amplification is defined as the ratio of spectral acceleration of a ground motion at a soil surface to spectral acceleration of the ground motion at a bedrock underneath the soil surface. Site amplification plays a crucial role in the prediction of ground motions at the soil surface; local site effects on seismic site responses are evaluated by site amplification. Reference (Regnier et al 2008) showed that
site amplification of a soil site is affected by many factors: the incident bedrock motion, the shear wave velocity, the soil normalized shear modulus, the damping ratio, and the thickness of soil layers. Reference (Rogers et al 2007) also showed that the greatest influence comes from the amplitudes and frequency
contents of the incident bedrock motions.
GMPEs are valid to describe the attenuation relation of ground motions propagating from seismic sources to bedrock, but they are invalid to describe the attenuation relation of ground motions propagating from seismic sources to bedrock and then to soil surface, because the generic soil instead of site-specific soil is used in GMPEs to characterize the soil deposit sitting on bedrock. Using site amplification distribution to modify bedrock GMPEs, the modified GMPEs provide new attenuation relations valid for soil sites with modified uncertainties.
REGRESSION ANALYSIS
Using the modified GMPEs, PSHA for soil sites yields accurate results. Consider a specific soil site in a region where there are 𝑁𝑆 potential seismic sources, and take 𝑆𝑎(𝑇𝑘) as the intensity measure of
ground motions at the soil surface. For a given spectral acceleration value 𝑥𝑘 at bedrock corresponding to
period𝑇𝑘, if 𝐴𝑘 represents its site amplification, the probability 𝑝{𝑆𝑎(𝑇𝑘)≥ 𝑠𝑘} is equivalent to the
probability𝑝{𝐴𝑘 ≥𝑥𝑠𝑘𝑘}. Thus, the annual probability of 𝑆𝑎(𝑇𝑘) exceeding a specified target value of 𝑠𝑘 is 𝜆𝑠𝑘 =𝑝{𝑆𝑎(𝑇𝑘)≥ 𝑠𝑘} =
∫ ∫ ∫ 𝑝0∞ 0∞ 0∞ {𝐴𝑘 ≥
𝑠𝑘/𝑥𝑘|𝑥𝑘,pga,𝑧2}�∑ 𝜈𝑖∫ ∫ 𝑓𝑋𝑘,PGA,𝑍2 ∞
0 ∞ 0 𝑁𝑆
𝑖=1 (𝑥𝑘,pga,𝑧2|𝑚,𝑟)𝑓𝑀,𝑅(𝑚,𝑟)d𝑚d𝑟�𝑖d𝑥𝑘d(pga)d𝑧2 (3)
where PGA is the peak ground acceleration of incident bedrock motions, 𝑍2 is another intensity measure of incident bedrock motion (such as spectral acceleration averaged over the second resonant vibration period range of the soil deposit), 𝑀 is earthquake magnitude, 𝑅 is source-to-site distance, 𝜈𝑖 is the mean
annual rate of exceedance for seismic source 𝑖.
The function 𝑓𝑀,𝑅(𝑚,𝑟) represents the joint probability density function of 𝑀 and𝑅 ,
𝑓𝑋𝑘,PGA,𝑍2(𝑥𝑘,pga,𝑧2|𝑚,𝑟) is the multivariate lognormal probability density function of 𝑥𝑘, pga and 𝑧2
conditional on 𝑚 and 𝑟. Given a pair of 𝑚 and 𝑟, a vector of the natural logarithm of spectral accelerations at multiple periods have been empirically tested follow multivariate normal distribution (Jayaram and Baker 2008).
PSHA OF EXAMAPLE SOIL SITE
For a soil site at Charleston, South Carolina, 1950 random cases are generated by combining 30 random site profiles and 65 ground motions (65×30 = 1950). Computer program DEEPSOIL is used to simulate seismic site responses. Based on the simulation results, site amplification spectra are calculated, as shown in Figure 3. It can be seen that there are two resonant period ranges, 0.6 sec to 0.8 sec and 0.2 sec to 0.4 sec, corresponding to the first resonant vibration period range and the second resonant vibration period range of the soil columns, respectively.
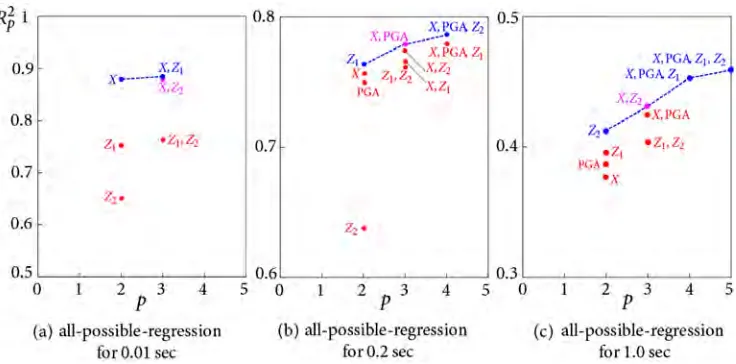
Based on the site amplifications calculated from the simulation results, site amplification regression analysis is performed. Four potential predictor variables are determined for the regression analysis: peak ground acceleration of incident bedrock motions, denoted by PGA, spectral acceleration of incident bedrock motions at the target vibration period, denoted by X, spectral acceleration of incident
bedrock motions averaged over the first resonant vibration period range (0.6-0.8 sec), denoted by𝑍1, and
spectral acceleration of incident bedrock motions averaged over the second resonant vibration period range (0.2-0.4 sec), denoted by 𝑍2. The all-possible regression (Neter et al 1996) method is used to select
the appropriate set of predictor variables, and coefficient of determination 𝑅𝑝2 of different sets of predictor
Figure 3. Site amplification for the soil site under 1950 random cases
Figure 4. 𝑅𝑝2plots for all-possible-regression of site amplifications at selected periods
Considering the total number of predictor variables used and values of 𝑅𝑝2 of different sets of
predictor variables, the set of 𝑋 and 𝑍2 is selected for periods 0.02 sec, 0.05 sec, 0.1 sec, 1.0 sec, 1.5 sec,
and 5.0 sec, and the set of 𝑋 and PGA is selected for periods 0.2 sec, 0.3 sec, 0.4 sec, 0.5 sec, 0.6 sec, 0.7 sec, and 0.8 sec. Based on the functional form proposed by Abrahamson et al. (1997) and Bazzurro
(2004b), a more accurate regression model is proposed
ln𝐴 =𝑐0+𝑐1ln𝑋+𝑐2ln PGA +𝑐3ln𝑍2+𝑐4(ln𝑋)2+𝑐5(ln PGA)2+𝑐6(ln𝑍2)2+𝜎ln 𝐴 (4)
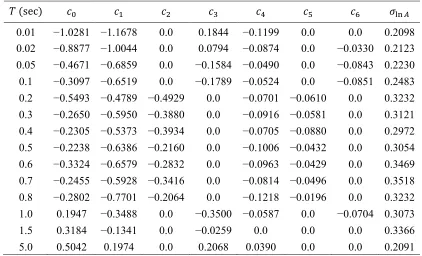
where c0, c1, … , c6 are regression coefficients, whose values are shown in Table 1, and σln A is the natural
logarithmic standard deviation of site amplification.
Using the proposed methods in this paper, PSHA for the example site is performed. First, bedrock GMPEs proposed by Boore and Atkinson (2008)–characterizing ground motions propagating from seismic sources to the bedrock underneath the soil deposit–are modified by the site amplification regression model. Then, using the modified GMPEs, PSHA for the example site are performed accurately. Two different numerical characterizations of the example site are used: base case, using deterministic
0.2 −0.5493 −0.4789 −0.4929 0.0 −0.0701 −0.0610 0.0 0.3232 0.3 −0.2650 −0.5950 −0.3880 0.0 −0.0916 −0.0581 0.0 0.3121 0.4 −0.2305 −0.5373 −0.3934 0.0 −0.0705 −0.0880 0.0 0.2972 0.5 −0.2238 −0.6386 −0.2160 0.0 −0.1006 −0.0432 0.0 0.3054 0.6 −0.3324 −0.6579 −0.2832 0.0 −0.0963 −0.0429 0.0 0.3469 0.7 −0.2455 −0.5928 −0.3416 0.0 −0.0814 −0.0496 0.0 0.3518 0.8 −0.2802 −0.7701 −0.2064 0.0 −0.1218 −0.0196 0.0 0.3232 1.0 0.1947 −0.3488 0.0 −0.3500 −0.0587 0.0 −0.0704 0.3073 1.5 0.3184 −0.1341 0.0 −0.0259 0.0 0.0 0.0 0.3366 5.0 0.5042 0.1974 0.0 0.2068 0.0390 0.0 0.0 0.2091
From these figures, we conclude that the soil-hazard curve is much higher than the rock hazard curve in medium ranges of spectral accelerations, but slightly higher or lower in high ranges of spectral accelerations. Under low to medium incident bedrock motion intensities, seismic responses of a soil deposit increase with increment of the incident bedrock motion intensities; ground motions at the soil surface are amplified, resulting in that the soil-hazard curve is much higher than the rock-hazard curve. However, under high incident bedrock motion intensities, soils exhibit nonlinear properties and yield large shear strains. The large shear strains increase soil damping ratio and reduces the intensity of ground vibrations, resulting in that the soil-hazard curve is slightly higher or lower than the rock-hazard curve.
Uniform Hazard Spectra on the Soil Surface
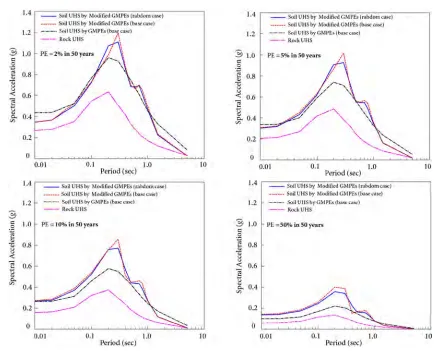
Using the seismic hazard curves at 14 controlling periods, i.e., 0.01 sec, 0.02 sec, 0.05 sec, 0.1 sec, 0.2 sec, 0.3 sec, 0.4 sec, 0.5 sec, 0.6 sec, 0.7 sec, 0.8 sec, 1.0 sec, 1.5 sec, and 5.0 sec, the soil UHS are constructed, as shown in Figure 7. Comparing the soil UHS and the rock UHS, it can be seen that their spectral shapes and spectral amplitudes are different.
Figure 5. Seismic hazard curves for PGA and 0.1 sec
Figure 6. Seismic hazard curves for 0.3 sec and 1.0 sec
Figure 7. Uniform Hazard Spectra
In addition to the variability of soil parameters, the nonlinear property of soils also affects spectral amplitudes of the soil UHS. Under medium to high incident bedrock motion intensities, as soils exhibit stiffness degradation, large soil shear strain is caused. This large shear strain further increases soil damping ratio, which at last reduces the intensity of ground vibrations. Thus, the spectral amplitudes of the soil UHS are lower than those without considering the nonlinear property of soils.
CONCLUSION
This paper presents methods to perform PSHA for soil sites. Using the proposed methods, the soil UHS at the example site are constructed. Based on the research work, we conclude that the variability of soil parameters and the nonlinear property of soils affect results of PSHA for soil sites. The variability of soil parameters and the nonlinear property of soils affect spectral amplitudes and spectral shapes of the soil UHS; therefore, the variability of soil parameters and the nonlinear property of soils are necessary to be considered in the construction of the soil UHS.
We conclude that spectral shapes and spectral amplitudes of the rock UHS are greatly different from those of the soil UHS. The rock UHS reflect characteristics of the ground motions propagating from seismic sources to bedrock, while the soil UHS reflect characteristics of the ground motions propagating from seismic sources to bedrock and then to soil surface. Therefore, these differences are caused by the effects of local soil deposit.
acceptable in practice. Because of the modified GMPEs’ capacity to predict ground motions at the soil surface more accurately than GMPEs, the soil UHS by the modified GMPEs is highly suitable for practical application, in particular for those critical facilities (such as NPPs) that require more accurate design spectra.
REFERENCES
Abrahamson, N. A., and Silva, W. J. (1997). Empirical response spectral attenuation relations for shallow crustal earthquakes. Seismological Research Letters, 68(1), 94-127.
ANS. (2008). American National Standard Probabilistic Seismic Hazards Analysis, ANSI/ANS-2.29-2008. American Nuclear Society, Illinois, USA
Bazzurro, P., and Cornell, C. A. (2004a). Nonlinear soil-site effects in probabilistic seismic-hazard analysis. Bulletin of the Seismological Society of America, 94(6), 2110-2123.
Bazzurro, P., and Cornell, C. A. (2004b). Ground-motion amplification in nonlinear soil sites with uncertain properties. Bulletin of the Seismological Society of America, 94(6), 2090-2109.
Beresnev, I. A., and Wen, K. L. (1996). Nonlinear soil response—A reality?. Bulletin of the Seismological Society of America, 86(6), 1964-1978.
Boore, D. M., and Atkinson, G. M. (2008). Ground-motion prediction equations for the average horizontal component of PGA, PGV, and 5%-damped PSA at spectral periods between 0.01 s and 10.0 s. Earthquake Spectra, 24(1), 99-138.
Campbell, K. W., and Bozorgnia, Y. (2003). Updated near-source ground-motion (attenuation) relations for the horizontal and vertical components of peak ground acceleration and acceleration response spectra. Bulletin of the Seismological Society of America, 93(1), 314-331.
Cramer, C. H. (2003). Site-specific seismic-hazard analysis that is completely probabilistic. Bulletin of the Seismological Society of America, 93(4), 1841-1846.
Jayaram, N., and Baker, J. W. (2008). Statistical tests of the joint distribution of spectral acceleration values. Bulletin of the Seismological Society of America, 98(5), 2231-2243.
Lumb, P. (1966). The variability of natural soils. Canadian Geotechnical Journal, 3(2), 74-97.
McGuire, R. K. W., Silva, J. and Constantino, C. (2001). Technical Basis for Revision of Regulatory Guidance on Design Ground Motions: Hazard- and Risk-Consistent Ground Motion Spectra Guidelines. Office of Nuclear Regulatory Research, Division of Engineering Technology
Neter, J., Kutner, M., Wasserman, W. and Nachtsheim, C. (1996). Applied Linear Regression Models. McGraw-Hill,Chicago, USA
Regnier, J., Bonilla, L. F., Bertrand, E., Duval, A. M., Beauval, C., Scotti, O., and Gehl, P. (2008, October). Variability of one-dimensional soil amplification estimates at four sites of the French permanent accelerometer network (RAP). In Proceed. 14th World Conference on Earthquake Engineering, Beijing, China.
Rogers, J. D., Karadeniz, D., and Chung, J. W. (2007). The Effect of Site Conditions on Amplification of Ground Motion in the St. Louis Area. Proceedings of the 4th International Conference on Earthquake Geotechnical Engineering, June 25-28, 2007, Thessaloniki, Greece.