ABSTRACT
STANO, KELLY LYNN. Optimizing CNT Array Growth and Functionalization for a Novel Method of CNT/Copper Composite Fabrication. (Under the direction of Dr. Philip Bradford.)
Carbon nanotubes (CNTs) are an attractive material for reinforcement in composites due to their advanced mechanical, electrical and thermal properties. While their integration into polymer matrix composites has been readily adopted and studied, techniques for producing metal matrix composites are lacking. Traditional metallurgical techniques can be complicated, time and energy consuming, and only modest property enhancement is achieved due to the inability to incorporate long, aligned, or dispersed CNTs. It is not uncommon for the resulting composite’s properties to actually be degraded due to the insufficiencies of current processing routes. This thesis demonstrates a simple and novel processing route that results in the formation of a copper matrix composite with high mass fraction, two millimeter long, aligned CNTs as reinforcement.
A low-pressure chemical vapor deposition (LP CVD) reactor was designed and fabricated in-house which allowed for precise, digital control of experimental parameters during CNT synthesis, ensuring the minimization of unnecessary variability. Vertically aligned, CNT arrays were grown using a floating catalyst CVD method known as chlorine-mediated LP CVD. Rapid throughput of large-scale arrays was made possible due to the dual catalytic activity of iron(II) chloride, which rapidly dehydrogenates acetylene while also catalyzing CNT nucleation and growth. Experimental parameters were optimized to establish a growth procedure for the consistent growth of 2-millimeter tall, high quality arrays, which would be the precursor for reinforcement in CNT-reinforced copper nanocomposites.
To ensure the structural and dimensional stability of the CNT arrays during and after composite fabrication, the effect of amorphous carbon deposition was investigated. Amorphous carbon was shown to deposit conformally on individual CNTs. This resulted in the radial growth of their diameter, as well as mechanical enhancement. The compressive strength of treated arrays increased significantly as a function of increasing deposition times. CNT arrays treated in excess of 5 minutes were found to exhibit foam-like recovery upon removal of the compressive load.
Optimizing CNT Array Growth and Functionalization for a Novel Method of CNT/Copper Composite Fabrication
by Kelly Lynn Stano
A thesis submitted to the Graduate Faculty of North Carolina State University
in partial fulfillment of the requirements for the degree of
Master of Science
Textile Engineering
Raleigh, North Carolina 2012
APPROVED BY:
_______________________________ ______________________________
Dr. Russell Gorga Dr. Yuntian Zhu
________________________________ Dr. Philip Bradford
BIOGRAPHY
Kelly Lynn Stano was born in Anchorage, Alaska on June 26, 1987 to Gene and Lynn Stano. She is the older of two children, having a younger sister, Megan. In 1995, Kelly's family moved to Little Switzerland in the mountains of North Carolina where she spent her childhood. After graduating from Mitchell High School in 2005, she enrolled at North Carolina State University to pursue a degree in Textile Engineering. In the fall of her freshman year, Dr. Russell Gorga sponsored her submission for an Undergraduate Research Award, which she won the following spring. This began a three-year tenure where she worked with many aspects of the electrospinning process in the development of polymer-carbon nanotube composite nanofibers.
In 2007, Kelly had the opportunity to travel abroad to the University of Cambridge as a Visiting Scientist where she worked in the Macromolecular Materials Group, lead by Professor Alan Windle. While there she studied the mechanical properties of carbon nanotube fibers formed via their continuous spinning technique. It was here that her fascination for carbon nanotubes was fueled, as was her desire to attend graduate school. It was also during this time that she traveled to Montpelier, France to the NT08 conference where she met Sumio Iijima, the man often credited with "discovering" the carbon nanotube!
ACKNOWLEDGMENTS
The culmination of this work would not have been possible without the support, advice and guidance of so many. I am sincerely grateful to my advisor, Dr. Philip Bradford, for providing me with this opportunity to develop as a researcher and a hopeful academic. I am so thankful for your enthusiasm and unwavering support through the ups and downs that are research.
I am also thankful for Dr. Bradford's excellent selection of group members. I could not have picked a better lab mate than Can Tang to spend all those long hours in the lab with. I am also delighted to have been able to work with Murphy Carroll over the last year. Your hard work and attention to detail was invaluable to the success of this research. I would also like to thank all of my lab members: Can, Murphy, Ozkan, Shaghayegh, Hardik, James, Omar and Victor. You all are so great; I've decided to stay 3 more years!
I would like to thank Dr. Russell Gorga, who got me started in this whole research-gig. You are a brilliant teacher and mentor, and a role model for my own teaching aspirations. Many thanks to Seth McCullen as well, for your excellent mentorship at the start of my research career, and unfailing support ever since. I would also like to thank Dr. Yuntian Zhu for serving on my committee. He and his lab group have been invaluable resources throughout this work.
There are several individuals whose assistance made this work possible, if not more enjoyable along the way. I would like to thank Josh Nowak for coming in early, even on Saturdays, to conduct 5 second long plasma treatments. You are a saint. Thank you to Dr. Marian McCord as well for allowing me to use the plasma equipment. Thanks to Chuck Mooney, Dale Batchelor, Fred Stevie, Roberto Garcia, and the rest of AIF for their characterization expertise. You all say my samples are really cool to look at, but even if you are paid extra to say that to weary graduate students, I appreciate it nonetheless. I would like to thank Dr. Julie Willoughby, Birgit Anderson, and Judy Elson for the use of and training on their equipment. Sincere thanks to Dr. Rust and the TECS department for investing in my education and development as a researcher.
Thank you, Tyler, for your unconditional love and support. I owe special thanks to my friends, Sarah, Karen, Richard, Jordan...the last two years would have been pretty boring without you all. Thank you to my thesis-writing companion, Sasha Ormond.
TABLE OF CONTENTS
LIST OF TABLES ... vi
LIST OF FIGURES ... vii
1 Introduction ... 1
2 Literature Review ... 3
2.1 Carbon Nanotube Properties ... 3
2.2 Carbon Nanotube Synthesis ... 5
2.2.1 Chemical Vapor Deposition ... 5
2.3 Carbon Nanotube Reinforced Composites ... 10
2.3.1 Carbon Nanotube - Metal Matrix Composites ... 12
2.3.2 Processing Routes for Carbon Nanotube - Copper Matrix Composites ... 14
2.4 Copper and Copper Compounds ... 34
2.4.1 Copper(II) Sulfate ... 36
2.4.2 Copper(II) Nitrate ... 39
2.4.3 Copper(II) Chloride ... 42
2.5 Wetting & Surface Tension ... 45
2.5.1 Wetting Behavior of Rough Surfaces ... 45
2.5.2 Controlling the Wetting Behavior of Carbon Nanotube Arrays ... 46
3 Experimental ... 52
3.1 Equipment Preparation ... 52
3.1.1 Construction of Low Pressure Chemical Vapor Deposition Reactor ... 52
3.1.2 Establishing Growth-Run Procedure ... 53
3.1.3 Growth Parameter Optimization ... 56
3.2 Material Preparation ... 57
3.2.1 Carbon Nanotube Array Growth ... 57
3.2.2 Post-Treatments ... 58
3.2.3 Processing of Copper Salts ... 59
3.2.4 Carbon Nanotube - Copper Composite Fabrication ... 60
3.3 Material Characterization ... 61
3.3.1 Chemical Structure Analysis ... 61
3.3.2 Micro-Structural Analysis ... 61
3.3.3 Thermal Properties Analysis ... 62
3.3.4 Mechanical Analysis ... 62
4 Controlling the Wetting Behavior of Carbon Nanotube Arrays ... 63
4.1 Background ... 63
4.2 Experimental Procedure ... 64
4.3 Results and Discussion ... 65
4.3.1 Achieving Array Wettability ... 65
4.3.2 Effect of Treatments on Carbon Nanotube and Array Structure ... 69
4.3.3 Effect of Time on Array Wetting Properties ... 75
4.4 Conclusions ... 78
5 Method for Fabrication of High Mass Fraction, Aligned Carbon Nanotube - Copper Composites ... 79
5.1 Background ... 79
5.2 Experimental Procedure ... 81
5.3 Results and Discussion ... 82
5.3.1 Effect of Amorphous Carbon Deposition on Composite Fabrication ... 84
5.3.2 Compression Properties of CVD Post-Treated Arrays and Cu-CNT Composites ... 89
5.3.3 Chemical Validation of Powdered Salt Reduction to Copper ... 93
5.3.4 Copper Content Based on Salt Properties ... 94
5.4 Conclusions ... 103
REFERENCES ... 105
APPENDIX ... 115
LIST OF TABLES
Table 2.1 Measured physical properties of hydrated and anhydrous forms of copper sulfate, chloride and nitrate [70], [71]. ... 36 Table 5.1 The measured physical properties of CNT-Cu composites during fabrication from
copper nitrate solution. Four samples were tested to compare effectiveness of amorphous carbon deposition in maintaining CNT array stability during
processing. ... 88 Table 5.2 The density and maximum specific stress were calculate for each CNT array and
CNT-Cu composites to determine the affect of amorphous carbon deposition
duration. ... 92 Table 5.3 Measured and calculated values for determination of theoretical and actual copper
LIST OF FIGURES
Figure 2.1 Number of publications on polymer, ceramic and metal matrix - CNT composites from 1997 to 2007 (taken from Bakshi et al [34]). ... 11 Figure 2.2 Number of publications on different metal matrix-CNT composites from 1997 to
2007 (taken from Bakshi et al. [34]). ... 12 Figure 2.3 Increasing the volume fraction of CNTs in Cu results in changes in composite A)
hardness and porosity and B) coefficient of friction (taken from Tu et al. [39]). ... 15 Figure 2.4 A) Micrograph showing the pull out length of Ni-coated SWNTs in a copper matrix
on a tensile test fracture surface, and B) the thermal and electrical conductivities of many common electrical contact materials (taken from C. Kim et al. [42]). ... 16 Figure 2.5 High-energy ball milled composites do not exhibit a homogenously dispersed CNTs,
instead forming A) two distinct phases, and B) two separate yield strengths (taken from Kim et al. [43]). ... 17 Figure 2.6 The microhardness and grain size of CNT reinforced Cu composites was enhanced
and consistent across the surface of the samples (taken from Li et al. [44]). ... 19 Figure 2.7 A) Table of thermal resistance values for control CNT film and CNT-Cu composite
samples and, B) SEM micrographs of composite samples before and after
compressive thermal resistance measurement (taken from Ngo et al. [46]). ... 21 Figure 2.8 SEM images of SWNT buckypaper-Cu nanoparticle bi-layer composites containing
A) 31 wt% Cu; B) 39 wt% Cu (taken from Ferrer-Anglada et al. [48]). ... 22 Figure 2.9 A) Schematic of thermal management component architecture with integrated
Cu-CNT composite; B) process flow for fabricating Cu-CNT via structure; C) electrical and thermal resistance as a function of copper content; SEM images of D) CNT via; and E) and F) Cu-CNT composite vias with different copper loadings (taken from Chai et al. [49]). ... 23
Figure 2.10 A) Crystallite size and micro-strain of SWNT-Cu composites; B) dependence of
electrical resistivity of SWNT-Cu composites and pure Cu and; C) micro-hardness of SWNT-Cu composites (taken from Yang et al. [50]). ... 24
Figure 2.11 Schematic process for Cu-MWNT composite fabrication method using
pulse-reversed electrodeposition (taken from Arai et al. [52]). ... 25
Figure 2.12 Physical properties of composites produced with electroless plated CNTs including
A) electrical conductivity; B) hardness; C) stress-strain and; D) elastic modulus and yield strength (taken from Daoush et al. [53]). ... 27
Figure 2.13 A) Schematic depicting the functionalization of CNTs and dissociation of Cu salts
Figure 2.14 Mechanical properties of CNT-Cu composites formed via molecular level mixing: A) stress-strain curves of CNT-Cu composites obtained by compression testing and; B) yield strength and Young’s modulus of CNT-Cu composites with increasing
concentration of CNTs (taken from Cha et al. [54]). ... 29
Figure 2.15 Schematic of modified molecular level mixing procedure, which utilizes gelatin
wrapping to “lock” copper ions onto the CNT surface (taken from Xu et al. [56]). .. 30
Figure 2.16 A) SEM image of CNT/Cu nanocomposites; B) EDX spectrum where the electron
beam was focused on areas a, b, and c; C) TEM image showing the embedded CNT in Cu matrix and; D) FTIR spectrum for CNT/CuO and CNT/Cu powders (taken from Kim et al. [57]). ... 32
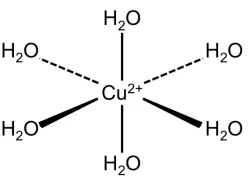
Figure 2.17 In aqueous solution, Cu2+ ions form an octahedral metal aquo complex with six water
molecules. ... 34
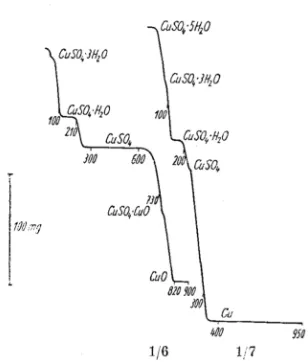
Figure 2.18 The dehydration/decomposition (left) and reduction (right) profiles of hydrated copper sulfate salts (taken from Hegedus et al. [77]). ... 38
Figure 2.19 Metallic copper film thickness as a function of deposition temperature and duration of hydrogen pulse (taken from Martensson et al. [97]). ... 44
Figure 2.20 A) FTIR spectra of MWNT arrays with various degrees of oxidation showing
oxygen-containing functional groups; B) high-resolution XPS spectra of C 1s peak of UV/ozone treated MWNT array (taken from Aria et al. [113]). ... 49
Figure 2.21 A) XPS survey scan of as-grown and treated vertically aligned CNT arrays; B) high-resolution XPS C 1s peak of as-grown and plasma treated vertically aligned CNT arrays and; C) Raman spectra of pristine and treated arrays (taken from Ramos et al. [116]). ... 51
Figure 3.1 Picture of low-pressure chemical vapor deposition reactor built in-house for
chlorine-mediated carbon nanotube synthesis. ... 52
Figure 4.1 The change in static contact angle as a function of thermal oxidation treatment.
Lower contact angles are measured for samples treated at higher temperatures and longer durations. Absence of a data point for a particular time and temperature indicates that wetting occurred. ... 66
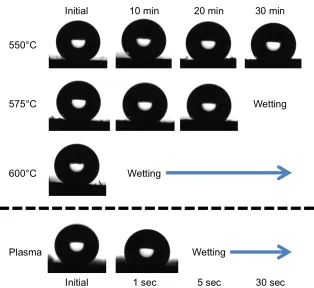
Figure 4.2 Static contact angles were measured for thermally oxidized and plasma treated CNT
arrays. Wetting was achieved at temperatures of 575°C and 600°C, but not at 550°C. Plasma treating CNTs for 5 seconds yielded wettable arrays. ... 66
Figure 4.3 XPS was used to detect chemical changes in CNT arrays before and after treatment:
A) 575°C for 30 minutes; B) 600°C for 10 minutes and; C) atmospheric oxygen plasma for 5 seconds. Oxygen was detected for both thermally treated samples, but not for the plasma treated sample. ... 67
Figure 4.4 High-resolution XPS scans of the O 1s peaks for the thermally treated samples show
Figure 4.6 Low and high magnification (left and right, respectively), SEM images of the top surface of CNT arrays: A,B) untreated; C,D) 575°C for 30 minutes; E,F) 600°C for 10 minutes and; G,H) atmospheric oxygen plasma for 5 seconds. ... 70
Figure 4.7 Raman spectra were taken for all thermally oxidized samples to analyze the changes in CNT structure. The average GI/DI ratio generally decreases as a function of
temperature and treatment time. ... 71
Figure 4.8 The kinetics of the oxidation of several carbon compounds were studied by
monitoring the CO2 evolution profile as a function of temperature (taken from Brukh
et al. [124]). ... 72
Figure 4.9 Thermogravimetric analysis (TGA) was used to compare mass loss as a function of
treatment temperature (550, 575 and 600°C), and time. ... 73
Figure 4.10 Raman spectra were taken for all plasma treated samples to determine the effect of treatment time on CNT structure. A virtually constant GI/DI ratio signifies no change
in defect density. ... 74
Figure 4.11 Raman spectra were collected to compare average GI/DI ratios for all treatments that
successfully yielded a wettable CNT array. ... 75
Figure 4.12 CNT array wettability achieved via plasma treatment will last for 72 hours if left exposed to atmosphere. The measured contact angle after 72 hours was 143°, only 3° lower than the pristine array before treatment. ... 76
Figure 4.13 Raman spectra taken before plasma treatment (horizontal grey line), are compared to spectra taken after treatment as a function of time. The GI/DI ratios increase linearly
over 72 hours, when hydrophobicity was restored to the array. ... 77
Figure 4.14 Raman spectra taken before thermal oxidation treatment (horizontal grey line), are compared to spectra taken after treatment as a function of time. The GI/DI ratios
remain unchanging after 72 hours of testing. ... 77
Figure 5.1 Pristine and CVD post-treated arrays were dipped in pure DI water to show the
effects from surface tension and capillary forces on the physical morphology of the sample. Both samples were destroyed by capillary drying forces. ... 83
Figure 5.2 After amorphous carbon CVD an opaque black film formed on the inner and outer
tube walls of the LP CVD reactor (A). Analysis of the Raman spectrum of the film scraped from the tube wall revealed the presence of graphitic C-C bonding (B). ... 84
Figure 5.3 Cross-section SEM micrographs of A) pristine CNT array and, B) CNT array with 30 minutes of CVD amorphous carbon deposition. ... 85
Figure 5.4 Linear relationships between mass of deposited amorphous carbon (left axis) and
array density (right axis) as a function of treatment duration. ... 86
Figure 5.5 Raman analysis of CNT post-treated arrays as a function of deposition time. The ratio of graphitic signal to disorder (GI/DI), decreased from 1.99 for a pristine array to 0.97
for an array treated for 60 minutes. ... 86
Figure 5.6 CNT arrays with varying amounts of amorphous carbon deposition: A) 60 min; B) 30
min; C) 5 min and; D) 0 min (pristine array), after dipping in supersaturated
Figure 5.7 The effect of amorphous carbon deposition is evident throughout all steps of
composite fabrication: wetting, drying, dehydration, and reduction. ... 88
Figure 5.8 An Instron operating in compression mode was used to measure the mechanical
properties of arrays treated with amorphous carbon as well as Cu-CNT
composites. ... 89
Figure 5.9 Values for density were calculated based on array volume and weight after CVD
treatment and composite fabrication. Array density varied as a function of CVD treatment time and copper content. ... 90
Figure 5.10 The compression properties of CNT arrays treated were measured as a function of A)
amorphous carbon deposition time, and B) combined amorphous carbon deposition and copper content. ... 90
Figure 5.11 Comparison of compression stress-strain curves for CNT arrays with and without copper and amorphous carbon. ... 92
Figure 5.12 EDS spectra and accompanying SEM micrograph insets for the three processing steps for copper(II) nitrate: A) hydrated salt, B) copper oxide, and C) metallic copper. .... 94
Figure 5.13 Copper composites were fabricated using a modified molecular level mixing processing route using Cu(NO3)2, CuSO4, and CuCl2 as precursors. Images were
taken after drying (left), and hydrogen reduction (right). ... 95
Figure 5.14 A Cu-CNT composite made from copper(II) nitrate was characterized with SEM. Micrographs show A) cross-section with low magnification inset and;
B) top surface. ... 98
Figure 5.15 A Cu-CNT composite made from copper(II) sulfate was characterized with SEM.
Micrographs show A) cross-section with low magnification inset and;
B) top surface. ... 98
Figure 5.16 A Cu-CNT composite made from copper(II) chloride was characterized with SEM.
Micrographs show A) cross-section with low magnification inset and;
B) top surface. ... 99
Figure 5.17 SEM micrograph taken using a back-scattered electron (BSE) detector. Bright areas
correspond to high Z elements (copper), while low contrast corresponds to low Z elements (carbon). ... 100
Figure 5.18 SEM micrographs of A) large copper structure with highlighted areas of copper
coated CNTs and CNT bundles, and B) fibrous copper-CNT structures. ... 101
Figure 5.19 EDS spectra taken from the top surfaces (A, C, E) of each composite (nitrate, sulfate
1
Introduction
Contrary to popular belief, the existence of carbon nanotubes (CNTs) predates the 20th
century by millennia. In fact, scientists have found naturally occurring CNTs in prehistoric glacial samples [1] and also synthetically produced CNTs in the tail pipes of cars [2]. The first evidence of their formation in a controlled environment dates back to the 1950s [3], [4] and 1970s [5], [6], but the microscopy capabilities for imaging these revolutionary particles were limited. Following Iijima's infamous characterization of the “helical microtubules of graphitic carbon” in 1991 there has been an explosion of research activity [7]. Since then, interest in this field has grown exponentially, with 7000 papers being published in 2006 alone [8]. The reason for the intense activity stems from the extraordinary physical properties of CNTs. Not only do they exhibit great strength, stiffness and toughness [9–11], but they also possess metal-like electrical conductivity [12], [13], and thermal conductivity superior to metals [14], [15]. All of this combined with their ultra-low density makes CNTs an attractive reinforcement in composite matrices for a wide variety of applications.
The realization today however, is that CNTs have not yet begun to demonstrate their full potential in terms of material enhancement. The causes of this shortcoming lie in the difficult tasks of CNT production as well as processing. In order for CNTs to be a viable reinforcement in composite materials, a synthesis method that rapidly produces massive quantities of high-quality CNTs must be used. With their large aspect ratios, CNTs exhibit high anisotropy of physical properties along their axis. Therefore, this growth method must also be capable of producing long, vertically aligned arrays for their properties to be best utilized. The benefit of using arrays in composites is two-fold in that it also addresses the issues of bundling and agglomeration, which are common in all areas of CNT processing. Relative to CNT powders, there is great potential for the use of aligned CNT arrays as a reinforcement phase in composites, but there is also a shortage of work in this area. This thesis describes research relating to the synthesis and functional enhancement of CNT arrays, as well as the development of composite fabrication techniques utilizing the arrays while maintaining their delicate alignment and superior physical properties.
possible sources of variation were kept to a minimum while allowing maximum customization of experimental parameters. A thorough characterization of produced CNT arrays is also reported.
Pristine CNT arrays must be treated post-growth in order to best prepare them for eventual incorporation into composite materials. Without post-treatment CNT arrays are fragile and difficult to wet due to their high surface roughness. In the field of composites, mutual wetting of phases is crucial for establishing an effective interface for energy transfer. In Chapter 4, methods for manipulating the surface properties of the CNT arrays to allow for wetting were investigated. Various procedures for creating hydrophilic arrays are demonstrated and characterized to determine the side effects on CNT structure.
2
Literature Review
2.1
Carbon Nanotube Properties
Carbon nanotubes (CNTs) are widely regarded as being a material that will change the face of an untold number of technologies. Researchers studying catalysis, composites, tissue engineering, energy harvesting and storage, nanofluidics and even sensors for detecting the ripeness of fruit have been inspired by their superior physical properties and recognize their impact potential.
The superior properties of CNTs can be directly extracted from chemical structure and bonding. The carbon atom, with an electron configuration of 1s22s22p2, has four valence electrons in
its available for bonding. When two atoms' electrons come sufficiently close and are mutually stabilized, covalent bonding will occur. This bonding can take several forms, dependent on whether these electrons occupy the sp3 (diamond), sp2 (graphite), or sp (acetylene) orbital. In the case of graphite, an electron from the 2s shell is promoted to and combined with two of the 2p orbitals to form three sp2 orbitals and one unhybridized, delocalized p orbital. The three sp2 orbitals are in the
same plane with an equal spacing of 120° between them, and the p orbital is situated perpendicular to the plane.
Each sp2-hybridized atom combines with three other sp2-hybridized carbon atoms, thus forming the familiar hexagonal arrangement in parallel planes. The delocalized π electrons can readily move from one side of the plane to the other, but cannot move between adjacent planes. These delocalized electrons are what account for the enhanced electrical and thermal conductivity of graphite over diamond, which is electrically insulating and has four σ bonds. This is also the basis for the anisotropy of physical properties that is seen in sp2-bonded materials. The covalent bonds formed
between the atoms are strong due to the large amount of overlap allowed by the lopsided-shaped sp2 orbital, and also due to the small size of the carbon atom.
Rolled sheets of sp2-bonded graphite comprise CNTs. Whereas graphite planes have perfectly symmetrical π delocalization, the rolled morphology exhibited in CNTs causes the π orbitals to deform, due to quantum confinement. This causes rehybridization of sp2 towards sp3, thus
delocalizing the electrons outside the tube surface even more. This is what gives CNTs their enhanced electronic, thermal and reactive properties over graphite.
number of walls has some effect on the resulting physical properties. Due to the decreased likelihood for bonding defects, SWNT and DWNTs generally have more desirable properties, though realistically they are more difficult to produce and process.
One additional parameter that can influence the properties of CNTs is their rolling structure, or chirality. The chirality of a CNT can be identified by a set of two integers (n, m) that correspond to graphite vectors. By rolling the graphite sheet in different directions, different nanotubes can be obtained: zigzag (n>0, m=0), armchair (n=m), or chiral (n>m>0). Zigzag and chiral tubes are both semiconductors while armchair are metallic. This is attributed to the highly regular quantum confinement and thus electron delocalization exhibited by armchair CNTs. Until recently, little was understood about how to control the chirality of CNTs. There has been some recent success in the synthesis of armchair (thus metallic) SWNTs [16], [17]. There is little extrapolation of this work to the growth of MWNTs because of their added complexity of many walls. Due to the mixed chirality of the concentric walls, MWNTs are semiconducting.
Due to the highly regular structure of CNTs and their small size, they exhibit ballistic conduction of electrons along their length. Very small concentrations of CNTs can be added to non-conducting matrices to achieve percolation, thus enhancing electrical conductivity. Additionally, due to their high thermal conductivity, increasing heat does not as drastically affect the electronic transport properties as it would in other conductors.
Though difficult to achieve experimentally, theoretical calculations predict values for thermal conductivity as high as 6000 W/mK [15]. This result is due to a combination of factors: 1) the high axial stiffness allows for a high velocity of phonon modes, 2) the highly confined 1D structure restricts the space for phonon-phonon (Umklapp) collisions, and 3) the highly perfect atomic structure minimizes the likelihood of elastic phonon scattering due to defects. Because the conduction mechanism is lattice and vibration based as opposed to metals that rely on valence electrons to transfer heat energy, the thermal conductivity of CNTs does not significantly degrade with increasing temperature. Additionally, due to the potential for dual conduction mechanisms, there is significant interest in developing a CNT-Cu composite material for advanced heat dissipation. This topic will be discussed in greater detail in Section 2.3 of this thesis.
analyzing the thermal vibrations of a single cantilevered MWNT the Young’s modulus was measured to be 1.0 to 1.8 TPa [9]. A more realistic test that actually pulled and bent individual CNTs yielded more conservative values. The modulus and strength were measured to be 0.8 and 150 GPa respectively [18]. MWNTs are considered to be weaker in tension compared to SWNTs because of slippage and pullout of the concentric walls, but due to their relative ease of synthesis, they are generally the reinforcement of choice for composites researchers.
2.2
Carbon Nanotube Synthesis
There are many methods by which carbon nanotubes can be grown, and depending on the desired application there are benefits to each method. Arc discharge and laser ablation tend to produce CNTs with fewer structural defects. A result of this is very consistent material that has predictable properties as well as great structural integrity. On the other hand, metal catalyzed chemical vapor deposition (CVD) is capable of producing large quantities of CNTs, though they may not be as pristine as those grown by other methods. As CVD is the method used in this research, the details of the method will be discussed further.
2.2.1
Chemical Vapor Deposition
Chemical vapor deposition (CVD) is a highly utilized synthesis technique in modern industrial and research processes. It has been around for over a century, with its pioneering application to improve the strength of incandescent bulb filaments through carbon or metal coatings [19]. Since then it has found many applications in an array of disciplines due to its ability to deposit a variety of materials including metals, non-metals like carbon and silicon, and even carbides, nitrides and oxides.
through the boundary layer. Nearly all CVD methods use a quartz tube and tube furnace as the reactor. The furnace must have precise temperature control over a considerable length of the tube. The method can be used at atmospheric or low pressure, and the method will dictate the nature of the set-up. Mass flow controllers are used to precisely monitor and control the flow of growth and reactive gases.
In this process, deposition of solid material occurs as a result of a chemical reaction, which takes place in the vapor phase. The possible types of chemical reactions are as varied as the materials the CVD process can produce. They include thermal decomposition or pyrolysis, reduction, hydrolysis and many others. In the case of CNT synthesis, the pertinent chemical reactions are generally thermal decomposition of hydrocarbons or disproportionation of carbon monoxide, although there are many other less prominent methods. The latter is primarily used for the synthesis of SWNTs and will not be discussed in this review of literature.
2.2.1.1
Chemical Vapor Deposition of Carbon Nanotubes and Arrays
As previously mentioned, CNT of CNTs is unique because it allows for controlled or patterned growth of various CNT structures. In a typical growth run a substrate (usually silicon or quartz), is loaded into a quartz tube and the system is purged to remove atmospheric impurities. Then the furnace is ramped to a desired temperature, at which point the carbon feedstock is flowed into the system to react with a catalyst. The reaction is allowed to continue for the desired amount of time. Then the tube is once again purged to remove leftover growth gases, and cooled to room temperature. Catalysts that can be used for CNT synthesis include Fe, Ni, Co and Mo. Common carbon sources include CO, methane, ethane, acetylene and ethylene.
Floating catalyst CVD is thought to be a viable route for the scale-up of CNT growth because it allows for the continuous feeding of catalyst particles or compounds through the feedstock. Sen et al. [24], first demonstrated this method with the pyrolysis of benzene in the presence of metallocenes such as ferrocene, cobaltocene, and nickelocene to form MWNTs. At high temperature the metallocene vaporizes to leave behind metal nanoclusters. The size of the cluster will ultimately depend on the thermodynamic conditions inside the reactor. Smaller clusters are unstable and will quickly evaporate while larger ones will break apart until an equilibrium size has been met [25]. Control and understanding of this method is limited, but tunable process parameters include temperature and residence time, which is influenced by gas flow rate and feedstock injection rate.
A typical growth using either catalyst approach would result in the synthesis of a tangled web of carbon nanotubes, each extending from its respective catalyst particle. As an individual CNT grows longer, it can no longer support its own weight without buckling and falling over. Alternative morphologies, such as vertically aligned forests, are possible however. Just as the thickness of the catalyst and buffer layers affects particle size, it also affects the nucleation density and spacing of the particles on the substrate. At an optimized spacing the CNTs will grow upward and be mutually supported by surrounding CNTs, preventing them from falling back onto the substrate. The resulting structure can grow millimeters tall before termination, and has a variety of properties that make it an attractive material for researchers.
Due to their aligned nature, arrays can be processed in unique ways to alleviate some common issues in their utilization. In this morphology, the array is relatively fixed so that the anisotropic properties can be exploited without losing alignment. For example, arrays can be infiltrated with liquids [26] or polymers [27] while still in their aligned state. This greatly reduces the propensity of the CNTs to agglomerate and form bundles. This in turn allows for the fabrication of high volume fraction composites. Only in high concentrations will the potential of CNTs become a reality. More recently, CVD methods have been developed which allow for one-step growth of larger samples [28]. In chlorine mediated CVD (CM-CVD), the time-involved steps of buffer and catalyst layer deposition are replaced with a one step method. As this is the specific synthesis method used, it will be discussed in greater detail below.
2.2.1.2
Chloride Mediated Chemical Vapor Deposition of Carbon Nanotube Arrays
in the gaseous phase. This can be completed at relatively low temperatures (500°C), which is below the thermal decomposition temperature of FeCl2.
The first instance of FeCl2 being used for CNT growth was in 2004 [29], although iron(III)
chloride was used as a floating catalyst for large-scale, aligned CNT growth previously [30]. FeCl2
has also been used as a catalyst for the growth of "moustache-like" carbon fibers [31]. In this experiment FeCl2 powders were heated to 500°C in argon. After 15 minutes, acetylene was
introduced in the chamber and allowed to react for 40 minutes. SEM and TEM characterization showed the formation of fibers that were typically 10-100 microns long and 0.1-1 micron in diameter. Interestingly, each fiber had an iron-rich "belt" around its middle, which was easily removed with heat treatment.
The group found that excessive amounts of FeCl2 vapor saturated the reaction atmosphere
and limited the reaction with carbon. Additionally, excessive carbon suffocated the catalyst and caused premature termination of growth. Though inconclusive, the origin of the Fe rings was thought to be due to the direct reaction of FeCl2 (foiled hexagonal solid) with carbon radicals to form iron
(cubic crystal) and chlorine (as chloro-carbons).
The translation of this process from atmospheric pressure to vacuum yielded significant improvements in the regulation of relative FeCl2 - carbon concentrations. Inoue et al. [28]
demonstrated the rapid (0.1 mm/min), growth of large-scale, aligned CNT arrays using only FeCl2
and acetylene. The catalyst was heated to 820°C and vaporized in a quartz tube under vacuum. In this step, the catalyst vapor is constantly colliding with and depositing on surfaces within the chamber. The deposition is temporary in vacuum however, and it immediately re-evaporates. This cycle continues until the growth gas, acetylene, is released causing the condensation of Fe-containing particles on all heated surfaces. Acetylene flow was managed using a mass flow controller, and the pressure was maintained at 10 Torr. Growth was allowed to continue for 20 minutes, which yielded 2.1 mm tall arrays. TEM characterization showed that the CNTs formed were MWNTs with diameters of 30 - 50 nm. Decreasing the growth pressure from 10 Torr to 4 Torr did not change the length of the arrays, but they were attached less strongly to the quartz substrate. Arrays grown at 4 Torr could be spun into macroscopic yarns using tweezers.
substrates. These arrays can be harvested, and subsequently customized and post-treated for a variety of applications. Due to the elimination of time-consuming pre-deposition steps and quick growth time, CM-CVD is considered to be a viable option for economical mass production of CNT arrays.
In this method, FeCl2 powder was used both as a catalyst for nucleation, but also propagation
of CNT growth. At the growth temperature of 760°C, the catalyst is completely vaporized. When acetylene is let into the reactor, the following reaction takes place:
FeCl2 + C2H2 -> FeC2 + 2HCl (1).
The low vapor pressure of FeC2 allows for vapor phase collisions to take place until it collides with
the surface of the quartz where a catalyst nanoparticle forms. The morphology of FeC2 particles was
characterized by Kosugi et al. [32]. In their work, the reaction produced Fe nanocrystals with a carbon skin. Independent of the size of the Fe nanoparticle, the carbon skin that formed around the particle measured 3.5 nm. The presence of the characteristic 002 graphite peak confirmed that the carbon skins had a graphitic structure which grew parallel with the iron lattice axis.
Interestingly, the group also found that the carbon skin is valently bonded to the iron particle. Due to the similarity in Fe-Fe and C-C bonding in graphitic structures, (2.866 Å and 2.842 Å respectively), there was “accidental matching” which allowed for the growth of the graphitic plane. This coincidence is unique for the graphitic carbon and iron system as it does not occur in cobalt or nickel systems which are common catalysts used in CNT growth [32].
At high temperatures iron nanoparticles are liquid and carbon is free to migrate through the iron structure. As more carbon is added to the system, the graphitic layers form on the outside of the particle. As more layers form, the innermost layers apply pressure to the catalyst particle due to the constraining volume, and the metal particle is eventually expulsed from the newly formed graphitic tube [33]. This represents the initiation of growth of the CNTs. The segregation of the graphene layers from the Fe particle is shown in the following reaction:
FeC2 -> FeC2-x + xC (2).
The formation of graphene layers continues as the catalyst reacts with acetylene. When the carbon concentration in and around the catalyst particle falls below a certain threshold, growth is terminated. Periodic changes in the carbon concentration within the iron catalyst particle results in changes of the inner diameter of the MWNT. By keeping the carbon concentration consistent throughout the growth process, more consistent CNTs can be grown.
Additionally, remaining iron(II) chloride vapor in the system as well as the reaction-produced HCl can react with iron nanoparticles according to the following reaction:
Fe + 2HCl -> FeCl2 + H2 (3).
Then, acetylene will be rapidly decomposed at the nanoparticle surface. The reaction takes place as follows:
FeCl2 + C2H2 - > FeC2 + 2HCl (4).
Here again, carbon will rapidly segregate and form graphene layers on the catalyst particle, following Equation 2 from above. This cycle is thought to repeat quickly, resulting in the rapid growth of ultra long CNTs. It is easy to see how the rate of growth would be greatly decreased without the added catalyst activity provided by the FeCl2.
2.3
Carbon Nanotube Reinforced Composites
Composite materials, which can be naturally occurring or man-made, comprise two phases - the matrix, and the filler or reinforcement. Composites are classified by the type of material used for the matrix: polymer (PMCs), ceramic (CMCs) or metal (MMCs). The reinforcement material is chosen based on the desired application or material performance. These could include strength, stiffness, thermal or electrical conductivity, wear resistance, toughness and many others. In an ideal scenario the separate phases will work together synergistically to yield an enhanced multifunctional composite.
Figure 2.1 Number of publications on polymer, ceramic and metal matrix - CNT composites from 1997 to 2007 (taken from Bakshi et al [34]).
The reasons for this are varied. Most current CNT synthesis techniques must strike a balance between high throughput capacity and CNT purity and quality. Techniques that satisfy both criteria are limited, thus making large amounts of high quality CNTs expensive. CNTs are also notoriously difficult to process due to their surface properties. Chemically inert C-H bonds cover the outermost wall creating a non-reactive interface between the matrix and reinforcement phases. Additionally, C-H bonds are strongly hydrophobic which makes mutual wetting of the two phases difficult [35–37].
The large specific surface area of CNTs (>200 m2/g) certainly makes them attractive for
many applications, but their large aspect ratios also create strong van der Waals attractions between adjacent tubes. This leads to bundling and agglomeration of CNTs, which is extremely difficult to reverse without causing damage to the structure. The inhomogeneous dispersion of reinforcement within a matrix creates stress concentrations, which diminish mechanical enhancement, often yielding a composite even weaker than the starting material. This concept applies to electrical and thermal enhancement as well.
2.3.1
Carbon Nanotube - Metal Matrix Composites
Metals and their alloys have dominated the structural landscape for decades but increasing energy demands and declining oil supplies have motivated researchers toward developing lighter structural materials. Compared to PMCs, metals and their composites have superior high temperature stability, excellent thermal and electrical conductivity, and are impenetrable to laser, UV and nuclear radiation.
Early development of MMCs combined ductile but strong metals with a stiff reinforcement material. The resulting composite possessed both strength and stiffness while also decreasing density. These materials are employed today in the automobile and aerospace industries where they have increased both payload capacity and fuel efficiency. Composites with low coefficients of thermal expansion (CTE) and high thermal conductivity are attractive for electronics packaging and thermal management applications.
Figure 2.2 Number of publications on different metal matrix-CNT composites from 1997 to 2007 (taken from Bakshi et al. [34]).
Cu-powder metallurgy, electrochemical deposition, thermal spraying, melt processing, as well as more novel techniques such as molecular level mixing, sputtering, CVD, and nanoscale dispersion via ultrasonication.
There are three main challenges associated with processing CNT reinforced MMCs, and the degree to which these challenges are overcome vary with each method. First, a homogenous dispersion of CNTs in the metal matrix must be achieved and maintained in the final product. Inhomogeneous structures, which are caused by CNT agglomeration, create porosity and discontinuity in a composite. They result in stress concentrations and act as barriers to electrical and thermal energy transfer throughout the bulk. Another processing challenge is controlling interfacial bonding between the metal matrix and CNT reinforcement. Dujardin et al. found that CNTs could be wet by substances that have low surface tension, with an upper limit of 200 mN/m [38]. Copper, with a surface tension of 1270 mN/m, will not naturally wet the surface of CNTs, so alternate routes for promoting wetting between composite phases must be investigated. Lastly, the chemical and structural stability of CNTs must be maintained during composite processing. In air excessive temperature causes oxidation of the CNT walls, which greatly degrades physical properties. Processing routes must minimize this potential in order to achieve material enhancement.
2.3.2
Processing Routes for Carbon Nanotube - Copper Matrix Composites
2.3.2.1
Powder Metallurgy
Powder metallurgy is the oldest and most-used MMC processing route. At the most basic level, it is the conversion of metal powders to densified solid through the use of heat and pressure. To make a composite, the matrix and reinforcement materials must be intimately blended which is often accomplished via simple mixing or ball milling. Once mixed, a precise amount of powder is either hot or cold compacted into a die of the desired shape. The resulting sample is partially densified, but must undergo further processing to remove unwanted porosity. Common consolidation techniques include conventional sintering, hot pressing, spark plasma sintering and deformation processing.
Conventional sintering is the most basic method, relying on thermal energy to encourage atomic diffusion and surface tension to bond adjacent metal particles. Care must be taken when using this method to prevent sample oxidation and grain growth; both of which degrade material properties. The same is true of hot pressing, as it also requires heating to consolidate the sample. Hot pressing equipment simultaneously heats the sample while also applying pressure. Again, the process must be carried out in vacuum or inert atmosphere to prevent sample oxidation. Spark plasma sintering (SPS) was developed more recently as a method to quickly heat the powder particles. Instead of using electrically resistive coils, induction or radiation to heat the sample (as in sintering or hot pressing), a DC current is pulsed through the powder sample. Rapid heating occurs due to electrical spark discharge between particles. Heating rates up to 1000K/second are achievable using this method, making it more desirable to prevent grain growth as well as sample oxidation. Deformation processing includes hot and cold rolling, and extrusion. These methods apply shear force to the composite sample inducing grain refinement while also decreasing density. Additionally, due to the large shear forces applied during processing, the shell structure of the CNT clusters is disrupted and CNTs are aligned in the direction of shear. Because of this, good mechanical properties can be expected from composites formed in this manner.
15
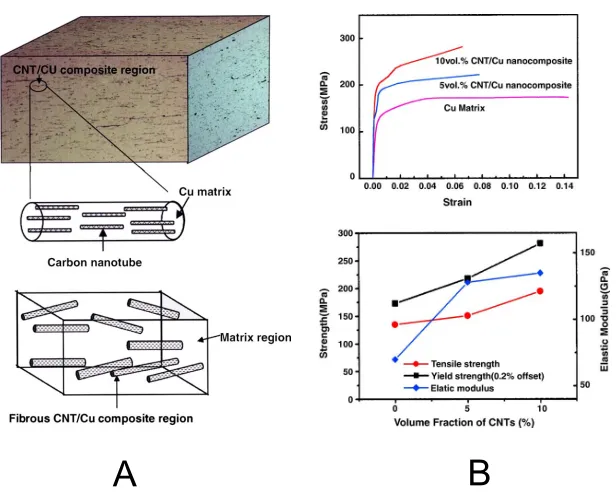
Control of material and process parameters affects the quality of the blend. By starting with smaller metal particles, a more homogenous blend can be achieved, but there are increased health risks associated with small diameter particles as well as increased potential for oxidation. Therefore, researchers have adopted more novel methods to promote bonding including the coating of CNTs [39–41]. Using electroless plating, CNTs were first coated with Ni before being ball milled with Cu powder and consolidated via pressing and sintering. This was said to improve the bonding strength between matrix and reinforcement. Five samples were made with increasing concentrations of CNTs (0, 4, 8, 12 and 16 vol%), and Cu powder (particle diameter 70µm) by mixing for 30 minutes in a ball mill. The powder mixtures were pressed at 600 MPa and 100°C, and then sintered for 2 hours at 800°C. The porosity, hardness, coefficient of friction and wear rate of the samples were characterized. It was determined that the porosity of the composites remained stable at lower volume fractions, but then increased at 12 vol% CNTs. This was attributed to CNT clustering and agglomeration. Because of this the hardness of the composites first increased within increasing volume fraction, and then decreased above 12 vol% CNTs. Conversely, the coefficient of friction and wear rate both decreased initially, and then increased with higher concentrations of CNTs. The results from these experiments can be seen in Figure 2.3.
Figure 2.3 Increasing the volume fraction of CNTs in Cu results in changes in composite A) hardness and porosity and B) coefficient of friction (taken from Tu et al. [39]).
226 J.P. Tu et al. / Tribological properties of carbon nanotube composites
Figure 1. TEM images of CNTs: (a) after purification and (b) after plating electroless nickel film.
fabricated by the powder metallurgy (PM) technique. The powders of copper- and nickel-coated CNTs were mixed for 30 min in a ball mill. After mixing, the powder mixtures were isostatically pressed at a pressure of 600 MPa at 100◦C for 10 min under vacuum (10−2 Pa), and then isothermally sintered at 800◦C for 2 h. Bulk hardness of the compos-ites was measured using a Rockwell B tester, at a load of 15 kg. By measuring the powder density and composite den-sity using a denden-sity meter, the poroden-sity of the composites can be determined. Wear specimens of carbon nanotube–copper composites with a cross-sectional area of 20×20 mm were machined from these sintered materials. All specimens were polished with 1000-mesh SiC paper and degreased with ace-tone before each experiment.
2.2. Friction and wear tests
The friction and wear tests were performed under dry conditions in accordance with ASTM G99-90 standards us-ing a pin-on-disk test rig which is similar to the one used by Poonawala et al. [13]. The composite specimen was mounted as the disk on the rotating lower holder. The
spher-Table 1
Bath composition and operation conditions of electroless nickel plating.
Chemical concentration (g/l)
NiSO4·6H2O 25
Na3C6H5O7·2H2O 5
NaH2PO2·H2O 15
NH4Cl 60
Pb(NO3)2 2.5
Bath temperature 25◦C
pH at 25◦C (adjusted using NH4OH) 8.2
Table 2
Hardness and porosity of unreinforced copper alloy and carbon nanotube–copper composites.
Specimen Average hardness Porosity
(HRB) (%)
Cu alloy 10.2 2.41
Cu–4 vol% CNTs 15.4 2.56
Cu–8 vol% CNTs 20.2 2.47
Cu–12 vol% CNTs 21.5 3.08
Cu–16 vol% CNTs 19.8 4.92
10 and 50 N. Weight loss was measured with an analytical balance at intervals of 1 m throughout the test. The coeffi-cient of friction was calculated by dividing the friction force which was recorded on line via torque as measured by the strain gauge, by the applied load. In order to take repeata-bility into account, the test results for coefficient of friction and wear rate under steady-state sliding were obtained from the average of three readings.
3. Results and discussion
Table 2 lists the hardness and porosity of unreinforced copper alloy and carbon-nanotube-reinforced copper com-posites. The porosity of the composites remained the same value at lower volume fraction of CNTs, but then increased sharply above 12 vol% CNTs. As result of the effects of rein-forcement and porosity, the hardness of the composites first increased with increasing volume fraction then decreased with further increase in volume fraction. The composites with 12 vol% CNTs exhibited the highest value of hardness. The variation of average coefficients of friction versus volume fraction of CNTs for steady-state sliding at various loads is plotted in figure 2. The values of coefficient of fric-tion for the composites decreased with increasing applied load. As compared to the unreinforced copper matrix alloy, the carbon-nanotube-reinforced copper composites revealed low values of the coefficient of friction, which were between 0.096 and 0.19. It is evident from this figure that the coeffi-cient of friction for the composites with higher volume frac-tion of CNTs was slightly lower than that for the composites with lower volume fraction of CNTs. This observation
sug-J.P. Tu et al. / Tribological properties of carbon nanotube composites 227
Figure 2. Average value of coefficient of friction vs. volume fraction of CNTs for the composites at various loads.
Figure 3. Variation of wear rates of the composites and unreinforced copper alloy with applied load.
Figure 4. SEM micrographs of worn surfaces of composites: (a) 4 vol% CNTs, 10 N; (b) 16 vol% CNTs, 10 N; (c) 4 vol% CNTs, 50 N; and (d) 16 vol% CNTs, 50 N.
16
C. Kim et al. compared the properties of composites made with both nickel-coated and pristine CNTs. Additionally the electrical and thermal conductivities were characterized. The nickel-coated SWNTs were first sonicated in ethanol before adding Cu powder particles (10-15µm) and sonicated at 50°C until most of the ethanol was evaporated. They claimed to have achieved a homogenous dispersion via mechanical mixing due to the similar densities of nickel and copper. The blended powders were hot-pressed in vacuum at a pressure of 45 MPa while the temperature ramped to 600°C over 40 minutes and then was left to dwell for an additional 30 minutes.
Figure 2.4 A) Micrograph showing the pull out length of Ni-coated SWNTs in a copper matrix on a tensile test fracture surface, and B) the thermal and electrical conductivities of many common electrical contact materials (taken from C. Kim et al. [42]).
The mechanical and tribological properties of the Ni-SWNT reinforced composites were significantly improved over the pure copper and copper-Ni controls. Due to the extended pull out length of the CNTs in tested samples they concluded that good interfacial strength as a result of dissolution of Cu and Ni at the matrix-reinforcement interface. Although they did not find that the electrical and thermal conductivities of the CNT-reinforced composites increased, they noted that
C. Kim et al. / Synthetic Metals 159 (2009) 424–429 427
Fig. 6.The displacement rates of nickel-coated SWNT reinforced copper matrix composites and control materials. Compositions are shown in weight percent.
of the thermomechanical treatments applied prior to the test. The C1020 plate was hot-rolled at 800◦C, cold-rolled at room tempera-ture and finally annealed. A hot-pressed Cu–Ni specimen was also investigated as a control material (Cu:Ni = 83 wt%:17 wt%). Spheri-cal nickel powders with a diameter of about 3!m were obtained from Sigma–Aldrich (Part number: 266981). Copper and nickel powders were mechanically mixed and sintered using the identical procedure for the nickel-coated SWNT reinforced copper matrix composite specimens. The sample showed the slower displace-ment rate compared with those of the sintered and commercially obtained copper specimens. Copper is a soft, ductile, and highly conductive material whereas nickel is a relatively hard, corrosion resistant material. Copper–nickel alloys have been developed at different concentrations to utilize these compensating properties
[13–15]. The strengthening of copper matrix by the addition of nickel is demonstrated inFig. 6.
We previously reported a rapid increase in the displacement rate of the raw HiPCO SWNT reinforced copper matrix composite, lead-ing to an immediate rupture (data are not shown inFig. 6)[6]. The poor interfacial bonding between carbon and copper was respon-sible for the significantly increased displacement rate[6,16]. Two different procedures were investigated to synthesize nickel-coated nanotubes in order to improve interfacial bonding between carbon and copper. First, the electroless plating was carried out for 90 min at 50◦C without sonication. As shown inFig. 6, the nickel-coated nanotube reinforced copper matrix composite showed a signifi-cantly decreased displacement rate, and the test was interrupted at 140 h. Such remarkable strengthening by nickel-coated nan-otube reinforcements was due to the high load transfer efficiency of nickel-coated nanotubes in the matrix, which was achieved by the improved interfacial bonding between nickel-coated carbon nan-otubes and copper matrix[6]. The second specimen was prepared with sonication at 640 W during the electroless plating procedure. Other conditions were identical. The displacement rate was further decreased. This could be due to the improved mixing during the electroless plating process. The optimized plating condition and precise reason for the improvement still need to be investigated.
Fig. 7a shows an SEM image of the ruptured section of the nickel-coated nanotube reinforced composite (with sonication) after the displacement test. Carbon nanotubes were pulled out of the rup-tured surface. The typical extending length of nanotubes was about 400 nm, which strongly suggested that nanotubes were cut dur-ing the deformation process due to the efficient load transfer from matrix.Fig. 7a shows continuous transition from carbon nanotubes to the interface zone. Good interfacial strength was obtained due to dissolution of copper and nickel at the interface between nickel-coated nanotubes and copper matrix.
Fig. 7.(a) SEM image of the ruptured section of the nickel-coated SWNT reinforced copper matrix composite (with sonication) (b) Raman spectra measured at the rup-tured section.
Fig. 7b shows Raman spectra measured at the ruptured section. The tangential mode (or G peak) of nanotubes at a Raman shift of 1593 cm−1, caused by stretching along C–C bonds of graphene,
indicated that the rod shaped protruding objects were nanotubes
[25]. This could also be verified from the radial breathing mode fre-quency of Raman spectrum, which is inversely proportional to tube diameters[26]. The radial breathing mode spectrum also provides information about the aggregation status of carbon nanotubes. The peak of (10,2) nanotube, at 267 cm−1, is out of resonance at 785 nm
excitation for individually dispersed nanotubes[27]. However, the peak intensity is increased, due to the peak broadening and red-shift of the absorption spectra, as nanotubes form aggregates. As shown inFig. 7b, a large peak at 267 cm−1indicated that the nickel
coating was performed on a small rope of nanotubes rather than individually dispersed nanotubes.
3.2. Thermal conductivity
The laser flash method was adopted to measure thermal conduc-tivities at 3 different temperatures. This non-destructive method offers fast and accurate measurements of thermal diffusivity, spe-cific heat and thermal conductivity[20].Fig. 8shows thermal conductivities of sintered composites and control samples. The data of control samples were obtained from references[28–31]. The ther-mal conductivity of pure copper was about 402 W/mK. There was a slight decrease in the thermal conductivity with increasing temper-ature because free electrons dissipate their kinetic energy to atoms as a result of increased collision[32]. The experimentally deter-mined thermal conductivities of the C1020 plate were similar to
428 C. Kim et al. / Synthetic Metals 159 (2009) 424–429
Table 1
Electrical resistivity of sintered specimens and control materials.
No Sample R(!cm Std. Dev. No Sample R(!cm)
1 Pure Cu[24–27] 1.72×10⁻⁶ 5 Beryllium copper[25,27] 9.07×10⁻⁶
2 Sintered Cu 1.76×10⁻⁶ 8.47×10⁻⁷ 6 Manganese bronze[24,26,27] 2.30×10⁻⁵
3 Sintered Cu(83%) + Ni(17%) 1.03×10⁻⁵ 6.54×10⁻⁷ 7 Stainless steel 304[27] 7.2×10⁻⁵
4 Sintered Cu(83.27%) + Ni(16.65%) coated SWNT(0.08%) 1.43×10⁻⁵ 1.16×10⁻⁶
the conductivity values of pure copper in references, demonstrating reliability of the experimental procedure. The thermal conductiv-ities of the sintered copper specimen were lower than those of the pure copper probably due to the porosity of the specimen. The relative density, measured by the Archimedes’ principle, was estimated to be 96% due to a limitation in the maximum sintering pressure.
The thermal conductivities of the sintered Cu(83%)–Ni(17%) specimen were decreased to about 150 W/mK probably due to the low thermal conductivity of nickel (91 W/mK at 27◦C). Surprisingly, the thermal conductivities of the nickel-coated nanotube rein-forced copper composite were slightly decreased compared with those of the sintered copper–nickel sample. The addition of carbon nanotubes did not improve thermal conductivity of the specimen although the conductivity of the individual nanotube is known to be more than 3000 W/mK[10–11]. This could be due to the interfacial thermal contact barrier although mechanical contact was signifi-cantly improved by coating nanotubes with nickel. Itkis et al. also observed thermal conductivities smaller than 100 W/mK for SWNT films[12].Fig. 8also shows thermal conductivities of other com-mercially available control materials. Beryllium copper is widely used as a copper-based electrical contact material, and its thermal conductivity is 118 W/mK[29,31]. Pure copper cannot be used alone due to the weak mechanical properties although it has excellent electrical and thermal properties. Other anti-corrosive materials such as manganese bronze and stainless steel 304 exhibit much lower thermal conductivities. This demonstrates that nickel-coated SWNT reinforced copper matrix composites have higher thermal conductivities than those of the commercially available electrical contact and anti-corrosive materials.
3.3. Electrical resistivity
The electrical resistivity,R, was measured by a four-point probe in-line technique. As shown inTable 1, the measured electrical resistivity of the sintered copper specimen was similar to that of
Fig. 9.Tribological properties of sintered specimens.
pure copper. The resistivity of the sintered copper–nickel sample was increased to 1.032×10⁻⁵!cm. The introduction of nanotubes
further increased the resistivity to 1.433×10⁻⁵!cm probably due
to the electrical contact resistance. The electrical and thermal con-tact resistance still needs to be improved although the mechanical contact was significantly improved by coating nanotubes with nickel. The electrical resistivity of the nickel-coated SWNT rein-forced copper matrix composite was slightly larger than that of the commercially available electrical contact material, beryllium cop-per, but smaller than those of the anti-corrosive materials such as manganese bronze and stainless steel 304.
3.4. Tribological property
Tribological characteristics of sintered specimens were investi-gated using a ball-on-disk type sliding tester at room temperature as shown inFig. 9. In case of the sintered pure copper specimen, the coefficient of friction started from about 0.16 and increased con-tinuously with time. The initial friction coefficient of the sintered Cu–Ni specimen was smaller than that of the pure copper speci-men. Also, the initial friction coefficient of the sintered pure nickel specimen decreased further probably due to the good tribologi-cal properties of nickel. Scuffing is a catastrophic mode of surface failure and results in an abrupt increase in the friction coefficient. Scuffing occurred between 45 and 65 s for all three samples. The nickel-coated SWNT reinforced copper matrix composite exhibited the smallest initial friction coefficient, and the scuffing was sup-pressed up to 185 s. The improved tribological characteristics are probably due to the self-lubricating properties of carbon nanotubes
![Figure 2.1 Number of publications on polymer, ceramic and metal matrix - CNT composites from 1997 to 2007 (taken from Bakshi et al [34])](https://thumb-us.123doks.com/thumbv2/123dok_us/1624670.1202164/24.612.228.401.76.215/figure-number-publications-polymer-ceramic-matrix-composites-bakshi.webp)