Effect of Insert Coating on Surface Finish
While Machining SGI Component
Swastik V. Ghume1, Akash R. Bhopale2, Avadhoot D. Bhosale3
UG Student, Department of Mechanical Engineering, D.Y.Patil College of Engineering and Technology, Kasaba
Bawada, Kolhapur, Maharashtra, India.
Under The Guidance of Professor N.M.Qureshi Sir, Department of Mechanical Engineering, D.Y.Patil College of
Engineering and Technology, Kasaba Bawada, Kolhapur, Maharashtra, India.
ABSTRACT: In this research work, the TAGUCHI optimization method is used for optimizing the speed, feed, cutting depth & tool geometry for individual performance characteristics by examining effects of different turning insert having similar tool geometry and material composition but with different manufacturing firms, & we are also examining effects of different speed, feed, cutting depth on surface roughness, dimensional accuracy in machining turning operation on CNC lathe machine.
We also have different controlling parameters as cutting speed, depth of cut & feed rate. For investigating, we also used ANOVA & REGRESSION analysis to find out the influence of parameters on above characteristics. The array L27 derived from TAGUCHI optimization method was used to perform series of trials on SGI component. By using L27 array we have optimized best surface finish with CVD-coated insert and by ANOVA we got most significant control parameter- speed and feed . The order of importance of factors is-
Feed>Speed>Insert> Depth of cut.
KEYWORDS: Spheroidal Graphite Iron (Material), Minitab, Inserts, TAGUCHI, speed, feed, depth of cut, surface roughness.
I. INTRODUCTION
The machining process is a process in which material is removed to get desired shape & size by removal of unwanted excess material. The process of removing material from the surface of the job to get the desired shape by ‘single point cutting tool’ is known as Turning. Optimization is nothing but to determine ideal or best value. For this operation,different turning insert with same grades, tool geometry & material composition and a different coating along with different manufacturer are used in presence of different levels of cutting variables like speed, feed, depth of cut for performing turning operation on flange valve (material SGI).This different inserts & cutting variables shows the different effect on characteristics like surface finish, dimension etc. on component turned. Use of coolant in CNC machine may also create a difference in above parameter. It is important to choose the best machining parameters for achieving optimum performance in turning operation.This study demonstrates detailed methodology of the proposed optimization technique which is based on Taguchi method; and ranks the parameters namely cutting speed, feed, depth of cut and inserts for optimum surface finish on SGI component.
II. EXPERIMENTAL SETUP
i) Material - Spheroidal Cast Iron:
Composition -
Carbon 3.2 to 3.60%
Silicon 2.2 to 2.8%
Manganese 0.1 to 0.5%
Magnesium 0.03 to 0.05%
Phosphorus 0.005 to 0.04%
Sulfur 0.005 to 0.02%
Copper <0.40%
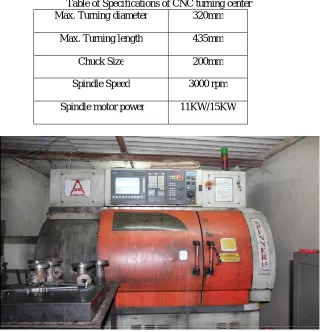
Iron balance ii) CNC Turning Centre
-Askar Spinner 15 Classik with Siemens controller is used to carry out the experimentation.
Table of Specifications of CNC turning center Max. Turning diameter 320mm
Max. Turning length 435mm
Chuck Size 200mm
Spindle Speed 3000 rpm
iii) Job Drawing
-JOB DETAILS: turning on flange of flange valve
NAME OF THE JOB: Flange valve
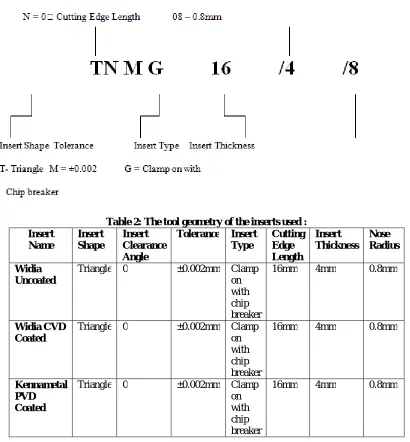
OPERATION PERFORMED ON JOB: Turning iv) Selection of Cutting Tools (Inserts) -
The inserts (ANSI coding) used in present work are a) Widia Uncoated Insert (TNMG160408WC K10PT) b) Widia CVD Coated Insert (TNMG160408RH)
c) Kennametal PVD Coated Insert (TNMG160408MP KCU10)
a) Widia Uncoated Insert b) Widia CVD Coated c) Kennametal PVD Coated
Insert ISO designation for Turning :
Table 2: The tool geometry of the inserts used : Insert Name Insert Shape Insert Clearance Angle
Tolerance Insert Type Cutting Edge Length Insert Thickness Nose Radius Widia Uncoated
Triangle 0 ±0.002mm Clamp on with chip breaker
16mm 4mm 0.8mm
Widia CVD Coated
Triangle 0 ±0.002mm Clamp on with chip breaker
16mm 4mm 0.8mm
Kennametal PVD Coated
Triangle 0 ±0.002mm Clamp on with chip breaker
16mm 4mm 0.8mm
v) Coolant used -
For lubrication, water based coolant was used which influenced better surface finish.
vi) Roughness measurement by using Surface Roughness
The most common parameter is Ra or Arithmetic Average Roughness. Itbasically reflects the average height of roughness component irregularities from a mean line. Ra provides a simple value for accept /reject decisions. It is a default parameter on adrawing if not otherwise specified, and is available even in the least sophisticatedinstruments.
Portable surface roughness tester used in project: SURFTESTSJ210
Features:
1. The 2.4- inch color graphic LCD
2. The display interface supports 16 languages 3. The optional memory card
4. Warning alarm
vii)MINITAB (Version 17) Software-
Minitab is a software or statistical package designated mainly as a teaching tool. Although it is easy to use, it is quite powerful and flexible for moderate size data sets.
Uses of Minitab : Statistics & Analysis
• Regression Analysis
• Analysis of Variance - to determine the difference between data points • Taguchi design of experiment & Analysis
• Data and File Management - spreadsheet for better data analysis • Tables and Graphs
• Time Series and Forecasting - tools that help show trends in data as well as predicting future values. Time series plots, exponential smoothing.
• Statistical Process Control • Measurement System Analysis
ORTHOGONAL ARRAY
Orthogonal arrays allow you to investigate each effect independently from the others and may reduce the time and cost associated with the experiment when fractionated designed are used.
Each column in the orthogonal array represents a specific factor with two or more levels.
Each row represents a run; the cell values indicate the factor settings for the run. By default, Minitab's orthogonal array designs use the integers 1, 2, 3...to represent factor levels. If you enter factor levels, the integers 1, 2, 3,..., will be the coded levels for the design.
The following table displays the L8 (2**7) Taguchi design (orthogonal array). L8 means 8 runs. 2**7 means 7 factors with 2 levels each. If the full factorial design were used, It would have 2**7=128 runs. The L8 (2**7) array requires only 8 runs***a fraction of the full factorial design. This array is orthogonal; factor levels are weighted equally across the entire design. The table columns represent the control factors, the table rows represent the runs (combination of factor levels), and each table cell represents the factor level for that run.
L8 (2 7) Taguchi Design:
A B C D E F G
1 1 1 1 1 1 1
1 1 1 2 2 2 2
1 2 2 1 1 2 2
1 2 2 2 2 1 1
2 1 2 1 2 1 2
2 1 2 2 1 2 1
2 2 1 1 2 2 1
2 2 1 2 1 1 2
TABLE1: TABLE FOR EXPERIMENT (MACHINING PARAMETERS & THEIR LEVELS): Control Variable Level 1 Level 2 Level 3
Spindle Speed (m/min)
150 200 250
Feed (mm/rev) 0.1 0.15 0.2
Depth of cut (mm) 0.45 0.35 0.25
Inserts 1 2 3
*1-Uncoated Insert, 2- CVD Insert, 3- PVD Insert.
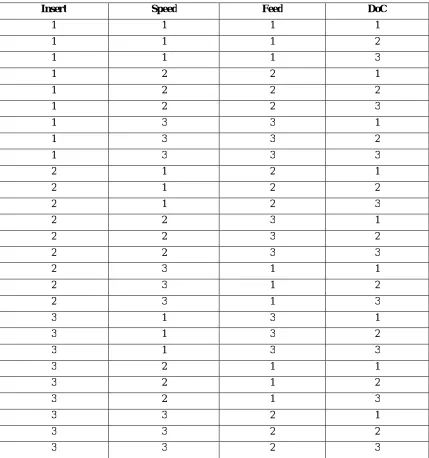
TABLE 2: EXPERIMENT LAYOUT USING TAGUCHI L27 ORTHOGONAL ARRAY
Insert Speed Feed DoC
1 1 1 1
1 1 1 2
1 1 1 3
1 2 2 1
1 2 2 2
1 2 2 3
1 3 3 1
1 3 3 2
1 3 3 3
2 1 2 1
2 1 2 2
2 1 2 3
2 2 3 1
2 2 3 2
2 2 3 3
2 3 1 1
2 3 1 2
2 3 1 3
3 1 3 1
3 1 3 2
3 1 3 3
3 2 1 1
3 2 1 2
3 2 1 3
3 3 2 1
3 3 2 2
3 3 2 3
From table no. 2, it is clear that 27 experiments were carried out accordingly to study the effect of input cutting
parameters. For example: In 1stexperiment the cutting parameters levels are =1, 1, 1, 1 That means experiment was
As per the table no. 2 the values are as follows :
Insert Speed RPM Feed DoC
UC 150 400 0.1 0.45
UC 150 400 0.1 0.35
UC 150 400 0.1 0.25
UC 200 550 0.15 0.45
UC 200 550 0.15 0.35
UC 200 550 0.15 0.25
UC 250 700 0.2 0.45
UC 250 700 0.2 0.35
UC 250 700 0.2 0.25
CVD 150 400 0.15 0.45
CVD 150 400 0.15 0.35
CVD 150 400 0.15 0.25
CVD 200 550 0.2 0.45
CVD 200 550 0.2 0.35
CVD 200 550 0.2 0.25
CVD 250 700 0.1 0.45
CVD 250 700 0.1 0.35
CVD 250 700 0.1 0.25
PVD 150 400 0.2 0.45
PVD 150 400 0.2 0.35
PVD 150 400 0.2 0.25
PVD 200 550 0.1 0.45
PVD 200 550 0.1 0.35
PVD 200 550 0.1 0.25
PVD 250 700 0.15 0.45
PVD 250 700 0.15 0.35
III. OBSERVATION TABLE
Insert Speed RPM Feed DoC Ra
UC 150 400 0.1 0.45 1.995
UC 150 400 0.1 0.35 2.583
UC 150 400 0.1 0.25 1.552
UC 200 550 0.15 0.45 2.532
UC 200 550 0.15 0.35 2.826
UC 200 550 0.15 0.25 2.854
UC 250 700 0.2 0.45 2.617
UC 250 700 0.2 0.35 3.012
UC 250 700 0.2 0.25 2.69
CVD 150 400 0.15 0.45 3.486
CVD 150 400 0.15 0.35 2.772
CVD 150 400 0.15 0.25 3.564
CVD 200 550 0.2 0.45 2.466
CVD 200 550 0.2 0.35 2.25
CVD 200 550 0.2 0.25 2.955
CVD 250 700 0.1 0.45 1.667
CVD 250 700 0.1 0.35 1.225
CVD 250 700 0.1 0.25 0.976
PVD 150 400 0.2 0.45 2.368
PVD 150 400 0.2 0.35 2.759
PVD 150 400 0.2 0.25 2.449
PVD 200 550 0.1 0.45 1.407
PVD 200 550 0.1 0.35 1.656
PVD 200 550 0.1 0.25 2.438
PVD 250 700 0.15 0.45 2.132
PVD 250 700 0.15 0.35 2.259
PVD 250 700 0.15 0.25 1.375
*Ra- Arithmetic Mean Value
IV. RESULTS
INTERACTION PLOT:
From graph, it can be concluding that:
1. Surface roughness value is more at lower speeds and it is maximum at 13th no. Experiment.
2. Ra value is lower and it is much desirable. Experiment no. Of 18th job of CVD gives minimum surface roughness.
V. ANALYSIS & RESULTS USING TAGUCHI METHOD
SURFACE ROUGHNESS -
Taguchi Analysis: Ra versus RPM, FEED, DoC, Insert Response Table for Signal To Noise Ratio
Smaller is better
Level Insert Speed Feed DoC
1 -6.804 -8.098 -4.372 -6.953
2 -6.177 -7.287 -8.151 -7.221
3 -7.865 -5.461 -8.323 -6.672
Delta 1.689 2.637 3.951 0.549
Rank 3 2 1 4
.2
From above graph, it is observed that PVD insert gives us excellent surface finish compared to other two inserts.
At higher speed surface finish is better.
The fine speed improves quality of surface finish.
DoC has very little influence on quality of surface finish.
Roughness:
Response table for Data Means:
Smaller is Better
Level Insert Speed Feed DoC
1 2.377 2.614 1.725 2.297
2 2.094 2.376 2.644 2.375
3 2.518 1.998 2.618 2.317
Delta 0.424 0.616 0.919 0.078
Rank 3 2 1 4
Here also, DoC has a very little influence on surface finish, however smaller DoC is better for improved surface finish.
As shown in figure :
**For thebetter surface finish, thesurface roughness (Ra value) must be smaller. Therefore there, ‘smaller is better
‘condition is used.
V. CONCLUSION
1) Taguchi Analysis:
TAGUCHI analysis is the best method to optimize process parameter for single performance characteristic. From Taguchi analysis, following results is concluded:
Optimized parameters are:
To obtain thebest surface finish the best factors are speed 250 m/min, feed 0.10 mm/rev, DoC 0.75mm with Insert CVD
2) ANOVA analysis gives the importance of individual factors as:
For surface finish, most significant factor is Feed and speed, And order of importance of the factor is:
Feed> Speed>Insert>>DoC
And order of P value for respective factors are:
0.01 < 0.035<0.170<0.934
3) From Regression equation, it is estimated that responses are indirectly or inversely proportional with all cutting parameters with some constant.
With increase in 1 unit of Speed, Insert; the Surface RoughnessDecreased by 0.00616 and 0.212 units respectively &increases by 8.93 and 0.10 respectively with increase in 1unit of feed And DoC.
REFERENCES
1. Journal paper: Optimization of machining parameters for hard machining: Grey relational theory & approach By BalaMurganGopalaswamy
2. Determination of optimum parameters for multi-performance characteristics By B.Abhang. 3. Total Quality Management by Mr. K ShridharaBhat, 2008, 4th Edition
4. Production engineering by Mr. P.C. Sharma,S.Chand Limited, 2008 5. International journal of applied Engg. Research ISSN 0973-4562
6. Elements Of Mechanical Engineering by Mr. K. B. Kale,Technical Publication, 1 Jan.2006 7. Handbook of machine tools.
8. Catalogs of ‘TURNING INSERTS’: WIDIA & KENNAMETAL.
Websites: