Genetics Software
BEST: A Novel Computational Approach for Comparing Gene Expression
Patterns From Early Stages of
Drosophila melanogaster
Development
Sudhir Kumar,*
,†,1Karthik Jayaraman,
‡Sethuraman Panchanathan,*
,‡,§Rajalakshmi Gurunathan,*
,§Ana Marti-Subirana** and Stuart J. Newfeld
†*Center for Evolutionary Functional Genomics,†Department of Biology,‡Department of Electrical Engineering,§Department of Computer Science and Engineering, Arizona State University, Tempe, Arizona 85287 and**Phoenix College, Phoenix, Arizona 85013
Manuscript received August 2, 2002 Accepted for publication September 30, 2002
ABSTRACT
Embryonic gene expression patterns are an indispensable part of modern developmental biology. Currently, investigators must visually inspect numerous images containing embryonic expression patterns to identify spatially similar patterns for inferring potential genetic interactions. The lack of a computational approach to identify pattern similarities is an impediment to advancement in developmental biology research because of the rapidly increasing amount of available embryonic gene expression data. Therefore, we have developed computational approaches to automate the comparison of gene expression patterns contained in images of early stageDrosophila melanogasterembryos (prior to the beginning of germ-band elongation); similarities and differences in gene expression patterns in these early stages have extensive developmental effects. Here we describe a basic expression search tool (BEST) to retrieve best matching expression patterns for a given query expression pattern and a computational device for gene interaction inference using gene expression pattern images and information on the associated genotypes and probes. Analysis of a prototype collection of Drosophila gene expression pattern images is presented to demonstrate the utility of these methods in identifying biologically meaningful matches and inferring gene interactions by direct image content analysis. In particular, the use of BEST searches for gene expression patterns is akin to that of BLAST searches for finding similar sequences. These computational developmental biology methodologies are likely to make the great wealth of embryonic gene expression pattern data easily accessible and to accelerate the discovery of developmental networks.
P
ATTERNS of gene expression in the fruit fly Dro- antagonizedecapentaplegicsignaling (AsheandLevinesophila melanogasterhave been extensively studied by 1999;Jazwinskaet al.1999a,b). As this example shows, visualizing the presence or absence of gene products analysis of similar gene expression patterns is important or their markers in the developing embryo (visualization to understanding the interplay of genes that generate methods are reviewed in Goldstein and Fyrberg the body plans of fruit flies, humans, and other metazo-1994). Genetic studies show that genes with similar ex- ans (reviewed inCarrollet al.2000;Davidson2000; pression patterns often have mutant alleles that affect Rougvie2001).
the same tissue. In these studies, researchers routinely Familiarity with the wealth of images of gene expres-infer gene interactions by visually comparing gene ex- sion patterns gathered over the past two decades is es-pression pattern images (e.g., Gieseler et al. 2001; sential for discovering new genetic interactions.
How-Takaesuet al. 2002). For example, the dorsal/ventral ever, the burden of becoming familiar with extensive polarity of the Drosophila embryo is controlled by many past literature and the rapidly increasing amount of genes, including the secreted factorsdecapentaplegicand information on gene expression patterns is an
impedi-short gastrulationand the transcription factorbrinker.short ment to cross-laboratory endeavors and to building a
gastrulationandbrinkerhave very similar expression pat- global genetic framework for embryonic development. terns and their mutant phenotypes are also very similar. Computational tools to automatically identify images Genetic analyses have shown that both of these genes with similar gene expression patterns from a large col-lection of images and to predict potential genetic in-teractions using these images would greatly facilitate
1Corresponding author:Department of Biology, Life Sciences Center
developmental biology research. Such tools will become
A-351, Arizona State University, Tempe, AZ 85287-1501.
E-mail: [email protected] increasingly important with the advent of large-scalein
situRNA hybridization studies (http://www.fruitfly.org). The need for a computational system is particularly acute in studies of Drosophila, as scientists move beyond studies of single genes or gene families to generate a global view of development. To address these issues, we have developed in silico approaches for automated comparison of gene expression pattern images that mimic some of the visual comparison techniques used by researchers in the laboratory. Our methods enable easy and efficient access to gene expression and interac-tion data and will likely facilitate new discoveries in developmental biology.
In this article, we describe methodologies for (a) standardizing gene expression pattern images as they are acquired under different illumination conditions and are published in a variety of sizes, orientations, and resolutions; (b) quantifying the amount of dissimilarity between two expression patterns by comparing images containing them; (c) identifying those images from a large collection that contain expression patterns similar to that contained in the given image; and (d) inferring
genetic interactions between two genes by comparing Figure 1.—Gene expression pattern images published by two different groups of investigators (Tsaiet al.1998;Zhang
the expression pattern of a particular gene in wild-type
andLevine1999). (A and B) Original gene expression pattern and mutant backgrounds. In the first phase of our
ef-images obtained from the PDF file available online. Relative forts to develop computational methods, we have fo- size differences are due to the differences in sizes of the images cused on early embryonic development inD. melanogas- as originally published. (C and D) Edge-fitted images with the ter. This focus reflects two relevant features of the field rectangle bounding the embryo denoted by the dotted line. (E and F) Size-standardized images. (G and H) Expression of Drosophila developmental genetics. First, there is an
pattern extracted images. emphasis on understanding early developmental events
that have global effects, such as the organization of the embryonic dorsal/ventral axis. Second, the deposition
et al. 2001; Kobayashi et al. 2001; Nibu and Levine
of the cuticle after roughly three-fourths of embryonic
2001). development prevents the use of several techniques
commonly employed for the analysis of gene expression. We present results showing the performance of our
MATERIALS AND METHODS methodologies using a prototype collection of 982
im-age-searchable gene expression pattern images
cap-To meaningfully compare gene expression images computa-tured as whole embryos and retrieved from the literature tionally, it is important to standardize them and to remove (GaulandJackle1987, 1990;Tautz1988;Pankratz background information (reviewed in Castleman 1996).
et al.1989, 1990;Hulskampet al.1990, 1994;Kaniaet Standardization is required because investigators publish digi-tal images in different sizes and orientations and because
al. 1990;Pankratz and Jackle 1990;Hulskamp and
images are acquired under different illumination conditions.
Tautz 1991; Riddihough and Ish-Horowicz 1991;
Digital images are composed of many fine dots (called pixels)
Sommer andTautz 1991; Steingrimssonet al. 1991; of different intensities. Thus standardization establishes the
Pignoniet al.1992;Gutjahret al.1993;Lardelliand pixel-to-pixel correspondence between two images by setting
Ish-Horowicz1993;Grossniklauset al.1994;Hart- up a uniform size and point of reference for all images. For example, two expression patterns in Figure 1 (A and B) are
mannet al.1994;PelegriandLehmann1994;Rothe
quite similar to the naked eye; however, they do not have the
et al. 1994; Schulz and Tautz 1994, 1995; Tsai and
necessary pixel-to-pixel correspondence for computer-based
Gergen 1994; Margoliset al. 1995; Rivera-Pomar et
analysis. The gene expression image standardization
proce-al. 1995; Sanchez-Herrero 1995; Yu and Pick 1995; dure involves a number of steps.
Arnostiet al.1996;Klingleret al.1996;Kosmanand Embryo-enclosing algorithm:This procedure starts with
fit-Small1997;Vincentet al.1997;LawrenceandPick ting the Drosophila embryo boundaries into the smallest possi-ble rectangular area, a process referred to as “edge-fitting” 1998;Nibuet al.1998;Toyet al.1998;Tsaiet al.1998;
(Castleman1996;CostaandCesar2000). For instance, the
Wu et al.1998; Ashe and Levine1999; Goldstein et
dotted lines in Figure 1 (C and D) are the smallest rectangles
al.1999;Jazwinskaet al.1999b;La Rosee-Borggreve
in which the actual embryonic image is contained. Since early
et al. 1999; Niessing et al. 1999; Zhang and Levine stage embryos have a consistent shape, it is an effective way
ent case because many images contain embryo boundaries that are too faint to generate a complete contour.
For this step, we have developed an algorithm in which the boundaries of the initial rectangular image are moved inward until they touch the Drosophila embryo outline on all four sides. In this algorithm, we first consider an area of 5⫻ 5 pixels at the four corners of the image and then compute the mean (m) and standard error (s) of the average color intensities for pixels in the four corners of the image. Next, we find the topmost row in the image, where the upper bound-ary of the embryo is present. For this, we traverse top-to-bottom in each column to identify the pixels closest to the top boundary where the absolute difference between the pixel
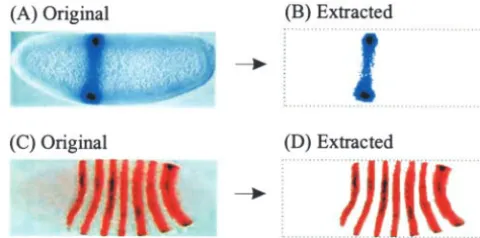
Figure2.—Original and extracted patterns using adaptive intensity (p) andmis significant (e.g.,m⫺pis greater than
thresholding for a simple expression pattern (A and B) and twice the standard error under the assumption of normality).
the expression pattern for a pair-rule gene (C and D). The row coordinate of the pixel identified closest to the top
edge of the image is the top boundary of the embryo. To identify bottom, left, and right boundaries, we use the same
algorithm; the only difference is that now we traverse from also contains some noise. We therefore filter the images to bottom to top in each column, left to right in each row, and suppress and/or remove the noise by employing wavelet filters right to left in each row, respectively. This results in an embryo and morphological operators to selectively remove the higher enclosed in the smallest rectangular area possible. The embryo frequency bands contributed by noise (AdamsandBischof boundaries determined using this algorithm for A and B in 1994). The result of this extraction process for a simple region Figure 1 are shown in C and D. Note that all images are of expression (Figure 2A) is shown in Figure 2B. For images standardized to an anterior (left)–posterior (right)–dorsal containing multiple regions of expression, we employ the re-(top)–ventral (bottom) orientation. gion-growing procedure to extract relevant patterns. Region
Size standardization:In the next step, we need to scale all growing is a procedure that groups pixels or subregions into the resultant images to the same size as they are often captured larger regions starting from a seed pixel (or region) and ap-or published in very different sizes (compare Figure 1, A and pending the neighboring pixels that have similar properties. B). We chose a size of 270⫻100 pixels, which was the average This improves data quality and makes the extracted pattern size of gene expression pattern images acquired from the biologically relevant. For instance, an algorithm implementing published literature. For scaling, we perform a geometric the region-growing procedure automatically extracted all ar-transformation (simple scaling) followed by an interpolation eas of expression for genes that affect multiple regions (e.g., to derive the pixel values of the new image. In these studies, we pair-rule genes) without requiring manual input (Figure 2, C used a gray-level bilinear-interpolation scheme (Castleman and D). (For multiply stained embryos, use of color-sensitive
1996, p. 124). It is a first-order interpolation, which determines thresholds corresponding to each stain separately allows for the destination pixel intensity value based on the four nearest the generation of multiple images.) These methods do not neighbor pixels of the source image. This is a simple but distinguish between quantitative levels of expression; they are effective approach for scaling. Results from this transforma- meant for identifying spatial similarities in the presence or tion are shown in Figure 1, E and F, which are standardized absence of gene expression.
images in which pixel correspondence has been established. Finally, we convert the color/gray-scale pixels into simple
Expression pattern extraction:The next step in the gene black-and-white patterns such that only pixels containing gene expression pattern image standardization is to eliminate back- expression take on a black color and the rest of the image ground to focus on the foreground containing the expression lacks any color (Figure 1, G and H). We do not convert original pattern. This ensures that only actual patterns of gene expres- images directly into black-and-white images prior to conduct-sion are compared for biologically meaningful analysis. In ing the above-mentioned size standardization and pattern ex-Figure 1A, the gene expression pattern is the darkly stained traction procedures because the information contained in region embedded in a lighter-color background. While this differences in color intensities is valuable for reliably separat-can be recognized easily by a trained eye, the process needs ing expression patterns from the background.
to be automated for large-scale data gathering. Therefore, Digital representation of expression patterns:The binary the expression pattern (relevant visual content) first must be images representing gene expression patterns are processed
extracted from each image. to derive a vector of features describing the image content
Extraction of the gene expression pattern from the back- (gene expression patterns). We represent each image in the ground requires the use of a threshold value of pixel intensity form of a string of 1’s and 0’s, where black pixels are denoted (Gonzalez andWoods 1993; Castleman1996). All pixels by a value of 1 and white pixels by a value of 0. For exam-with intensity less than the threshold are assigned a white ple, an expression pattern is represented as 0100111000… color (background) and all others are left as is. Our prelimi- 00000001111111. This is referred to as the binary sequence nary results demonstrated, as expected, that the same thresh- vector (BSV) representation. The BSV representation is partic-old value cannot be used for all images due to differences in ularly useful in quantifying image-to-image dissimilarity for finding images with similar or overlapping expression pat-the intensity distribution caused by variations in investigator
equipment, gene expression pattern, and other factors. To terns, and it allows for localization of image similarity searches to any section of the embryo.
compensate for these variations, we automatically derive
threshold values for each image by using adaptive thresholding An alternative set of features can be derived using shape descriptors, which have proven to be effective in establishing methodology (seeLie1995 for details). This can be
accom-plished, for example, by using the variance of the pixel inten- the similarity between two images as well as in effecting image retrieval (CostaandCesar2000). The latest multimedia stan-sity values for a given image as the basis for the choice of the
proposes shape descriptors for efficient and effective image retrieval. These features are specifically designed for natural images and their utility in the gene expression pattern image analysis is generally unclear. We therefore investigated the usefulness of shape descriptors by adapting them to our spe-cific class of expression pattern images. Our analyses showed that they are not more efficient than the binary sequence vector for the early stage embryos considered here (K. Jayara-man, S.Panchanathanand S.Kumar, unpublished results).
Finding best matching expression patterns with the basic expression search tool (BEST):To find the best matching set of images for a given query image, we need to compute the extent of dissimilarity between gene expression patterns. We use the BSV representation for this purpose. The correspond-ing bit sequences are compared and the number of bits with different values are counted. We define the expression pattern distance (DE) to be equal to the number of differences between two images divided by the number of pixels depicting the expression pattern in at least one of the two images. In other words, we determine expression pattern similarity by focusing only on the pixels that show gene expression (have value 1) in either image. For example, two images, A and B, with bit sequences of length 30 given below have nine differences (underlined bits).
Figure3.—A simple algorithm for inferring gene interac-Expression Pattern A: 000110011110000000000111111111 tion between genes A and B using gene B’s expression pattern Expression Pattern B: 000110011111110000000111000000 images in wild-type and mutant backgrounds for gene A. The wild-type expression pattern B is captured in image BC and Therefore,DE⫽9/18⫽0.5. Images showing the highest the expression of gene B in A mutant background is captured amount of match (i.e., lowest DE) with the query image are in image A-BC. In this image nomenclature, a superscript dash retrieved as the best matches. This simple metric showed reflects the mutant gene and a superscript C reflects the gene excellent performance for early stage embryos in an analysis whose expression is captured. Also, the logic expressions con-of a collection con-of 982 images (see below). taining symbol僆test whether the expression pattern in the
Inferring gene interactions: Gene interactions are com- image on the left is contained completely in the expression puted by comparing expression patterns of individual genes pattern of the image on the right.
in wild-type and mutant backgrounds. Normally, investigators conduct this task by simple visual inspection and deduction. However, as the number of images increases, visual inspection
is used. This operator results in a 0 if the values of the corre-becomes cumbersome. Therefore, we have devised an
algo-sponding pixels in the two images under inspection are the rithm that uses gene expression pattern images, their
geno-same (i.e., if they are both 0 or both 1) or results in a 1 if types, and their probes to infer the nature of the interaction
the values of the corresponding pixels in the two images are for that pair of genes. This computational system works well
different. Outputs fromgeffunction for this image as well as for early stages of embryonic development because gene
ex-the original data are input to ex-the flowchart diagram for infer-pression at these stages is often relatively broad, rather than
ring interactions. highly localized as in later stage embryos. Also, we find that
⬎80% of the available images are from early stage embryos. Therefore these methods are applicable for large amounts of
existing data. RESULTS
A flowchart for the two-gene case is shown in Figure 3, in
Performance of data standardization methods: We which the expression patterns of gene B in the wild-type and
mutant backgrounds for gene A are used. By design, these examined the performance of our methodologies for data shed light on how the expression of gene B is influenced embryo-enclosing and expression pattern extraction us-by gene A. Figure 3 shows various paths starting from the ing 97 images from eight articles (LawrenceandPick gene expression images and proceeding to the decisions that
1998;Toyet al.1998;Tsaiet al.1998;AsheandLevine
correspond to whether or not the expression of gene B is only
1999; Goldstein et al. 1999; Jazwinska et al. 1999b; positively affected (A→B), only negatively affected (A —|B),
positively and negatively affected (A →|B), or not affected ZhangandLevine1999;Jinet al.2000). We provided (A⫻B) by gene A. Using the BSV representations of gene the original and the automatic embryo-enclosed images expression patterns, the actual algorithm works as follows. We to 16 independent evaluators (graduate students in biol-begin by defining a new function, termed the gene expression
ogy or computer science not involved in the current function (gef), which evaluates whether a given expression
project) and requested that they give a score of 0.25 for pattern contains all 0’s or all 1’s or a combination of 0’s and
1’s in a given image (i.e., no expression, ubiquitous expression, each edge in the edge-fitted image that, in their opinion, or localized expression pattern, respectively). It produces 1 if enclosed the Drosophila embryo in the tightest fit possi-the image contains all black pixels. If all pixels are white, possi-then ble (visually). Therefore, a score of 1.0 refers to perfect it produces a 0; otherwise, it returns a P (for partial). To
fit of all four edges, and a score of 0 represents the analyze all possible interactions between the gene expression
poorest fit in all directions. The average edge-fitting patterns, we derive new image patterns based on the two
most edge-fitted images scored perfectly, we identified in descending order below the query image in Figure 4 with the percentage of similarity (1 ⫺ DE) given in a few images that scored poorly (score⬍0.5). This
ap-pears to be due to poor or highly varying illumination parentheses.
Figure 4A shows an image with expression restricted in the image (e.g., embryo boundaries are too faint in
some images) or to artifacts such as panel numbers or to the posterior 10% of the embryo (ZhangandLevine
1999). Specifically, the image shows the expression of arrows. In these difficult cases, we needed to manually
set boundaries. forkheadRNA in a transgenic embryo with maternal
ex-pression of a mutanthairycDNA fused to thebicoid3⬘ We evaluated the performance of our automatic
ap-proach for pattern extraction by again asking 16 inde- untranslated region (UTR). With this as the query im-age, BEST should retrieve images with posterior re-pendent evaluators to assign a score of 1–4 for each
extracted pattern (1 being worst and 4 being best). This stricted expression patterns, especially other panels in the original article. This is indeed the case. Four of the tests the performance of the above method to
approxi-mate what the human eye can easily recognize. The five BEST hits are other panels in the original article. These panels depicttailless,huckebein, andforkheadRNA average success score for the combined region-growing
and adaptive-thresholding methodology was found to expression in transgenic embryos with maternal expres-sion of different mutanthairycDNA fused to thebicoid
be 3.5 (87.5%). The observed difficulty with automatic
pattern extraction appears to relate to the lack of suffi- 3⬘ UTR. In addition, the BEST hits contain an image with expression ofbrachyenteronRNA in ahuckebein mu-cient contrast between the expression pattern and the
background. In addition, in the presence of multiple tant embryo (Goldsteinet al.1999).
Figure 4B shows an image with expression restricted patterns of interest (with different illuminations) the
automatic technique needs to be user guided to extract to the anterior 25% of the embryo (ZhangandLevine
1999). Here, the expression ofhairyRNA in a transgenic all biologically significant regions. For this reason, a
semiautomatic system was developed in which different embryo with maternal expression of ahairycDNA fused to thebicoid3⬘UTR is captured. Three of the five BEST threshold values and/or new seed points for different
regions of interest in the embryo can be specified manu- hits to this image are other panels in the original article; they depicthairyRNA expression in transgenic embryos ally. This improves data quality and makes the extraction
biologically relevant. with maternal expression of different mutant hairy
cDNA fused to thebicoid3⬘UTR. An image from
Hul-Finding similar gene expression patterns
computa-tionally:We explored the effectiveness of our computa- skamp and Tautz (1991), which depicts bicoid RNA expression in a wild-type embryo, is also identified. The tional approach in finding similar expression patterns
using a prototype collection of 982 patterns from 49 bicoidRNA localization is regulated by sequences in its 3⬘UTR (MacDonald1990); thus the identification of published research articles (Figure 4). These tests were
geared toward determining the sensitivity of our compu- bicoidwhen using a query image in which gene expres-sion is regulated by bicoid3⬘UTR sequences is clearly tational approach and the biological validity of the
im-age-matching procedure. A computer program was writ- meaningful. An image fromFlores-Saaibet al.(2001) depicting the expression of Gal4-driven-galactosidase ten to automatically retrieve gene expression pattern
images showing overlap with a given query pattern based (lacZ) RNA in a transgenic embryo expressing the C-terminal domain of Dorsal fused to Gal4 was also solely on the similarities between images. We refer to
the images retrieved by BEST as “BEST hits.” among the five BEST hits. Results for Figure 4, A and B, clearly show that our search tool effectively retrieves Here we briefly summarize the characteristics of our
10 test-case expression patterns and then we describe biologically relevant images that match a query image with a simple expression pattern.
BEST-hit results for each case. Of the 10 patterns, 9 are
lateral views (Figure 4, A–E, G, and H) and one is a Figure 4C shows an image with expression of orthoden-ticleRNA restricted to the anterior 25% of the embryo, dorsal view (F). Expression patterns in some images
differ considerably from each other (e.g., Figure 4, A except that expression is absent at the anterior terminus (Tsai and Gergen 1994). Four of the five BEST hits and B), some differ only slightly (Figure 4, B and C),
some have clearly overlapping domains of expression are images with an anterior expression pattern in which expression is also absent at the anterior terminus. Three even though they are quite different overall (Figure 4,
D and E and G and I), and others have multiple distinct of these are from another article by the same author (Tsaiet al.1998) and depictorthodenticleRNA expression regions of expression (Figure 4, E, F, I, and J). These
query images were chosen without regard to their geno- in different genotypes. An image from Grossniklaus
et al. (1994) depicting the expression of sloppy paired1
type, probe, or any other consideration except for
diver-sity of expression pattern. Also, BEST hits were based RNA in a wild-type embryo was also among the five BEST hits. The least similar of the five BEST hits is an solely on gene expression contained in the images; no
prior knowledge of gene interactions was used. For each image with expression throughout the anterior region of the embryo fromZhangandLevine(1999) showing image, the program queried the entire collection of 982
Figure 4.—BEST-hit re-sults for a variety of query images. Each image is iden-tified by the last name of the first author of the original research article and the figure number for that arti-cle. Values in parentheses are the percentage of simi-larity score (1⫺DE). BEST hits are arranged in de-scending order starting with the best hit. Author names and citations are as follows: Zhang (ZhangandLevine
1999); Goldstein (Goldstein
et al.1999); Saaib (Flores
-Saaib et al. 2001); Huls-kamp3 (Hulskamp and
Tautz 1991); Tsai (Tsai
and Gergen 1994); Tsai2
(Tsai et al. 1998); Gross-niklaus (Grossniklaus et al. 1994); Ashe (Ashe and
Levine1999); Arnosti ( Ar-nosti et al. 1996); Gaul1
(Gaul and Jackle 1990);
Hulskamp2 (Hulskamp et al. 1990); Margolis ( Mar-goliset al.1995); Nasiadka (Nasiadkaet al. 2000); Ja-nody (Janodyet al.2000); Pomar (Rivera-Pomaret al. 1995); Nibu1 (Nibu and
Levine2001); Nibu2 (Nibu
et al.1998); Jazwinska ( Jaz-winska et al. 1999b); Kos-man (Kosman and Small
1997).
maternal expression of ahairycDNA fused to thebicoid The next two BEST hits are images of Kru¨ ppel protein expression in a hunchback mutant embryo (Gauland 3⬘UTR. Notably, even though the query image in Figure
4C is quite similar to the query image in Figure 4B, the Jackle1990) and Kru¨ ppel RNA expression in a bicoid
andhunchbackdouble-mutant embryo (Hulskampet al.
top-five BEST hits for these query images are not the
same. This example demonstrates the sensitivity of the 1990). The next BEST hit is an image ofhunchbackRNA expression in a wild-type embryo (Margoliset al.1995). image search system.
Figure 4D shows an image with a single stripe of TheengrailedRNA expression in an embryo with ubiqui-tous fushi tarazu expression (Nasiadka et al. 2000) expression ofshort gastrulation RNA driven by the even
skippedstripe 2 enhancer in a transgenic embryo (Ashe rounds out the top five. While the query image and the BEST hits are from six different articles, all of the genes andLevine1999). The top five BEST hits include RNA
and protein expression patterns. The top hit is an image involved are part of a well-characterized, spatially local-ized hierarchy of gene regulation. The query image showing Gal4-driven lacZ RNA in an embryo expressing
a Knirps-Gal4 fusion protein under the control of the and the top BEST hits depict expression of a transgene containing the stripe 2 enhancer that normally directs
the expression of the pair-rule gene even skipped. As a dominantTollmutant allele. Two images of lacZ RNA driven by wild-type and modified versions of the
decapen-reviewed byGaulandJackle(1990)even skipped
expres-sion is regulated by the gap geneshunchbackandKru¨ppel taplegicdorsal enhancer (Flores-Saaib et al. 2001) in wild-type embryos are also identified. The other two top (BEST hits 2, 3, and 4). Finally, the segment polarity
pattern ofengrailedexpression (BEST hit 5) is regulated hits arezernaultRNA expression in wild-type anddCtBP
mutants (Nibuet al.1998). In this case, the query and by the pair-rule geneeven skipped(Fujiokaet al.1995).
This example demonstrates the use of the expression all five BEST hits depict the expression of genes involved in direct interactions with Decapentaplegic signaling search system in retrieving data that help in
understand-ing components of developmental pathways. during embryonic dorsal/ventral patterning.
Figure 4I shows an image with stripes of expression Figure 4E shows an image of the two domains of
hunchbackRNA expression in a wild-type embryo.hunch- in ventral and lateral regions. Specifically, the image shows the expression ofshort gastrulationin a wild-type
backis expressed in a wide stripe toward the anterior
and a narrow stripe toward the posterior of the embryo embryo (AsheandLevine1999). The top BEST hit is an image ofbrinkerRNA expression in a wild-type embryo (TsaiandGergen1994). All five BEST hits are images
showinghunchbackexpression (visualized in a variety of (Jazwinskaet al.1999b). The fact that the top hit for
short gastrulationRNA expression isbrinkeris consistent ways) in wild-type or mutant backgrounds. The five
BEST hits include overlapping expression patterns from with the roles of brinker and short gastrulation in the Decapentaplegic signaling pathway (Jazwinska et al.
the original article and from three other articles (Gaul
andJackle 1990; Margolis et al.1995; Janody et al. 1999a,b). One of the five BEST hits is an image from
AsheandLevine(1999) showing the expression ofshort
2000).
Figure 4F shows an image, in dorsal view, with three gastrulationRNA in a transgenic embryo in which short gastrulationis also expressed from theeven skippedstripe domains of expression. Expression is seen in the
ante-rior 25% and in two stripes of expression toward the 2 enhancer. Two images ofrhomboidRNA expression in a dCtBPand a snailmutant embryo are also identified posterior of the embryo. Specifically, the image shows
RaceRNA expression in agoosecoidmutant embryo with (Nibu et al. 1998). All of these genes are involved in embryonic dorsal/ventral patterning. Even skipped
pro-short gastrulation expression driven by the even skipped
stripe 2 enhancer (AsheandLevine1999). Four of the tein expression in an embryo derived from abicoid oskar
double-mutant female is also identified (Gaul and five BEST hits are images from the same article showing
dorsal views ofRace or Race andshort gastrulation RNA Jackle1990).
Finally, we consider an embryo with seven stripes of expression ingoosecoidmutant embryos withshort
gastru-lationexpression driven by theeven skipped stripe 2 en- expression, a pattern typical of pair-rule genes, for find-ing BEST hits (Figure 4J). Figure 4J shows the hancer. An image, in lateral view, showing the
expres-sion of knirps RNA in a maternal and zygotic caudal sion ofruntRNA in an embryo expressing low levels of
knirps under the control of the even skipped stripe 2 mutant embryo, is also identified (Rivera-Pomaret al.
1995). enhancer (KosmanandSmall1997). Four of the five
BEST hits are images from the same article. The top Figure 4G shows an image with expression restricted
to the ventral 10% of the embryo. The expression of BEST hit is an image showing the expression of runt
RNA in an embryo expressing intermediate levels of
snailRNA in an embryo derived from agrouchogermline
clone is shown (Goldsteinet al.1999). Two of the five knirps under the control of the even skipped stripe 2 enhancer. The other three BEST hits from this article BEST hits are images from the same article showing
snailRNA expression in wild-type andhuckebeinmutant show the expression of fushi tarazu RNA in embryos expressing low or intermediate levels of knirps under embryos. In addition, two images of lacZ RNA
expres-sion driven by a fuexpres-sion ofrhomboidandtwistenhancers the control of the even skippedstripe 2 enhancer.fushi tarazuis a pair-rule gene expressed in the same pattern are identified (Nibuet al.1998;NibuandLevine2001).
The identification oftwistexpression when using a query as even skipped (Lawrence and Johnston 1989). An image of fushi tarazu RNA expression in an embryo image of snail expression is biologically meaningful.
Bothtwist andsnail are expressed in the ventral ecto- ubiquitously expressing a Fushi tarazu-VP16 fusion pro-tein is also identified (Nasiadka et al. 2000). In this derm and are important for ventral mesoderm
forma-tion (Ray et al. 1991). The expression of Gal4-driven image, thefushi tarazuexpression pattern appears con-tinuous due to its reduced size. In the original figure lacZ RNA in a transgenic embryo expressing Dorsal
fused to Gal4 is also retrieved in this search (Flores- (as published inNasiadka et al.2000) it is possible to distinguish fushi tarazu’s normal striped pattern above
Saaibet al.2001).
The expression ofdecapentaplegicRNA is restricted to the background of ectopic fushi tarazu expression in-duced by the fusion protein.
the dorsal 40% of a wild-type embryo as shown in Figure
4H (Jazwinskaet al.1999b). One of the five BEST hits Overall these results suggest that the basic expression search tool is (i) able to successfully retrieve expression is an image from the same article showingbrinkerRNA
sensitive to relatively small changes in expression pat-tern, (iii) able to retrieve expression patterns of differ-ent genes that have similar functions (e.g., dorsal/ven-tral patterning), and (iv) able to recover expression patterns of different genes within a spatially localized regulatory hierarchy (e.g., gap, pair-rule, and segment polarity genes). Our examples identify numerous known, biologically meaningful matches (e.g.,short gas-trulationandbrinker) and several potentially new matches (e.g.,orthodenticle andsloppy paired1) from a large data set. This is exactly what a researcher would do when comparing their images to those in the published litera-ture manually by eye. The use of BEST hits will expedite the search for finding comparable RNA and protein expression patterns (as is the case for the BLAST search for molecular sequences). As when searching the litera-ture for matching gene expression patterns, a BEST-hits user must determine the biological meaningfulness of matches retrieved by consulting the original articles.
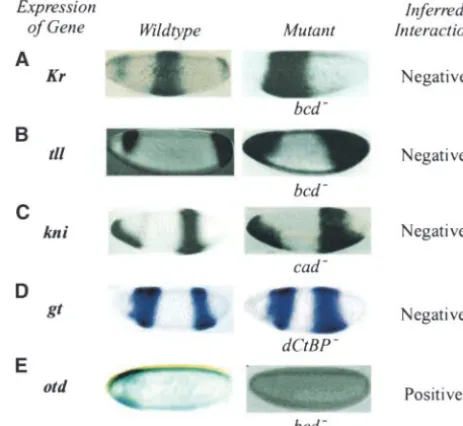
Figure5.—Application of the algorithm for inferring gene
Inferring gene interactions: Here we present results
interaction between genes using expression patterns in wild-from five examples in which genetic interactions were
type and mutant backgrounds. (A) Effect of bicoid(bcd) on computed employing the flowchart diagram in Figure Kru¨ppel(Kr) expression (GaulandJackle1990;Hulskamp 3. Our algorithm compares the expression pattern of a et al.1990). (B) Effect ofbcdontailless(tll) expression ( Pig-noni et al.1992). (C) Effect ofcaudal (cad) onknirps(kni) gene in wild-type and mutant embryos. In each case,
expression (Rivera-Pomaret al.1995;Arnostiet al.1996). inferred interactions are expected to match those that
(D) Effect ofdCtBPongiant(gt) expression (Nibuet al.1998). an investigator would deduce on the basis of their visual
(E) Effect ofbcdonorthodenticle(otd) expression (Tsaiet al. inspection of the same images. 1998;Janodyet al.2000).
Figure 5A shows the effect of bicoidon Kru¨ppel (Kr) expression. On the left, we showKru¨ppel RNA
expres-sion in a wild-type embryo (Hulskampet al.1990) and negative relationship betweencaudalactivity andknirps
expression. This is consistent with theRivera-Pomaret
on the right we show Kru¨ ppel protein expression in a
maternalbicoidmutant (bcd⫺) embryo (GaulandJackle al.(1995) report thatgiant, acaudal-dependent repres-sor, refines the expression ofknirps.
1990). Our algorithm compares the pattern of Kru¨ ppel
expression in each image and determines that there is The posterior refinement of giant expression by
dCtBP-mediated repression is shown in the next example more extensive Kru¨ ppel expression in thebcd⫺embryo
than in the wild-type embryo. The program suggests (Figure 5D). HeregiantRNA expression in a wild-type embryo and a dCtBP germline clone mutant embryo that Kru¨ ppel expression is negatively affected by bicoid
activity, when we consider the extent of the region of (dCtBP⫺;Nibuet al.1998) are compared. The algorithm suggests thatgiant expression is negatively affected by gene expression. This is consistent with the reported
refinement of Kru¨ ppel expression by bicoid-mediated dCtBPactivity as reported byNibuet al.(1998). Finally, we consider the effect ofbicoidonorthodenticle
repression (Gaul and Jackle 1990; Hulskamp et al.
1990). (otd) expression (Figure 5E). The algorithm compares
the expression patterns of Orthodenticle protein in a Figure 5B shows the effect of bicoid on tailless (tll)
expression by comparingtaillessRNA expression in wild- wild-type embryo (Janodyet al.2000) andorthodenticle
RNA in a maternalbicoidmutant (bcd⫺) embryo (Tsai
type andbcd⫺embryos (Pignoniet al.1992). The
algo-rithm suggests thattaillessexpression is also negatively et al.1998;Janodyet al.2000). Our algorithm suggests thatorthodenticleexpression is positively affected bybicoid
affected by bicoidactivity. This is consistent with visual
comparison of these images as reported byPignoniet activity, because there is less extensive orthodenticle ex-pression in the bcd⫺embryo than in the wild-type
em-al. (1992).
In Figure 5C, we examine the interaction between bryo. This result is consistent with the known activation oforthodenticleexpression bybicoid(Tsaiet al.1998).
caudalandknirps(kni). For this purpose, we use images
containingknirpsRNA expression in a wild-type embryo These examples illustrate the ability of our computa-tional techniques to infer genetic interactions using im-(Arnosti et al. 1996) and in a maternal and zygotic
caudal mutant (cad⫺) embryo (Rivera-Pomar et al. age data in a manner similar to that employed visually by researchers. The simplicity of the approach is that 1995). The algorithm determines that there is more
available pairs of images that are suitable for inferring possible pair of genes for which wild-type and mutant expression patterns are available. It therefore will facili-genetic interactions (results from those analyses will be
published elsewhere). tate construction of developmental networks and help explore the combinatorial nature of genetic interactions that provide the exquisite specificity and diversity of gene expression patterns. These algorithms provide spe-DISCUSSION
cific predictions for researchers, who can then test the A major problem facing biologists today is that data
validity of these in silico inferences. In the future, we generation has consistently outpaced advancements in
plan to develop similar algorithms for simultaneous computational techniques for developing biological in- analysis of multiple genes.
sights and generating hypotheses. This problem has In summary, methods presented in this article are plagued molecular sequence data for over a decade. efforts to fulfill the need for computational technology With the advent of large-scale high-throughputin situ for large-scale analysis of gene expression data. For
in-efforts, we are headed toward biological data overload stance, our approach will facilitate the construction of in developmental biology as well. For example, Berkeley similarity-based clusters of expression pattern images. Drosophila Genome Project has released a large collec- Examination of similarities and differences in their spa-tion of images (⬎30,000) generated with a standardized tial and temporal contexts and of the genetic back-RNAin situhybridization method using whole embryos ground of images within each similarity cluster will likely and cDNA probes from the Drosophila UNIGENE set reveal new genetic interactions and thus accelerate the (http://www.fruitfly.org). About 15,000 of these images discovery of hidden links in developmental networks. are expected to depict gene expression from early stage Therefore, an accelerated, expanded understanding of embryos. These data are released in raw form to the the interconnected nature of gene function may emerge public. How will we view these data efficiently? How will fromin silico analysis.
we find images with similar expression patterns, other
We thank Drs. Tom Brody, David Capco, Alan Filipski, Manfred
than by manually browsing through each and every im- Laubichler, Alan Rawls, Koichiro Tamura, and Jeanne Wilson-Rawls age? How will we compare the newly acquired knowl- for invaluable comments on an early draft of this article. We greatly appreciate the efforts of Emily Davenport, Veena Ganeshan, Eric
edge to all existing knowledge published in the
litera-Herbig, and Aaron Johnson in image data collection and pattern
ture? How will the images be standardized? How can
extraction, and Dr. Sankar Subramanian’s technical assistance. This
we use all the data to generate a global view of the
research was supported in part by funds from the Center for
Evolution-early stages of Drosophila embryonic development? No ary Functional Genomics (S.K.) and research grants from the National computational frameworks that will facilitate efficient Institutes of Health (S.K., S.J.N.) and National Science Foundation
(S.P.).
analyses of these new images or integrate these new images with existing image data from the literature exist. We have tackled this challenge by developing
meth-LITERATURE CITED ods and algorithms for standardization, extraction, and
similarity search of gene expression patterns. We have Adams, R., and L. Bischof, 1994 Seeded region growing. IEEE Transactions on Patterns Analysis and Mach. Intell.16:641–647.
demonstrated their utility in finding similar and
overlap-Altschul, S. F., W. Gish, W. Miller, E. W. MyersandD. J. Lipman,
ping expression patterns for a wide variety of genes from 1990 Basic local alignment search tool. J. Mol. Biol.215:403– early stages of Drosophila embryonic development. 410.
Arnosti, D. N., S. Gray, S. Barolo, J. ZhouandM. Levine, 1996
These bioinformatic methodologies are likely to pave
The gap protein knirps mediates both quenching and direct
the way for establishing a public computational resource repression in the Drosophila embryo. EMBO J.15:3659–3666. to find similar expression patterns based on the visual Ashe, H. L., andM. Levine, 1999 Local inhibition and long-range
enhancement of Dpp signal transduction by Sog. Nature 398: content of the query image, a facility that will parallel
427–431.
the BLAST search (Altschul et al.1990) for finding Carroll, S. B., J. K. GrenierandS. D. Weatherbee, 2000 From homologous sequences. It will make the great wealth of DNA to Diversity: Molecular Genetics and the Evolution of Animal
Design.Blackwell Science, Oxford.
embryonic gene expression pattern data easily
accessi-Casares, F., andE. Sanchez-Herrero, 1995 Regulation of the
infra-ble. While we have focused on methods for early stage abdominal regions of the bithorax complex of Drosophila by gap embryos here, these methods are adaptable for analysis genes. Development121:1855–1866.
Castleman, K. R., 1996 Digital Image Processing. Prentice-Hall,
Engle-of images capturing later stages as well as imaginal disc
wood Cliffs, NJ.
gene expression. Toward this end, our initial results Costa, L. F., andR. M. Cesar, 2000 Shape Analysis and Classification: are encouraging and are in preparation for publication Theory and Practice. CRC Press, Cleveland.
Davidson, E., 2000 Genomic Regulatory Systems: Development and
Evolu-elsewhere.
tion. Academic Press, New York.
We have also proposed a method for elucidating ge- Flores-Saaib, R. D., S. JiaandA. J. Courey, 2001 Activation and netic interactions computationally by comparing ex- repression by the C-terminal domain of Dorsal. Development
128:1869–1879.
pression patterns of a given gene in wild-type and
mu-Fujioka, M., J. B. JaynesandT. Goto, 1995 Early even-skipped
tant backgrounds. This method will provide researchers stripes act as morphogenetic gradients at the single cell level to
establish engrailed expression. Development121:4371–4382.
Gaul, U., andH. Jackle, 1987 Pole region-dependent repression Lie, W.-N., 1995 Automatic target segmentation by locally adaptive of the Drosophila gap gene Kru¨ ppel by maternal gene products. image thresholding. IEEE Transactions on Image Processing4:
Cell51:549–555. 1036–1041.
Gaul, U., andH. Jackle, 1990 Role of gap genes in earlyDrosophila MacDonald, P. M., 1990 bicoid mRNA localization signal:
phyloge-development, pp. 239–275 inGenetic Regulatory Hierarchies in Devel- netic conservation of function and RNA secondary structure.
opment, edited by T. R. F.Wright. Academic Press, San Diego. Development110:161–171.
Gieseler, K., E. Wilder, M. C. Mariol, M. Buratovitch, H. Margolis, J. S., M. L. Borowsky, E. Steingrimsson, C. W. Shim, J. A.
Berengeret al., 2001 DWnt4 and wingless elicit similar cellular Lengyelet al., 1995 Posterior stripe expression of hunchback is
responses during imaginal development. Dev. Biol.232:339–350. driven from two promoters by a common enhancer element.
Goldstein, L. S. B., andE. A. Fyrberg(Editors), 1994 Drosophila Development121:3067–3077.
melanogaster: Practical Uses in Cell and Molecular Biology. Academic Nasiadka, A., A. GrillandH. M. Krause, 2000 Mechanisms regu-Press, San Diego. lating target gene selection by the homeodomain-containing
pro-Goldstein, R. E., G. Jimenez, O. Cook, D. GurandZ. Paroush, 1999 tein Fushi tarazu. Development127:2965–2976.
Huckebein repressor activity inDrosophilaterminal patterning is Nibu, Y., andM. S. Levine, 2001 CtBP-dependent activities of the mediated by Groucho. Development126:3747–3755. short-range Giant repressor in the Drosophila embryo. Proc. Natl.
Gonzalez, R., andR. Woods, 1993 Digital Image Processing. Addison- Acad. Sci. USA98:6204–6208.
Wesley, Reading, MA. Nibu, Y., H. Zhang, E. Bajor, S. Barolo, S. Smallet al., 1998 dCtBP
Grossniklaus, U., K. M. CadiganandW. J. Gehring, 1994 Three mediates transcriptional repression by Knirps, Kru¨ ppel and Snail
maternal coordinate systems cooperate in the patterning of the in the Drosophila embryo. EMBO J.17:7009–7020.
Drosophila head. Development120:3155–3171. Niessing, D., N. Dostatni, H. JackleandR. Rivera-Pomar, 1999
Gutjahr, T., E. FreiandM. Noll, 1993 Complex regulation of Sequence interval within the PEST motif of Bicoid is important for
early paired expression: initial activation by gap genes and pattern translational repression of caudal mRNA in the anterior region of modulation by pair-rule genes. Development117:609–623. the Drosophila embryo. EMBO J.18:1966–1973.
Hartmann, C., H. Taubert, H. JackleandM. J. Pankratz, 1994 Pankratz, M. J., andH. Jackle, 1990 Making stripes in the
Drosoph-A two-step mode of stripe formation in the Drosophila blastoderm ila embryo. Trends Genet.6:287–292.
requires interactions among primary pair rule genes. Mech. Dev. Pankratz, M. J., M. Hoch, E. SeifertandH. Jackle, 1989 Kru¨ ppel
45:3–13. requirement for knirps enhancement reflects overlapping gap
Hulskamp, M., andD. Tautz, 1991 Gap genes and gradients—the gene activities in the Drosophila embryo. Nature341:337–340.
logic behind the gaps. Bioessays13:261–268. Pankratz, M. J., E. Seifert, N. Gerwin, B. Billi, U. Nauberet al.,
Hulskamp, M., C. PfeifleandD. Tautz, 1990 A morphogenetic 1990 Gradients of Kru¨ ppel and knirps gene products direct
gradient of hunchback protein organizes the expression of the pair-rule gene stripe patterning in the posterior region of the gap genes Kru¨ ppel and knirps in the early Drosophila embryo. Drosophila embryo. Cell61:309–317.
Nature346:577–580. Pelegri, F., andR. Lehmann, 1994 A role of polycomb group genes
Hulskamp, M., W. Lukowitz, A. Beermann, G. GlaserandD. Tautz, in the regulation of gap gene expression in Drosophila. Genetics
1994 Differential regulation of target genes by different alleles 136:1341–1353.
of the segmentation gene hunchback in Drosophila. Genetics Pignoni, F., E. SteingrimssonandJ. A. Lengyel, 1992 bicoid and
138:125–134. the terminal system activate tailless expression in the early
Dro-Janody, F., J. ReischlandN. Dostatni, 2000 Persistence of Hunch- sophila embryo. Development115:239–251.
back in the terminal region of the Drosophila blastoderm embryo Ray, R. P., K. Arora, C. Nusslein-Volhard andW. M. Gelbart, impairs anterior development. Development127:1573–1582. 1991 The control of cell fate along the dorsal-ventral axis of
Jazwinska, A., N. Kirov, E. Wieschaus, S. RothandC. Rushlow, the Drosophila embryo. Development113:35–54.
1999a The Drosophila gene brinker reveals a novel mechanism
Riddihough, G., andD. Ish-Horowicz, 1991 Individual stripe
regu-of Dpp target gene regulation. Cell96:563–573. latory elements in the Drosophila hairy promoter respond to
Jazwinska, A., C. RushlowandS. Roth, 1999b The role ofbrinker
maternal, gap, and pair-rule genes. Genes Dev.5:840–854. in mediating the graded response to Dpp in early Drosophila Rivera-Pomar, R., X. Lu, N. Perrimon, H. TaubertandH. Jackle,
embryo. Development126:3323–3334.
1995 Activation of posterior gap gene expression in the
Dro-Jin, S., S. Marinke, W. S. Joo, J. R. Wortman, N. Mirkovicet al., sophila blastoderm. Nature
376:253–256. 2000 Identification and characterization of a p53 homologous
Rothe, M., E. A. Wimmer, M. J. Pankratz, M. Gonzalez-Gaitan
inDrosophila melanogaster.Proc. Natl. Acad. Sci. USA97:7301–
andH. Jackle, 1994 Identical transacting factor requirement
7306.
for knirps and knirps-related gene expression in the anterior but
Kania, M. A., A. S. Bonner, J. B. DuffyandJ. P. Gergen, 1990 The
not in the posterior region of the Drosophila embryo. Mech. Drosophila segmentation gene runt encodes a novel nuclear
regu-Dev.46:169–181. latory protein that is also expressed in the developing nervous
Rougvie, A. E., 2001 Control of developmental timing in animals.
system. Genes Dev.4:1701–1713.
Nat. Rev. Genet.2:690–701.
Klingler, M., J. Soong, B. ButlerandJ. P. Gergen, 1996 Disperse
Schulz, C., andD. Tautz, 1994 Autonomous
concentration-depen-versus compact elements for the regulation of runt stripes in
dent activation and repression of Kru¨ ppel by hunchback in the Drosophila. Dev. Biol.177:73–84.
Drosophila embryo. Development120:3043–3049.
Kobayashi, M., R. E. Goldstein, M. Fujioka, Z. ParoushandJ. B.
Schulz, C., andD. Tautz, 1995 Zygotic caudal regulation by
hunch-Jaynes, 2001 Groucho augments the repression of multiple
back and its role in abdominal segment formation of the Drosoph-Even skipped target genes in establishing parasegment
bound-ila embryo. Development121:1023–1028. aries. Development128:1805–1815.
Sommer, R., andD. Tautz, 1991 Segmentation gene expression in
Kosman, D., and S. Small, 1997 Concentration-dependent
pat-the housefly Musca domestica. Development113:419–430. terning by an ectopic expression domain of the Drosophila gap
Steingrimsson, E., F. Pignoni, G. J. LiawandJ. A. Lengyel, 1991
gene knirps. Development124:1343–1354.
Dual role of the Drosophila pattern gene tailless in embryonic
Lardelli, M., andD. Ish-Horowicz, 1993 Drosophila hairy
pair-termini. Science254:418–421. rule gene regulates embryonic patterning outside its apparent
Takaesu, N. T., A. N. Johnson, O. H. SultaniandS. J. Newfeld,
stripe domains. Development118:255–266.
2002 Combinatorial signaling by an unconventional Wg
path-La Rosee-Borggreve, A., T. Hader, D. Wainwright, F. Sauerand
way and the Dpp pathway requires Nejire (CBP/p300) to regulate
H. Jackle, 1999 hairy stripe 7 element mediates activation and
dpp expression in posterior tracheal branches. Dev. Biol.247:
repression in response to different domains and levels of Kru¨ ppel
225–236. in the Drosophila embryo. Mech. Dev.89:133–140.
Tautz, D., 1988 Regulation of the Drosophila segmentation gene
Lawrence, P. A.,andP. Johnston, 1989 Analysis of function of
hunchback by two maternal morphogenetic centres. Nature332:
the pair-rule geneshairy,even-skippedandfushi tarazuin mosaic
281–284. Drosophila embryos. Development107:847–853.
Toy, J., J.-M. Yang, G. S. LeppertandO. H. Sundin, 1998 The
Lawrence, P. A., andL. Pick, 1998 How does thefushi tarazugene
activates retina-specific genes. Proc. Natl. Acad. Sci. USA 95: 2000 Bicoid-independent formation of thoracic segments in 10643–10648. Drosophila. Science287:2476–2479.
Tsai, C., andJ. P. Gergen, 1994 Gap gene properties of the pair- Wu, X., R. VakaniandS. Small, 1998 Two distinct mechanisms for
rule gene runt during Drosophila segmentation. Development differential positioning of gene expression borders involving the
120:1671–1683. Drosophila gap protein giant. Development125:3765–3774.
Tsai, C. C., S. G. KramerandJ. P. Gergen, 1998 Pair-rule gene Yu, Y., andL. Pick, 1995 Non-periodic cues generate seven ftz stripes
runt restricts orthodenticle expression to the presumptive head in the Drosophila embryo. Mech. Dev.50:163–175.
of the Drosophila embryo. Dev. Genet.23:35–44. Zhang, H., andM. Levine, 1999 Groucho and dCtBP mediate
sepa-Vincent, A., J. T. BlankenshipandE. Wieschaus, 1997 Integration rate pathways of transcriptional repression in theDrosophila
em-of the head and trunk segmentation systems controls cephalic bryo. Proc. Natl. Acad. Sci. USA96:535–540. furrow formation in Drosophila. Development124:3747–3754.