DOI: 10.1534/genetics.105.049619
Parallel Changes in Global Protein Profiles During Long-Term
Experimental Evolution in
Escherichia coli
Ludovic Pelosi,* Lauriane Ku
¨hn,
†Dorian Guetta,* Je´ro
ˆme Garin,
†Johannes Geiselmann,*
Richard E. Lenski
‡and Dominique Schneider*
,1*Laboratoire Adaptation et Pathoge´nie des Microorganismes, Universite´ Joseph Fourier, CNRS UMR 5163, 38041 Grenoble, France, †Laboratoire Chimie des Proteines DRDC-CP, ERM 0201 CEA/INSERM/UJF, 38054 Grenoble, France and‡Department of
Microbiology and Molecular Genetics, Michigan State University, East Lansing, Michigan 48824 Manuscript received August 15, 2005
Accepted for publication May 11, 2006
ABSTRACT
Twelve populations ofEscherichia colievolved in and adapted to a glucose-limited environment from a common ancestor. We used two-dimensional protein electrophoresis to compare two evolved clones, isolated from independently derived populations after 20,000 generations. Exceptional parallelism was detected. We compared the observed changes in protein expression profiles with previously characterized global transcription profiles of the same clones; this is the first time such a comparison has been made in an evolutionary context where these changes are often quite subtle. The two methodologies exhibited some remarkable similarities that highlighted two different levels of parallel regulatory changes that were bene-ficial during the evolution experiment. First, at the higher level, both methods revealed extensive parallel changes in the same global regulatory network, reflecting the involvement of beneficial mutations in genes that control the ppGpp regulon. Second, both methods detected expression changes of identical gene sets that reflected parallel changes at a lower level of gene regulation. The protein profiles led to the discovery of beneficial mutations affecting themalTgene, with strong genetic parallelism across independently evolved populations. Functional and evolutionary analyses of these mutations revealed parallel phenotypic de-creases in the maltose regulon expression and a high level of polymorphism at this locus in the evolved populations.
A
key challenge in evolutionary biology is to de-cipher the relationship between genotype and phenotype, in particular for those traits associated with increased fitness (Lewontin 1974). Understandingevolutionary adaptation requires identification of the target genes of natural selection, which is a difficult task especially for complex traits in environments where any number of physiological pathways might be important. Moreover, most organisms are not easy to analyze and manipulate genetically; even most model organisms, for which there exists a wealth of genetic information, have large and complex genomes that make such ana-lyses very difficult. However, significant contributions to characterizing the genotype-to-phenotype relationships that underlie evolutionary adaptations have been achieved in recent years by focusing on cases of parallel and convergent changes.
Parallel evolution is defined as the independent evo-lution of the same trait in different lineages (Futuyma
1986). Independent populations of various types of organisms—from bacteriophages and bacteria to
in-sects and vertebrates—have in many studies been shown to evolve parallel phenotypic traits under similar en-vironmental conditions (Vasiet al. 1994; Losos et al.
1998; Raineyand Travisano 1998; Ferea et al. 1999;
Wichmanet al.1999; Hueyet al.2000; Nosilet al.2002;
Nachman et al. 2003; Zhang 2003; Schluter 2004;
Colosimoet al.2005). The statistically predictable
rela-tionship between environmental features and the evo-lution of organismal traits is unlikely to arise by genetic drift and instead strongly implicates natural selection. Thus, parallel and convergent changes in phenotypic traits are widely regarded as hallmarks of adaptive evolution.
Molecular studies focusing on specific phenotypic traits have also sometimes been successful in identifying the genetic basis of the parallel evolution of these phe-notypic characters. For example, parallel evolution of resistance to heavy metals, insecticides, and drugs led to the discovery of the molecular changes underlying these adaptations in organisms as diverse as plants, insects, and viruses (Schat et al.1996; Crandall et al. 1999;
Dabornet al.2002). Most such studies of parallel
molec-ular evolution have focused on the genes underlying a few traits, such as resistance, that reflect adaptation to a specific selective agent or other environmental factor. However, fitness itself is a complex phenotypic trait that
1Corresponding author:Laboratoire Adaptation et Pathoge´nie des
Mi-croorganismes, Universite´ Joseph Fourier, CNRS UMR 5163, Institut Jean Roget, Domaine de la Merci, La Tronche 38700, France.
E-mail: [email protected]
emerges from all the interactions among the molecular components of an entire organism. Therefore, it is of considerable interest, as well as a great challenge, to assess the extent of parallel evolution for as many traits and genes as possible in a given system.
The development of tools to measure global gene ex-pression profiles offers the new opportunity to measure simultaneously hundreds or thousands of expression-level phenotypic traits. These measurements are possi-ble either at the level of messenger RNAs by using DNA macroarrays (DeRisiet al.1997) or at the protein level
with two-dimensional proteomic electrophoresis (Lee
and Lee 2003). A model system in which both sets of
data could be obtained and compared would, on the one hand, advance our understanding of the overall extent and importance of parallelism during the evolu-tionary process and, on the other hand, provide new insight into the relative contribution of different levels of gene regulation to parallel changes. Both methodol-ogies could also be used, alone or in combination, to help reveal the type and identity of the underlying mutations. The strength of such an analysis depends on the assumption that any parallel changes observed are independent and not based on common ancestry. This assumption can be fulfilled with certainty in experiments where replicate microbial populations independently evolve from the same founding ancestral genotype (Elena and Lenski 2003). The availability of genomic
resources for the study organism also facilitates further research in identifying the molecular mechanisms un-derlying adaptation to particular environments on the basis of the pattern of parallel phenotypic changes.
A clone ofEscherichia coliB was used as the common ancestor to found the longest-running evolution exper-iment (Lenski2004). Twelve independent populations
were initiated from this ancestor and propagated by daily serial transfer in the same defined glucose-limited environment for .20,000 generations (Lenski et al.
1991; Lenskiand Travisano1994; Cooperand Lenski
2000). Over time, the populations diverged genetically from their ancestor and genetic diversity accumulated within the evolving populations (Papadopouloset al.
1999). All the replicate populations achieved more or less parallel gains in competitive fitness, indicative of sub-stantial adaptation, on the basis of competition experi-ments with marked variants of the ancestor in the same glucose-limited environment (Lenski and Travisano
1994; Cooper and Lenski 2000). Several other
phe-notypic aspects also evolved in parallel, including cell size (Lenskiet al.1998), growth parameters (Vasiet al.
1994), catabolic functions (Cooper and Lenski 2000),
and DNA topology (Crozat et al. 2005). Moreover,
analyses of gene expression profiles using DNA mac-roarrays for 2 of the populations revealed parallel changes in the transcription of 59 genes after 20,000 generations of experimental evolution (Cooper et al.
2003). The genetic bases of some of these parallel
phenotypic changes were investigated and mutations discovered in genes involved in ribose utilization (Cooper et al. 2001), DNA topology (Crozat et al. 2005), and
the stringent response (Cooperet al. 2003). In each of
these cases, relevant mutations were found in many or all of the independently evolved populations, implying parallel molecular evolution. By constructing isogenic strains that differed by single mutations and performing competition experiments in the same glucose-limited en-vironment of the evolution experiment, 4 of these genes were demonstrated to be targets of natural selection (Cooper et al. 2001, 2003; Crozat et al. 2005): spoT,
involved in the metabolism of the signaling molecule ppGpp (Cashelet al.1996);topA, encoding
topoisomer-ase I (Wang1971);fis, encoding a histone-like protein
(Dorman and Deighan 2003); and the rbs
ribose-utilization operon (Abou-Sabe´ et al. 1982). However,
summing the fitness gains caused by the mutations in these 4 genes explains only about one-third of the av-erage fitness increase after 20,000 generations of evolu-tion, indicating that more beneficial mutations await discovery, consistent with an estimate of10–20 bene-ficial mutations substituted in each population (Lenski
2004). By contrast to these cases of parallel genetic changes, sequencing 36 gene regions chosen at random found no mutations at all except in 4 populations that evolved mutator phenotypes (Sniegowski et al. 1997;
Cooperet al.2003; Lenskiet al.2003).
In this study, we analyzed the extent of parallel change at the protein level in two evolved clones, each from an independently evolved population, by performing two-dimensional protein gel electrophoresis. Their proteo-mic profiles were compared with one another and with the profile obtained for their common ancestor. The two evolved clones that we analyzed were the same ones that had been investigated previously using DNA macro-arrays (Cooperet al. 2003), which allowed us to
com-pare the inferences on the basis of transcriptional and proteomic profiles. Although we observed impressive correspondence between these two approaches in terms of an important suite of parallel changes involving a global regulatory pathway, our study also identified an additional target of natural selection involving a lower level of regulation that affected 8 of the 12 populations.
MATERIALS AND METHODS
Strains, plasmids, and culture conditions:A single clone of E. coliB (Lederberg1966; Schneideret al.2002) was used as the common ancestor to found 12 populations that were subsequently propagated in a constant glucose-limited mini-mal medium for .20,000 generations (Lenski et al. 1991; Lenski and Travisano 1994; Cooper and Lenski 2000; Lenski2004). Six populations, designated Ara1 to Ara6, were initiated from an Aravariant of the ancestor (REL606), whereas the six other populations, designated Ara11 to Ara1
6, were initiated from an Ara1
demonstrated to be neutral in the selection environment (Lenski et al. 1991; Lenski and Travisano 1994). At 500-generation intervals throughout the evolution experiment, mixed samples from each of the 12 populations were conserved as glycerol suspensions at80°. Individual evolved clones were isolated as needed by plating these mixed samples on tetrazo-lium–arabinose plates (Lenskiet al.1991). Two evolved clones, designated REL8593A and REL9282A (Cooper and Lenski 2000; Cooperet al.2003), were isolated at 20,000 generations from two focal populations, Ara1 and Ara11, respectively, and were used to characterize their proteomic profiles in com-parison with the ancestral profile. Many other evolved clones were isolated from the various populations throughout the ex-perimental generations to sequence themalTgene and analyze the dynamics of mutational substitutions in that gene.
Strain BW3216, isolated after 280 generations of glucose-limited growth in a chemostat (Notley-McRobband Ferenci 1999), was used to isolate amalTmutant allele that shows con-stitutive upregulation of the maltose regulon. Strain BW2951 is an MC4100 derivative that carries alamB–lacZtranscriptional fu-sion marked with kanamycin resistance (Notleyand Ferenci 1995). Strain pop7164 carries amalTdeletion allele (Schreiber et al. 2000) and was used as a control in immunoblotting experiments.
For cloning experiments, we usedE. coliJM109 (Yanisch -Perronet al.1985) with standard procedures (Sambrooket al. 1989) or TOP10 (Invitrogen, San Diego) according to the sup-plier’s recommendations. Plasmids pCRII-Topo (Invitrogen) and pKO3 (Link et al.1997) were used for cloning experi-ments and allelic replaceexperi-ments, respectively.
Strains were grown in Davis minimal (DM) medium sup-plemented with 25mg/ml glucose (DM25) as in the evolution experiment (Lenskiet al. 1991) or with 250mg/ml glucose (DM250) or were grown in rich LB medium (Sambrooket al. 1989). The same minimal medium except with maltose sub-stituted for glucose was used to assess maltose utilization capacity. Unless otherwise stated, DM25 or DM250 means that glucose was the carbon source. Chloramphenicol (30mg/ml) or kanamycin (50mg/ml) were added as needed.
Genetic techniques and b-galactosidase assay: ThelamB– lacZtranscriptional fusion was moved into the ancestral or derived backgrounds by P1 transduction, using P1vir(Miller 1992), strain BW2951 as donor, and selecting for kanamycin resistance. Theb-galactosidase activities were assayed by use of o-nitrophenylb-d-galactopyranoside as a substrate and were calculated as micromolars ofo-nitrophenol per minute per milligram of cellular protein (Miller1992). All activity values reported are the average of three independent experiments.
Protein preparation and two-dimensional polyacrylamide gel electrophoresis:Cultures were incubated at 37°for 24 hr in DM250 medium. Cell pellets were harvested by centrifugation at 50003g, washed once with 50 mmTris, pH 8, resuspended in 200ml of 50 mmTris, 0.2mDTT, 0.3% SDS (w/v), and 1 mm EDTA, and boiled for 5 min. Twenty microliters of 50 mmTris, pH 7.5, 50 mmMgCl2, containing 1 mg/ml DNase I and 0.25 mg/ml RNase A (Roche), were added to the cell extracts and the resulting suspensions were incubated for 10 min at 4°. Finally, proteins were solubilized by adding 800ml of buffer containing 10murea, 4% NP40 (v/v), 0.1mDTT, and 2.2% ampholines with a pH range from 3 to 10 (v/v) (Amersham Pharmacia). Protein samples were stored at20°.
Two-dimensional polyacrylamide gel electrophoresis (PAGE) was performed using a Multiphor II system (Amersham Phar-macia) for isoelectrofocalization and the Protean II xi cell (Bio-Rad, Hercules, CA) for SDS–PAGE. Dry strips (laboratory made, 18 cm, pH range from 4 to 8) were hydrated in the protein samples (500mg) prepared in 2mthiourea, 5murea, 1.6% 3-½ (3-cholamidopropyl)-dimethylammonio-1-propanesulfonate (w/v),
100mmDTT, and 0.8% ampholines (v/v). Isoelectrofocaliza-tions were run until pH equilibrium was reached (Lelongand Rabilloud2003). These strips were equilibrated for 10 min in Tris, pH 6.8, containing 2.5% SDS (w/v), 30% glycerol (v/v), 6murea, and 50 mmDTT. This step was repeated in the same buffer, with DTT replaced by 100 mmiodoacetamide. For the second-dimension electrophoresis, SDS–PAGE was performed as described (Laemmli1970), using 12% acrylamide gels, with the following modifications: cathode and anode migration buffers consisted of 50 mmTris, 0.1% SDS (w/v) with 200 mm taurine, and 380 mmglycine, respectively. Proteins were stained with either Coomassie brilliant blue R-250 or silver.
Analysis of two-dimensional protein gels:Quantitative anal-ysis of the protein gels was performed using Melanie II software (Genebio, Geneva, Switzerland). The global protein profile of the three strains (two evolved, one ancestral) was performed in triplicate from three independent cultures of each strain. Each three-part set of comparisons was performed in parallel on the same day and with the same media and solutions to produce gels with similar background and signal levels for quantitative analysis. This approach allowed us to achieve excellent reproducibility by making gel parameters maximally consistent for each set of comparisons. Our quan-titative analysis proceeded in three steps as follows. First, for every protein spot on each gel, we calculated its relative abun-dance as the ratio between its volume and the total volume of all spots on the same gel. Volume is defined as a function of optical density integrated over the spot area. Second, changes in protein expression of each evolved clone were standardized using the ancestor as a reference. Thus, a value of 2.0 means that the relative abundance of a particular protein was twice as high in the evolved clone as in its ancestor, whereas a value of 0.5 indicates that the relative abundance in the evolved clone was only half that in the ancestor. Third, the mean and stan-dard deviations of the stanstan-dardized values were computed for each spot from the three replicate gels, and the data were analyzed statistically using the R-package 0.5.13 software. In particular, two-tailed t-tests were used to determine whether the expression of a particular protein in an evolved clone was greater or less than 1 (i.e., the null expectation in the absence of any evolutionary change) usingP,0.05 as the criterion for statistical significance. Although our statistical analyses used data that were standardized relative to the total abundance integrated over all protein spots, for purposes of illustration we identify two proteins, AhpC and GapA, as ‘‘internal standards’’ because their relative abundance was nearly constant over all three genetic backgrounds and all three sets of gels.
Electrophoresis and immunoblot analyses of proteins:Cells were grown in triplicate in DM250 medium for the time indi-cated. Cell pellets were resuspended in lysis buffer (70 mm Tris, pH 7.4, 1 mmEDTA, 10% glycerol, 1 mmDTT) before son-ication. The lysates were centrifuged at 10,0003gfor 30 min at 4°, and total protein concentrations were determined using the Bradford protein assay kit (Bio-Rad) and bovine serum albumin as a standard. Equal amounts of protein samples were analyzed by SDS–polyacrylamide gel electrophoresis. Prestained protein standards (Amersham, Buckinghamshire, UK) were used for molecular weight estimation. Immunoblot analyses of proteins electrotransferred (Bio-Rad) onto poly-vinylidene difluoride membranes (Amersham Pharmacia) were performed with polyclonal antibodies raised against LamB (courtesy of A. Meinke, Intercell AG), and monoclonal anti-bodies raised against RpoA as an internal standard (courtesy of M. Cashel). The blots were developed using nitro blue tetrazo-lium/5-bromo-4-chloro-3-indolyl-phosphate (Sigma, St. Louis) systems.
Strain construction: Each evolvedmalTallele was recom-bined into the chromosome of the ancestral clone using suicide plasmid pKO3, which has a temperature-sensitive rep-lication origin (Link et al. 1997), as described previously (Crozat et al.2005). Briefly, the evolved malTalleles were cloned into pKO3, and the resulting plasmids were electro-transformed into the ancestor clone. Integration of the evolved allele into the ancestral malT gene was selected by plating transformed cells on chloramphenicol–LB agar and incubat-ing at high temperature. Chloramphenicol-resistant cells were subsequently plated on sucrose-containing LB agar to select for plasmid loss, as the plasmid carriessacB, which renders cells sensitive to killing by sucrose. Sucrose-resistant and chloram-phenicol-sensitive plasmid-free clones were then screened for the presence of the evolved malTalleles either by a PCR– restriction fragment length polymorphism (PCR–RFLP) ap-proach usingPauI (Euromedex) to distinguish between ances-tral and evolved alleles, in the case of the Ara1 population, or by characterizing the length of the PCR product containing the malTancestral or evolved allele, in the case of the Ara1 1 population. All constructed strains were also ‘‘deconstructed’’ such that the evolved alleles were replaced by their ancestral counterparts. Reversion of the relevant phenotypes (fitness, Western blots) was always confirmed in these deconstructed strains, indicating the absence of secondary mutations during the strain construction process. The same strategy was used to move the upregulated constitutivemalTallele from BW3216 into the ancestor.
Fitness assays: Isogenic ancestral strains with the intro-duced evolved malT alleles competed against the ancestor carrying the originalmalTallele and the opposite neutral Ara marker (Lenskiet al. 1991). Each pairwise competition was replicated sixfold, with competitions performed in the same medium as the evolution experiment for 6 days with 1:100 daily transfers to allow detection of small fitness effects. Fitness assays thus encompass all the same phases of population growth that occurred in the evolution experiment, including lag phase, exponential growth, and stationary phase (Vasiet al. 1994). Immediately prior to each assay, the competitors were separately acclimated to the same regime and then transferred together from stationary-phase cultures into fresh medium (with 1:200 dilution each and thus 1:100 combined). Samples were taken immediately after mixing at day 0 and again after 6 days of competition to measure the abundance of the competitors; at both times, all the cells are in stationary phase (24 hr after the previous transfer). From the initial and final cell counts and the known dilution factors, we calculated the realized (net) population growth of each competitor. Fitness was then calculated as the ratio of the realized growth rates of
the two strains during their direct competition, andt-tests were performed to evaluate whether the measured fitness values differed significantly from the null hypothetical value of 1.
Measurement of the mutation rate from Mal1to Mal:A Luria–Delbru¨ck fluctuation test (Luriaand Delbru¨ ck1943) was performed to estimate the mutation rate from Mal1
to Malusing 60 replicate cultures. Independent cultures were each founded from a small number (100) of cells of the Mal1 ancestor in flasks containing 10 ml of DM25. After 24 hr, each culture was diluted, several hundred cells were spread on tetrazolium–maltose indicator plates, and Mal1
(pink) and Mal(red) colonies were counted. These data yielded the total number of cells and the frequency of Malmutants in each culture, from which the rate of mutation from Mal1
to Mal was estimated (Leaand Coulson1949; Maet al.1992).
Evolutionary dynamics ofmalTsubstitutions:The approx-imate time of origin and the subsequent dynamics of themalT mutations that were substituted in each focal population were investigated using a PCR–RFLP strategy with clones isolated from samples frozen at various generations during the long-term evolution experiment. For population Ara1, numer-ous clones from generations 2500, 3000, 4000, and 5000 were subjected to PCR using primers ODS273 (59-GTCGCTGCTGG AAGAGTCGC-39) and ODS304 (59-ACCACGGGCCAGCGAG CATT-39). The presence or absence of the evolvedmalT muta-tion was determined byPauI digestion of the PCR products. For population Ara11, numerous clones from generations 4000, 5000, 7000, and 10,000 were subjected to PCR using primers ODS291 (59-CAGCCCCTGACGCTCAATCT-39) and ODS302 (59-GCAGAATACCCACTCAGCCC-39). The size of the PCR product was used to score themalTallele as either ancestral or evolved.
Evolutionary dynamics of the growth capacity on maltose: Numerous clones were isolated from population Ara11 at generations 2000, 3000, 4000, 5000, and 7000 (for the last three time points, the same clones as those analyzed to ascertain the dynamics of themalTsubstitutions were used) and from population Ara6 at generations 2000, 3000, 4000, 5000, 6000, 7000, and 9000. All clones were grown at 37°in DM medium supplemented with 250mg/ml maltose to score their growth ability using the following criteria. Growth within 8 hr of incubation was interpreted as a Mal1
phenotype, whereas no growth even after 24 hr indicated the inability to use maltose as the sole carbon source (Mal). Also, growth within 24 hr but without any detectable growth after 8 hr was inter-preted as the occurrence of suppressor mutations in those clones restoring growth (MalS; see results). In all cases,
growth was characterized by a sustained increase in viable cell counts and optical density.
RESULTS
spots, representing 6–10% of the entire coding capacity of theE. coligenome, and we observed similar numbers in our gels. Figure 1 shows a pair of representative gels comparing the ancestor and one evolved clone. Quan-titative analysis of the three replicate sets of gels for all three clones was performed using the Melanie II software (Genebio), as described in materials and methods. We first standardized the abundance of each
protein spot relative to the total abundance of all spots on the same gel. We then expressed any evolved change in the expression of a given protein by calculating the ratio of its standardized abundance in an evolved clone to that in the ancestor, using the values obtained in the same gel set. The three replicate sets of gels thus gave
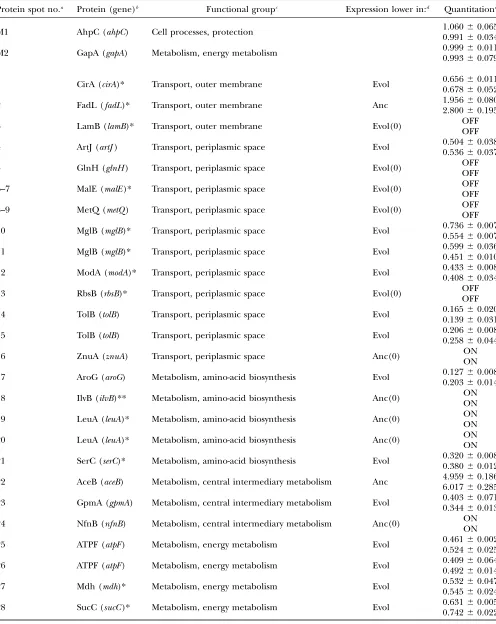
three estimates of the extent of change in expression level for a given protein in each evolved clone, and these estimates were used to test whether a change was statistically significant. Table 1 provides the identity of all the protein spots whose relative abundance changed significantly in one or both evolved clones. It also in-cludes two reference proteins whose abundances were quite constant among the ancestral and evolved clones and over all three replicate sets of gels. A total of 60 spots showed significant changes in one or both of the evolved clones. However, 12 proteins were each identi-fied in two different spots, where the duplicate forms represent post-translational modifications or degrada-tion products; in all 12 cases, the two different forms Figure 1.—Two-dimensional protein gel electrophoresis of the ancestor and an evolved clone. Protein extracts were prepared from cultures grown in DM250 me-dium for 24 hr at 37°. Laboratory-made dry strips (18 cm, pH range from 4 to 8) were hydrated in 500-mg protein samples from the ancestral strain (A) and from an evolved clone isolated at gen-eration 20,000 from population Ara11 (B). The steady-state isoe-lectrofocalization patterns were analyzed by 12% acrylamide-bis SDS–PAGE and Coomassie blue staining. Protein spots numbered M1 and M2 did not show any vari-ation among the three genotypes analyzed but are shown as internal standards (h) (see Table 1). (s)
Protein spots modified in both evolved clones. Spots decreasing or disappearing in both evolved clones are marked on the ancestral protein pattern (A); spots increas-ing or appearincreas-ing in both evolved clones are marked on the evolved protein pattern (B). (n) Protein
spots modified only in the Ara11 evolved clone. (,) Protein spots
TABLE 1
Identity of protein spots that differ between the ancestor and evolved clones and two protein spots shown as internal standards for visualization
Protein spot no.a Protein (gene)b Functional groupc Expression lower in:d Quantitatione
M1 AhpC (ahpC) Cell processes, protection 1.06060.065
0.99160.034
M2 GapA (gapA) Metabolism, energy metabolism 0.99960.011
0.99360.079
1 CirA (cirA)* Transport, outer membrane Evol 0.65660.011
0.67860.052
2 FadL (fadL)* Transport, outer membrane Anc 1.95660.080
2.80060.195
3 LamB (lamB)* Transport, outer membrane Evol(0) OFF
OFF
4 ArtJ (artJ) Transport, periplasmic space Evol 0.5040.536660.0380.037
5 GlnH (glnH) Transport, periplasmic space Evol(0) OFF
OFF
6–7 MalE (malE)* Transport, periplasmic space Evol(0) OFF
OFF
8–9 MetQ (metQ) Transport, periplasmic space Evol(0) OFF
OFF
10 MglB (mglB)* Transport, periplasmic space Evol 0.73660.007
0.55460.007
11 MglB (mglB)* Transport, periplasmic space Evol 0.59960.036
0.45160.010
12 ModA (modA)* Transport, periplasmic space Evol 0.43360.008
0.40860.034
13 RbsB (rbsB)* Transport, periplasmic space Evol(0) OFF
OFF
14 TolB (tolB) Transport, periplasmic space Evol 0.16560.020
0.13960.031
15 TolB (tolB) Transport, periplasmic space Evol 0.20660.008
0.25860.044
16 ZnuA (znuA) Transport, periplasmic space Anc(0) ON
ON
17 AroG (aroG) Metabolism, amino-acid biosynthesis Evol 0.12760.008
0.20360.014
18 IlvB (ilvB)** Metabolism, amino-acid biosynthesis Anc(0) ON
ON
19 LeuA (leuA)* Metabolism, amino-acid biosynthesis Anc(0) ONON
20 LeuA (leuA)* Metabolism, amino-acid biosynthesis Anc(0) ON
ON
21 SerC (serC)* Metabolism, amino-acid biosynthesis Evol 0.32060.008
0.38060.012
22 AceB (aceB) Metabolism, central intermediary metabolism Anc 4.95960.186
6.01760.285
23 GpmA (gpmA) Metabolism, central intermediary metabolism Evol 0.40360.071
0.34460.013
24 NfnB (nfnB) Metabolism, central intermediary metabolism Anc(0) ON
ON
25 ATPF (atpF) Metabolism, energy metabolism Evol 0.46160.002
0.52460.025
26 ATPF (atpF) Metabolism, energy metabolism Evol 0.40960.064
0.49260.014
27 Mdh (mdh)* Metabolism, energy metabolism Evol 0.5320.545660.0470.024
28 SucC (sucC)* Metabolism, energy metabolism Evol 0.63160.005
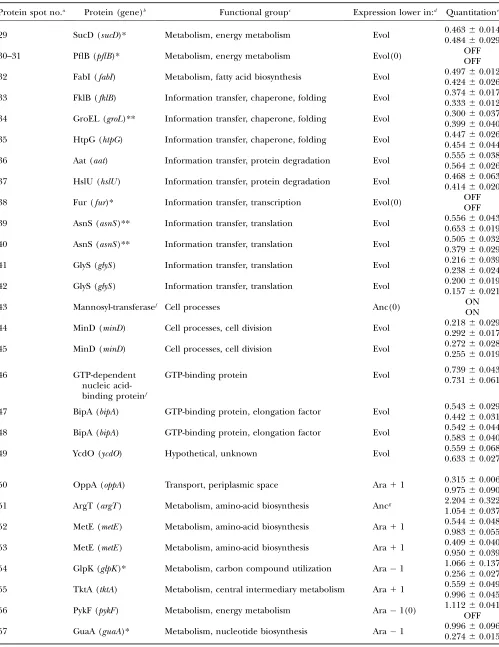
TABLE 1
(Continued)
Protein spot no.a Protein (gene)b Functional groupc Expression lower in:d Quantitatione
29 SucD (sucD)* Metabolism, energy metabolism Evol 0.4630.484660.0140.029
30–31 PflB (pflB)* Metabolism, energy metabolism Evol(0) OFF
OFF
32 FabI (fabI) Metabolism, fatty acid biosynthesis Evol 0.49760.012
0.42460.026
33 FklB (fklB) Information transfer, chaperone, folding Evol 0.37460.017
0.33360.012
34 GroEL (groL)** Information transfer, chaperone, folding Evol 0.30060.037
0.39960.040
35 HtpG (htpG) Information transfer, chaperone, folding Evol 0.44760.026
0.45460.044
36 Aat (aat) Information transfer, protein degradation Evol 0.55560.038
0.56460.026
37 HslU (hslU) Information transfer, protein degradation Evol 0.46860.063
0.41460.020
38 Fur (fur)* Information transfer, transcription Evol(0) OFFOFF
39 AsnS (asnS)** Information transfer, translation Evol 0.55660.043
0.65360.019
40 AsnS (asnS)** Information transfer, translation Evol 0.50560.032
0.37960.029
41 GlyS (glyS) Information transfer, translation Evol 0.21660.039
0.23860.024
42 GlyS (glyS) Information transfer, translation Evol 0.20060.019
0.15760.021
43 Mannosyl-transferasef Cell processes Anc(0) ON
ON
44 MinD (minD) Cell processes, cell division Evol 0.21860.029
0.29260.017
45 MinD (minD) Cell processes, cell division Evol 0.27260.028
0.25560.019
46 GTP-dependent
nucleic acid-binding proteinf
GTP-binding protein Evol 0.7390.731660.0430.061
47 BipA (bipA) GTP-binding protein, elongation factor Evol 0.54360.029
0.44260.031
48 BipA (bipA) GTP-binding protein, elongation factor Evol 0.54260.044
0.58360.040
49 YcdO (ycdO) Hypothetical, unknown Evol 0.55960.068
0.63360.027
50 OppA (oppA) Transport, periplasmic space Ara11 0.31560.006
0.97560.090
51 ArgT (argT) Metabolism, amino-acid biosynthesis Ancg 2.20460.322
1.05460.037
52 MetE (metE) Metabolism, amino-acid biosynthesis Ara11 0.54460.048
0.98360.055
53 MetE (metE) Metabolism, amino-acid biosynthesis Ara11 0.40960.040
0.95060.039
54 GlpK (glpK)* Metabolism, carbon compound utilization Ara1 1.06660.137
0.25660.027
55 TktA (tktA) Metabolism, central intermediary metabolism Ara11 0.55960.049
0.99660.045
56 PykF (pykF) Metabolism, energy metabolism Ara1(0) 1.112OFF60.041
57 GuaA (guaA)* Metabolism, nucleotide biosynthesis Ara1 0.99660.096
showed very similar evolutionary changes. Thus, 48 proteins showed significant changes in expression in one or both populations. Thirty-eight of these proteins changed in both independently evolved clones and, strikingly, all 38 had evolved in the same direction relative to the ancestral expression level, indicating strong evolutionary parallelism. Parallel changes across lineages are often indicative of adaptive evolution, and thus these 38 proteins are of particular interest. Seven parallel changes reflect increased expression of pro-teins in the evolved clones, including 5 propro-teins without any detectable expression in the ancestor. The other 31 parallel changes indicate reduced expression in the evolved clones, including 7 proteins with no measur-able expression in either evolved clone. Two protein spots that differ between the ancestor and the evolved clones confirm previous mutations identified using inser-tion sequence elements as molecular markers in these long-term populations (Papadopouloset al.1999). In
particular, IS-associated deletions of the rbs operon, including its promoter region, were found in all 12 populations (Cooperet al.2001), and thepykFgene was
inactivated by an IS transposition in population Ara1 (Schneideret al.2000). Here, we observed the parallel
loss of RbsB, the D-ribose-binding periplasmic protein, in both focal populations, consistent with these known deletions. By contrast, PykF (pyruvate kinase I) disap-peared only in population Ara1, with no significant change in expression in population Ara11 (Table 1). These same mutations also explain why parallel changes at the transcription level were seen in these same clones for therbsoperon, but not forpykF(Cooperet al.2003).
The 38 proteins that evolved parallel changes in ex-pression were grouped into broad functional categories according to GenProtEC (http://genprotec.mbl.edu/). Interestingly, most of these proteins belong to just two functional groups. Twelve of them function in trans-port, especially periplasmic-binding proteins involved in sugar, amino-acid, and ion transfers. Two of these transport proteins, FadL and ZnuA, are among the 7 proteins that showed parallel increases in their expres-sion during evolution. Thirteen of them function in metabolism, especially energy metabolism, central me-tabolism, and amino-acid biosynthesis. Four metabolic TABLE 1
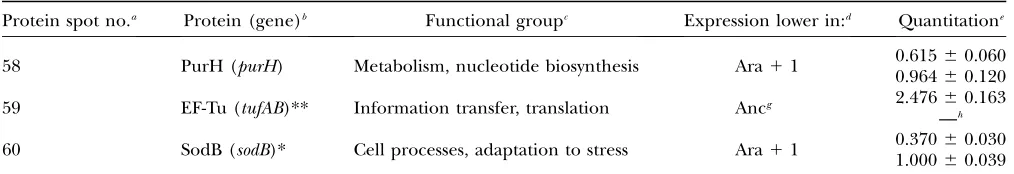
(Continued)
Protein spot no.a Protein (gene)b Functional groupc Expression lower in:d Quantitatione
58 PurH (purH) Metabolism, nucleotide biosynthesis Ara11 0.6150.964660.0600.120
59 EF-Tu (tufAB)** Information transfer, translation Ancg 2.47660.163
—h
60 SodB (sodB)* Cell processes, adaptation to stress Ara11 0.37060.030
1.00060.039 a
The protein spots M1 and M2 show similar intensities across all genotypes and serve as internal standards for visualization only (Figure 1). Protein spots 1–49 show significant and parallel changes in the two independently evolved clones compared to their ancestor (sin Figure 1). Protein spots 50–60 show significant changes in only one of the two evolved clones (nand,in Figure 1).
Some proteins were identified in two different spots; this pattern corresponds to post-translational modifications or to degradation products (in each case, both protein spots showed the same changes in the evolved clones).
bRegulation by cAMP–CRP and ppGpp is indicated by ‘‘*’’ and ‘‘**,’’ respectively, for the functionally characterized genes (Cashel et al.1996 and Salgado et al.2004 for the table; Manet al.1997 for serC; Zhanget al.2005 for sodB; Zhenget al. 2004 formodA,kbl, andleuA; Traxleret al.2006 forasnS).
cFunctional groupings of the proteins are shown according to the data from GenProtEC (http://genprotec.mbl.edu). dAnc, expression lower in the ancestor clone; Anc(0), proteins absent from the ancestor but appearing in both evolved clones; Evol, expression lower in both evolved clones; Evol(0), proteins disappearing in both evolved clones; Ara11, expression lower than in the ancestor only in the Ara11 evolved clone; Ara1, expression lower than in the ancestor only in the Ara1 evolved clone; Ara1(0), protein spot disappearing in the Ara-1 evolved clone.
e
Quantitative gel analysis was performed using the Melanie II software (Genebio). For every spot, the protein expression of each evolved clone was standardized using the ancestral strain as a reference, after first standardizing for total protein volume over all spots (seematerials and methods). For example, a value of 2.0 indicates that the relative abundance of a particular protein spot is twice as high in an evolved clone as in the ancestor, whereas a value of 0.5 indicates that the relative abundance of a protein in the evolved clone is only half that measured in the ancestor. The upper and lower entries for each protein are relative abundances measured in the Ara11 and Ara1 evolved clones, respectively. Mean values are shown along with standard deviations based on the three independent sets of gels. OFF, protein spots absent in the evolved clones, but present in the ancestor. ON, protein spots absent in the ancestor, but present in the evolved clones.
fBased on protein sequence comparisons. A gene name could not be assigned. gArgT and EF-Tu are significantly higher only in the Ara11 evolved clone.
proteins—IlvB, LeuA, AceB, and NfnB—are among the 7 that evolved parallel increases in their expression levels. Genes that encode transport and metabolic func-tions represent 10 and 18% of the E. coli genome, respectively; hence, these two categories appear to be substantially overrepresented among those found to have undergone parallel evolutionary changes in pro-tein expression.
Comparison of protein and transcription profiles:
The same set of clones used in this study were previously analyzed using macroarrays to measure changes in their global transcription profiles (Cooper et al. 2003),
al-lowing us to compare the changes found by the two methodologies. To the best of our knowledge, this is the first such comparison between mRNA and protein levels in an evolutionary context, where the magnitude of expression changes is often quite subtle. We should also emphasize, however, that the culture conditions and physiological state of cells were somewhat different in the two studies: the global mRNA levels were measured in the exact same medium as in the evolution experi-ment (DM25) and during exponential growth, whereas we prepared protein extracts from stationary-phase cells grown in DM250. This methodological difference re-flected the need for larger quantities of protein to perform two-dimensional protein electrophoresis and to quantify a reasonable number of proteins. Neverthe-less, the proteomic data support the transcription pro-filing in four important respects.
i. Several dozen genes exhibit altered expression levels in both of the independently evolved focal populations. The macroarrays revealed 59 genes that had altered mRNA levels in both populations of the entire set ofE. coligenes, while protein profiles showed that 38 spots had changed in both evolved populations of the several hundred that were visualized.
ii. In each data set, all changes that affected both pop-ulations were parallel. In other words, the changes relative to the common ancestor were in the same direction in both independently evolved clones. Under the null hypothesis that differences reflect random and unpredictable effects during either evolution or sample preparation, one would not expect to see such striking directional correspon-dence. Therefore, the differences revealed by these approaches are almost certainly physiologically rel-evant and caused by beneficial mutations that were substituted during the 20,000 generations of exper-imental evolution.
iii. According to both methods, most but not all of the parallel changes involved decreased expression. iv. Both approaches implicate parallel changes in
expression levels in the same functional categories of genes, including especially transport and binding proteins as well as those involved in metabolism.
Moreover, when we examine in greater detail the lists of genes with parallel changes, important commonali-ties emerge between mRNA and protein expression at two regulatory levels. First, although the genes that were identified by parallel expression changes using the two methodologies were different, most in fact belong to the same global regulatory network. In particular, approx-imately half (17/35) of the parallel expression changes for functionally characterized proteins detected by pro-tein profiling (Table 1) correspond to genes regulated by guanosine tetraphosphate (ppGpp) and cAMP– cAMP receptor protein (cAMP–CRP), which is itself under the control of ppGpp ( Johanssonet al.2000). In
the macroarray study, also about half of the functionally characterized genes with parallel expression changes were regulated by ppGpp and cAMP–CRP (Cooper et al. 2003). This pattern led to the discovery of bene-ficial mutations in thespoTgene, which encodes a pro-tein involved in synthesis and degradation of ppGpp, the molecular effector of the stringent response, which is the global regulatory network involved in adaptation to nutritional stresses (Cashel et al. 1996). Thus, despite
little strict identity in the gene targets identified using macroarrays and proteomics, strong correspondence was revealed by the shared regulatory network overlying many of the parallel expression changes seen after 20,000 gen-erations of evolution. Therefore, both parallel changes observed after 20,000 generations of experimental evolu-tion using mRNA and protein profiling methodologies, although measured under slightly different environ-mental conditions, reflect the same underlying muta-tional basis of adaptation. However, this evolved change in the regulation of the stringent response evidently caused different subsets of genes in this network to be affected during exponential growth in DM25 medium vs.stationary phase in DM250.
Second, at the lower level of genes and operons, two parallel expression changes were detected using both methodologies. Specifically, expression of both the ribose operon and the maltose regulon decreased after 20,000 generations of experimental evolution (Table 1; see Cooperet al.2003 for mRNA data). These changes
may therefore reflect beneficial mutations in these regulons. Indeed, deletions of the rbs operon were found previously in all 12 of the evolved populations, thus explaining the loss of expression of those genes, and these mutations were also shown to be beneficial by competitions between otherwise isogenic strains (Cooper et al. 2001). Given the existence of this
in-formation for the ribose operon, we therefore further investigated the maltose regulon in both focal popula-tions (seeParallel substitutions inmalT,the transcriptional activator of the maltose regulon).
expression levels were in the same direction compared to the ancestral values. These differences might, in principle, indicate mutational changes in the coding se-quence or post-transcriptional regulation of the rele-vant genes in the population where no transcriptional differences were observed. Alternatively, occasional dis-crepancies might reflect the vagaries of statistical ana-lyses. In support of the latter explanation, we note that the transcription level differed significantly between the two evolved populations in only one of these six instances (nfnB: t ¼ 3.0483, d.f. ¼ 6, two-tailed P ¼
0.0226 using data from http://myxo.css.msu.edu/ecoli/ arrays).
Parallel substitutions in malT, the transcriptional ac-tivator of the maltose regulon: Sequencing the malT gene in both evolved clones from 20,000 generations revealed a 25-bp internal deletion in population Ara1 1, leading to a truncated protein and a point mutation in population Ara1 (Figure 2). To investigate further the extent of genetic parallelism, we sequenced the malTgene in one evolved clone isolated at 20,000 gen-erations from each of the other 10 long-term popula-tions. Nine more mutations were found in this gene in 6 of the other populations. Therefore, including the 2 focal populations, a total of 11 mutations were found in malTspread among 8 of the 12 populations (Figure 2). Such strong parallelism suggests that these mutations
have a beneficial effect on fitness in the glucose-limited environment of the evolution experiment, and this hy-pothesis will be tested in a later section. Two mutations were found in population Ara 4, 3 in population Ara16, and 1 in each of six other populations. Four of the 12 populations became mutators during the evolu-tion experiment (Sniegowskiet al.1997; Cooperand
Lenski 2000), including both populations that
sub-stituted multiple mutations inmalT. Populations Ara1 1 and Ara12 acquired small internal deletions, while all other substitutions in malTwere nonsynonymous point mutations. The MalT protein contains four do-mains, and the various point mutations affect all four domains in different evolved populations: 2 in DT1, 2 in DT2, 4 in DT3, and 1 in DT4 (Figure 2). The diversity of affected domains implies that the hypothesized benefi-cial affect does not depend on the precise location of the mutation, and it is also consistent with mutations that reduce MalT activity. Because MalT is a transcrip-tional activator, we also predict that the populations that evolved mutations in malT have reduced growth on maltose, which we test in the next section.
Phenotypic effects of the evolved malTalleles: Iso-genic strains with the ancestralmalTallele, the Ara1 evolved allele, or the Ara11 evolved allele were con-structed as described inmaterials and methods. Two
phenotypic tests were performed for these three iso-genic strains and for all 12 evolved clones from which the malT gene was sequenced; a third test was per-formed using only the three isogenic strains. First, we examined the growth ability of the entire set of strains in minimal medium with maltose as the sole carbon source (Figure 3A). Second, we assayed the amount of the membrane maltoporin LamB (Figure 3B), which is encoded bylamB, one of the targets of the MalT tran-scriptional activator (Szmelcmanand Hofnung1975).
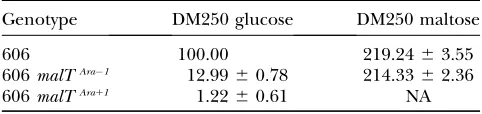
Protein extracts were prepared from all strains after growth in either glucose or maltose minimal medium. These extracts were analyzed by Western blotting with polyclonal antibodies raised against LamB (A. Meinke, Intercell AG) and with monoclonal antibodies against RpoA (M. Cashel, National Institutes of Health) as an internal standard. Third, transcriptional activities of the lamB promoter were investigated in the three ancestral strains that are isogenic except for themalT allele (Table 2). A lamBTlacZ operon fusion was in-troduced by transduction (see materials and meth-ods) in the three strains andb-galactosidase activities
were measured during growth in either glucose or mal-tose minimal medium.
On the whole, these experiments showed reductions in the activity of the maltose regulon associated with the malTmutations (Figure 3), consistent with the predicted loss of function of the MalT transcriptional activator. In particular, mostmalTmutations were associated with the absence of growth in DM250 maltose and the loss of the LamB protein, confirming the two-dimensional protein Figure2.—Schematic structure of the MalT protein and
lo-cation of evolved mutant alleles. The protein is composed of four domains (Danot2001; Richetet al.2005): DT1 (residues 1–241), DT2 (residues 250–436), DT3 (residues 437–806), and DT4 (residues 807–901). DT1 binds ATP and contains surface determinants involved in the binding of repressor proteins, including Aes, MalK, and MalY. DT2 and DT3 are involved in maltotriose binding and represent putative multi-merization domains. DT4 corresponds to the DNA-binding domain and presumably recruits RNA polymerase. ThemalT gene was sequenced in one clone isolated at 20,000 gen-erations from each of the 12 populations designated Ara
gels. These changes occurred at the transcriptional level, at least for both focal populations, because the transcriptional activity of the lamB promoter was very low in the isogenic ancestral strains carrying each of the evolvedmalTalleles during growth in glucose (Table 2). The effects of the evolved alleles were not identical, however, because the activity remaining for the Ara1 malTallele was higher than for the Ara11 allele (see below).
However, there were three exceptions to the overall pattern summarized above. First, the evolved clone from population Ara1, as well as the ancestral strain with the corresponding evolved malT allele, showed the ancestral phenotype when grown in DM250 maltose (Figure 3A and Table 2). However, a strong decrease of both the LamB protein level of the evolved clone (Figure 3B) and thelamB promoter activity (Table 2) was detected in glucose minimal medium. Therefore, this particular evolved mutation appears to affect the basal activity of the MalT transcriptional activator during growth on glucose, leaving unchanged the induction level during growth on maltose. Second, the evolved clone sampled from population Ara4 grew perfectly well in maltose minimal medium and had ancestral levels of LamB in both glucose and maltose
minimal media, despite having two nonsynonymous point mutations inmalT. These mutations evidently do not affect the activity of MalT. Third, the evolved clone from population Ara13 was unable to grow on maltose and revealed a complete loss of the LamB protein (Figure 3B). However, this clone has no mutation any-where inmalT, and we also found no mutations inlamB, suggesting the presence of some (as yet unidentified) mutation in the promoter region of the malK–lamB– malM operon or in another regulator of the maltose regulon.
These few exceptions notwithstanding, the data dem-onstrate that the parallel genetic changes inmalTwere linked to parallel phenotypic losses of expression of the maltose regulon during the 20,000 generations of evolution in a glucose-limiting medium.
Beneficial fitness effects of themalTmutations:The isogenic ancestral strains with the Ara 11 or Ara 1 evolved malTallele were each competed against the ancestor carrying the wild-type malTallele under the same culture conditions that prevailed during the long-term evolution experiment (Figure 4). In each case, the genotype of interest competed against a variant of the ancestor bearing a neutral marker (arabinose utiliza-tion) that allowed the strains to be distinguished. As shown previously (Lenskiet al.1991), this marker had
no discernible effect on fitness (H0 ¼ 1, n ¼ 6, ts ¼
0.2470,P ¼0.8147). However, each evolved allele was beneficial, with fitness relative to the ancestral malT allele of 1.0146 for the Ara11 mutation (H0¼1,n¼6, ts ¼5.5603, P ¼ 0.0026) and 1.0044 for the Ara 1 mutation (H0 ¼ 1, n ¼ 6, ts ¼ 5.8080, P ¼ 0.0021). Although these fitness increments are small, both are highly significant when measured over several days in replicated experiments. Moreover, these gains were eliminated when each evolved allele was replaced again by the ancestral allele (data not shown), confirming that the gains were caused by themalTmutations rather than by some hypothetical secondary mutations that might have accidentally occurred during the strain construc-tions. Also, when assayed in an environment where glucose was replaced by maltose, the Ara 1 malT Figure3.—Phenotypic tests of MalT activity. The ancestral strain is labeled 606. One evolved clone was isolated at 20,000 generations from each of the 12 populations desig-nated Ara 1–Ara-6 and Ara 1 1–Ara 1 6. A malT -deleted strain (DmalT) served as a control. (A) Growth ability in DM250 maltose at 37°. 1, Growth after 8 hr; , no growth even after 24 hr. (B) Relative level of LamB protein. Cellular extracts were prepared from all strains after overnight culture in DM250 medium. Each sample contained 20mg of total protein and was subjected to 12% SDS–PAGE and immunoblot analysis with polyclonal antibodies against LamB (anti-LamB) or RpoA (anti-RpoA) as a control. (C) The number of mutations identified inmalTin each population is indicated.D, deletion allele; Anc, ancestral state.
TABLE 2
Expression of a transcriptional fusionlamB–lacZ
Genotype DM250 glucose DM250 maltose
606 100.00 219.2463.55
606malTAra1 12.9960.78 214.3362.36
606malTAra11 1.2260.61 NA
evolved allele was neutral (data not shown). The Ara11 evolved allele could not be assayed in this second en-vironment because it confers a Mal
phenotype and, therefore, its fitness is effectively zero.
To examine further whether the beneficial effects conferred by the evolvedmalTalleles were caused by the decreased activity of MalT, we introduced an upregu-lated mutant allele ofmalTinto the ancestral strain. This allele was obtained from an evolved clone isolated from another evolution experiment performed in a che-mostat environment (Notley-McRobb and Ferenci
1999), where it conferred a growth advantage. When introduced into our ancestral strain, it conferred high constitutive expression of the maltose regulon, as detected by high levels of LamB in glucose minimal medium (data not shown). When assayed by compet-itions in our serial-transfer regime, the upregulated malTallele was very detrimental (H0 ¼1,n ¼6, ts ¼
8.1517,P¼0.0005; Figure 4), confirming that low MalT activity is indeed beneficial in this environment.
Like the malTmutations, therbs deletions also con-ferred only a small fitness benefit (Cooperet al.2001).
This small benefit acted in concert with an unusually high mutation rate from Rbs1
to Rbs, leading to the rapid substitution of the rbs mutations in all 12 pop-ulations. To investigate whether a high mutation rate might also have influenced the parallel substitutions in malT, we performed a fluctuation test with 60 indepen-dent cultures to measure the ancestor’s rate of mutation from Mal1
to Mal. To analyze the data, we employed a
program written by P. J. Gerrish (Los Alamos National Laboratory) that generates expected Luria–Delbru¨ ck distributions according to the method of Ma et al.
(1992) and then uses maximum likelihood to refine the mutation rate estimate. This procedure gave a muta-tion rate of 4.23106/cell/generation. The entire
mal-tose regulon is 30,000 bp. Excluding third positions (synonymous) and other sites where nonsynonymous mutations would not cause a Mal phenotype leaves
10,000 bp that could be mutated to produce a Mal phenotype. The resulting mutation rate from Mal1
to Mal
is thus 43 1010/bp, which is close to typical
mutation rates estimated previously for E. coli(Drake
1991; Lenski et al. 2003). Therefore, locus-specific
hypermutability does not contribute to the parallel substitutions observed inmalTduring the long-term evo-lution experiment. Also, given the small fitness effects of the evolvedmalTalleles relative to some other bene-ficial mutations observed in the long-term experiment, some of which are10% (Lenskiand Travisano1994;
Cooperet al.2003; Crozatet al.2005), we expect that
themalTmutations were substituted either fairly late in the evolution experiment or by hitchhiking with other beneficial mutations of stronger effect. We investigate these dynamics in the next section.
Genetic and phenotypic evolutionary dynamics: To examine in more detail the temporal dynamics of the appearance and substitution of the evolvedmalTalleles in populations Ara1 and Ara11, we performed PCR– RFLP experiments (see materials and methods)
using 63 clones sampled from population Ara11 and 70 clones isolated from population Ara 1. In pop-ulation Ara11, themalTmutation was present in 0/13 clones at 4000 generations, in 14/18 clones at 5000 generations, and in 32/32 clones from 7000 and 10,000 generations. In population Ara1, the evolvedmalT allele was present in 0/36 clones at 2500 and 3000 generations, in 15/16 clones at 4000 generations, and in 18/18 clones at 5000 generations. Therefore, the evolvedmalTalleles contributed to the somewhat slower fitness increase that followed the very rapid fitness gains seen over the first 2000 generations of the experiment (Lenskiand Travisano1994).
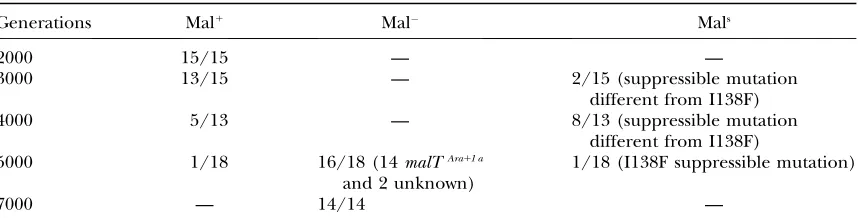
In population Ara 1 1, clones isolated at 20,000 generations and carrying the identifiedmalTmutation were unable to grow on maltose minimal medium (Figure 3A). We would therefore expect to observe two different phenotypic subpopulations during the evolution experiment: one able to grow on maltose and retaining the ancestralmalTallele and the other unable to grow on maltose and carrying the evolvedmalTallele. In fact, on the basis of the ability to grow on maltose minimal medium, we identified three different sub-populations in population Ara1 1 that coexisted be-tween 4000 and 7000 generations (Table 3). One type grew on maltose within 8 hr at 37°and was therefore phenotypically Mal1
. A second type was unable to grow Figure 4.—Fitness effects of two evolvedmalT mutations
on maltose even after 24 hr, and it was therefore phenotypically Mal. The third type showed no growth on maltose after 8 hr but strong growth after 24 hr, which we designated as MalS. We then sought to
un-derstand the molecular mechanism underlying the MalS
phenotype of the third subpopulation. ThemalTgene of the MalSclone sampled at 5000 generations (Table 3)
was sequenced. We found a nonsynonymous point mutation leading to an I138F change in domain DT1 of the MalT protein. This mutation may explain the absence of growth in the maltose medium after 8 hr. When left for 24 hr, however, this clone grew perfectly well. This culture was subsequently plated on LB agar and four isolated colonies were chosen at random. All four now showed growth on maltose minimal medium after 8 hr of growth, strongly suggesting that they had acquired suppressor mutations of the original I138F mutant allele. Sequencing malT revealed no further mutation, however, and therefore implies extragenic suppression. Therefore, this third category of evolved clones seems to have a distinct class ofmalTmutations, leading to a suppressible deficiency of maltose utiliza-tion. In any case, this third MalScategory, together with
the ancestral Mal1
category, eventually disappeared and was replaced by the nonsuppressible Mal
clones. The transient polymorphism in population Ara1 1 was even more complex at the genetic level. At 7000 generations, all Malclones carried the small internal deletion that was eventually substituted (Figure 2), but at 5000 generations some Malclones (2 of 16) did not have that samemalTdeletion allele (Table 3; the Mal1 and MalSclones also did not have the deletion allele).
Thus, the two other Malclones carried yet another non-suppressible mal mutation. At 5000 generations, the MalS evolved clone had the I138F MalT suppressible
change. The presence of the same mutation was in-vestigated by PCR–RFLP in the 10 MalSclones sampled
at 3000 and 4000 generations. They did not carry that mutation, indicating the presence of at least one more
mal allele. These data demonstrate a high level of transient diversity in the maltose regulon, with at least three phenotypic and five genotypic subpopulations pres-ent between generations 3000 and 5000 in the Ara11 population (Table 3). A second population, Ara6, was also investigated for phenotypic polymorphism. A sim-ilar degree of polymorphism was detected, with Mal1
, Mal, and MalSphenotypic subpopulations coexisting
between 3000 and 10,000 generations, before the non-suppressible Mal
allele, caused by a point mutation in the DT2 domain ofmalT, was eventually fixed.
DISCUSSION
We describe parallel evolutionary changes in protein expression profiles that occurred in two populations of E. coliduring 20,000 generations in a defined environ-ment (Lenskiet al.1991; Lenskiand Travisano1994;
Cooper and Lenski 2000; Lenski 2004). The global
transcription profiles of the same two evolved clones were previously obtained (Cooperet al.2003), allowing
a comparison between transcript and protein expres-sion for the wholeE. coli genome in this evolutionary context. Despite some differences in the culture con-ditions used to perform the transcription and protein profiles, we detected remarkable similarities in the evolved response using both global methodologies. In particular, there were many parallel expression changes, and about half of them involved genes in the same global regulatory network: the ppGpp and cAMP–CRP regulon. Parallel expression changes in this pathway were therefore a key outcome of this evolution exper-iment, and both types of global analysis of gene expression revealed the effects of these regulatory changes. In addition to the parallel changes in this global regulatory network, two other common changes of a more localized nature were detected using both DNA macroarrays and protein profiling. One was loss of TABLE 3
Phenotypic evolutionary dynamics of maltose growth ability
Generations Mal1 Mal Mals
2000 15/15 — —
3000 13/15 — 2/15 (suppressible mutation
different from I138F)
4000 5/13 — 8/13 (suppressible mutation
different from I138F)
5000 1/18 16/18 (14malTAra11 a
and 2 unknown)
1/18 (I138F suppressible mutation)
7000 — 14/14 —
Individual clones were isolated at several time points from population Ara11 and assessed for their growth capacity in DM250 maltose medium at 37°. The number of clones in each category relative to the total number of clones analyzed is given. Mal1
, growth after 8 hr; Mal, no growth after 24 hr; Mals, no growth after 8 hr but
growth after 24 hr. In relevant cases, additional data on themalTgenotype are given in parentheses. a
expression of the rbs operon, which was previously shown to be caused by beneficial mutations that were substituted in all 12 populations of the long-term evolution experiment (Cooperet al.2001). The other
common change was loss of protein expression of the maltose regulon. These parallel expression changes led us to discover a mutation inmalT, the transcriptional regulator of the maltose regulon, in both focal popula-tions. Each mutation was then moved into the ancestral chromosome, and competition experiments between each of these constructs and the malT1
ancestor re-vealed that both mutations were beneficial under the culture conditions in the evolution experiment. The analysis ofmalTwas extended to all 12 independently evolved populations, and strong genetic parallelism was detected, with malT mutations found in 8 of the 12 populations. Analyzing the expression oflamB, one of the regulatory targets of MalT, by Western blots and transcriptional fusions revealed that themalTmutations caused the loss or decrease of the maltose regulon function. By using numerous clones sampled from the two focal populations at various time points, we showed that themalTmutations were not substituted during the early period of most rapid fitness increase, but instead they contributed to the somewhat slower adaptation that occurred after 2000 generations (Lenski and
Travisano 1994). The maltose regulon also revealed
a high level of genetic and phenotypic diversity, with several subpopulations coexisting within a single pop-ulation for several thousands of generations.
As noted, slightly different growth conditions were used for the transcription (Cooperet al.2003) and
pro-teomic analyses of the evolved clones. In the case of the transcript study, cells were collected in exponential phase during growth in DM25 (25 mg glucose/ml), whereas the protein profiles were performed with cells in stationary phase from cultures in DM250 (250 mg glucose/ml) to obtain a sufficient yield of proteins for the two-dimensional protein electrophoresis. One might therefore be concerned that the two sets of data are not comparable. However, our comparisons empha-size the occurrence of beneficial mutations that affected two levels of gene regulation, rather than the precise identity of the affected genes. Thus, differences in the physiological state of the bacteria probably explain why only two identical changes were observed when we compared expression at the mRNA and protein levels in the same evolved clones. However, these changes allowed identification of two beneficial mutations in the focal populations: one already known that affects therbs operon for ribose catabolism (Cooperet al.2001) and
one discovered in this study affecting themalT transcrip-tional regulator of the maltose operons (see below). The fact that the same changes were identified under the different culture conditions may reflect the specific effects of mutations that govern expression at the operon level.
More generally, although the two methodologies de-tected parallel expression changes in different genes, about half of them belong to the stringent response pathway. Therefore, both methodologies revealed the same overarching changes in a global regulatory net-work. These high-level changes reflect mutational events that occurred during the long-term evolution experiment in genes encoding global regulators, which control the architecture of the cell’s regulatory network. In particular, changes in gene expression detected by both transcription and proteomic analyses reflect the presence of the beneficial mutations that were found inspoT(Cooperet al.2003). Thus, parallel changes in
transcription and proteomic profiles that occurred during experimental evolution reveal bacterial adapta-tion through modificaadapta-tions that occurred at multiple levels of genetic organization, ranging from the level of operons up to global regulators of genetic networks. These parallel changes in expression allowed the dis-covery of beneficial mutations that show a high degree of molecular parallelism, as mutations in the same three genes (rbs,malT,spoT) were found in at least 8 of the 12 independently evolved populations (Figure 2; Cooper et al. 2001, 2003). By contrast, no parallel mutations were found when randomly chosen genes were se-quenced (Lenski et al. 2003). These parallel genetic
changes, discovered by parallel changes in gene expres-sion, thus highlight important targets of selection and adaptation in this experiment. Genetic parallelism has also been reported in other evolution experiments using bacteriophages (Wichmanet al.1999) and
bacte-ria (Treveset al.1998), although these other studies did
not examine resulting changes in global regulatory networks.
Despite the similarities observed in the transcription and protein profiles, the maltose regulon shows some interesting exceptions. Transcription profiling found significant and parallel changes in three genes in this regulon (malK, malP, and malQ). However, the same transcription profiles reveal no significant changes in eitherlamBormalTin either focal population (four two-tailedt-tests in all, each with 6 d.f., allP.0.1, using data from Cooper et al. 2003 available at http://myxo.css.
msu.edu/ecoli/arrays). The transcriptional profiles also show no effect of an evolvedspoTallele on expres-sion of eitherlamBormalT(twot-tests, each with 6 d.f., both P . 0.1, using the same data source as above). Thus, the proteomic data resolved certain changes, such as the parallel reductions in LamB, that were not found by the transcriptional study; these changes in LamB expression were unequivocally confirmed by finding the responsible mutations inmalT. Another difference be-tween the two studies is that the transcriptional analysis found significant parallel changes in1.5% of all genes (Cooperet al. 2003), whereas in our proteomic study
may reflect post-transcriptional levels of gene reg-ulation or, alternatively, it could reflect differences in the statistical power of the two studies and their methodologies.
A new set of beneficial mutations in this long-term evolution experiment was discovered that affected the malTgene. A total of 11 mutations were found in eight different populations. Measurement of the mutation rate from Mal1
to Malin the ancestor indicated a muta-tion rate typical of other estimates for E. coli (Drake
1991). Five mutations occurred in populations that had retained the low ancestral mutation rate, with 1 muta-tion in each of five different populamuta-tions. Two of these mutations were small internal deletions with no obvious direct sequence repeats at the extremities. The 6 other mutations occurred in populations that had evolved defects in their DNA repair pathways, including 1 in population Ara 2, 2 in Ara 4, and 3 in Ara 1 6. Populations Ara 2 and Ara 4 evolved defects in methyl-directed mismatch repair (Sniegowski et al.
1997; Shaveret al.2002); all three mutations in these
populations were CG to TA transitions, which are characteristic of this class of mutators. Population Ara 1 6 evolved a mutator phenotype that was previously suggested to involve a defect inmutTon the basis of the finding that six mutations found in randomly screened genes were all AT to CG transversions (Lenski et al.
2003). All threemalTmutations found here in Ara16 were of the same class, strongly supporting the previous suggestion of amutTdefect.
The mutations found inmalTin the various popula-tions were located throughout the gene, affecting the several domains of the MalT activator protein. The MalT protein belongs to a family of bacterial transactivators characterized by high molecular mass, usually.90 kDa (Danot 2001). The MalT protein has four domains
(Figure 2): DT1 (residues 1–241), DT2 (residues 250– 436), DT3 (residues 437–806), and DT4 (residues 807– 901) (Danot 2001; Richet et al. 2005). Numerous
signals control the activity of the MalT transcriptional activator. Activation of MalT and its subsequent binding to target promoters requires the formation of a high-order MalT oligomer, induced by the maltotriose in-ducer and ATP. By contrast, the monomeric form of MalT, which is inactive, is stabilized by three different proteins: MalK, the ABC subunit of the maltose trans-porter; MalY, a cytoplasmic protein of unknown func-tion that has abC-S lyase activity; and Aes, a protein with sequence similarities to lipases that has esterase activity. The DT1 domain binds ATP (with a Walker A motif from residues 42 to 47) and the repressor proteins Aes and MalK, while DT1 and DT2 are involved in recognition of the repressor protein MalY; DT2 and DT3 are required together for strong maltotriose binding, while DT3 alone binds it with low affinity; and DT4 carries the DNA-binding site (Danot 2001; Joly et al. 2002;
Schlegelet al.2002).
ThemalTmutations in the eight evolved populations produced a Malphenotype in six cases (Ara11, Ara1 2, Ara16, Ara2, Ara3, and Ara6). In four cases, a likely mechanism can be found: populations Ara 1 1 and Ara12 have malTdeletions leading to truncated proteins without the DT2–DT4 domains and without domain DT4, respectively; the mutation in population Ara3 eliminates the threonine residue 46, which lies in the Walker A motif and is involved in ATP binding; and the mutation in population Ara2 affects the DT4 domain and may interfere with DNA-binding activity, the interaction with RNA polymerase, or both. In the two other cases, possible explanations are more specu-lative. The mutation in population Ara 6 affects the DT2 domain and might interfere with the transition from the monomeric to the oligomeric forms or, al-ternatively, with the overall conformation of MalT. A similar effect could also apply to population Ara 16, which has three mutations, one in DT2 and two in DT3. In two populations (Ara 1 and Ara 4), the malT mutations did not lead to a Mal phenotype. Despite having a Mal1
phenotype that is indistinguishable from the ancestor, population Ara4 has two mutations in malT, one in DT1 and the other in DT3. Population Ara1 has one mutation in the DT3 domain leading to reduced activity of MalT in minimal glucose me-dium, although the induction level is fully conserved in minimal maltose medium. The modified residue (R455) may therefore be involved in the affinity of maltotriose for the MalT protein. The crystal structure of DT3 has been solved and reveals eight copies of a two-helix bundle motif arranged in a right-hand super-helical fold encompassing 80% of DT3 (Steegborn et al. 2001). The structure also indicates interaction between the DT3 domains, which may explain the MalT oligomerization. Two residues are characteristic for the DT3 motif, G541 and A547, and they are well conserved in the different helices of the structure. One of the mutations found in population Ara 4 affects the A547 residue, although the MalT activity is not measurably affected. More specific studies of these mu-tations of the complex DT3 domain might give more information about its functioning.
Most of the observed mutations inmalTcaused loss of the ability to grow on maltose as a sole carbon source, a trend consistent with a previously reported tendency toward ecological specialization in these populations (Cooperand Lenski2000). Such specialization can
oc-cur by two population-genetic processes: mutation ac-cumulation, whereby neutral mutations are substituted in genes that are not maintained by selection, and anta-gonistic pleiotropy, where mutations substituted be-cause they are beneficial in the selective environment have detrimental side effects in other environments (Futuymaand Moreno1988; Rose1991; Cooperand
Lenski2000). We constructed isogenic strains with the