DOI: 10.1534/genetics.107.081216
Applying Gene Expression, Proteomics and Single-Nucleotide
Polymorphism Analysis for Complex Trait
Gene Identification
Ioannis M. Stylianou,*
,1Jason P. Affourtit,*
,2Keith R. Shockley,* Robert Y. Wilpan,*
Fadi A. Abdi,
†Sanjeev Bhardwaj,
†Jarod Rollins,* Gary A Churchill* and
Beverly Paigen*
,3*The Jackson Laboratory, Bar Harbor, Maine 04609 and†Applied Biosystems, Framingham, Massachusetts 01701 Manuscript received August 28, 2007
Accepted for publication January 16, 2008
ABSTRACT
Previous quantitative trait locus (QTL) analysis of an intercross involving the inbred mouse strains NZB/ BlNJ and SM/J revealed QTL for a variety of complex traits. Many QTL have large intervals containing hundreds of genes, and methods are needed to rapidly sort through these genes for probable candidates. We chose nine QTL: the three most significant for high-density lipoprotein (HDL) cholesterol, gallstone formation, and obesity. We searched for candidate genes using three different approaches: mRNA microarray gene expression technology to assess.45,000 transcripts, publicly available SNPs to locate genes that are not identical by descent and that contain nonsynonymous coding differences, and a mass-spectrometry-based proteomics technology to interrogate nearly 1000 proteins for differential expression in the liver of the two parental inbred strains. This systematic approach reduced the number of candidate genes within each QTL from hundreds to a manageable list. Each of the three approaches selected candidates that the other two approaches missed. For example, candidate genes such asApoa2andAcadshad differential protein levels although the mRNA levels were similar. We conclude that all three approaches are important and that focusing on a single approach such as mRNA expression may fail to identify a QTL gene.
T
HE use of animal models and quantitative trait locus (QTL) mapping has greatly aided the identifi-cation of genes that affect complex traits (Korstanjeand Paigen2002). However, identifying the causal gene
within a QTL remains a nontrivial matter. Whole-tran-scriptome profiling has advanced the gene discovery process by identifying causal genes on the basis of dif-ferential mRNA levels (Aitmanet al.1999; Johannesson et al.2005). Nonetheless, a QTL may be caused by dif-ferences that are not identifiable at the mRNA level, such as protein concentration (Doolittleet al.1990) or
protein function caused by changes in the amino acid sequence (Theunset al.2000).
In this study we combine mRNA expression with proteomics and SNP analysis to show that using a global mRNA approach alone is insufficient for identifying QTL candidate genes. Proteomic technologies are still in their infancy relative to mRNA gene expression technologies; nonetheless the ability to interrogate the proteome is improving (Pilchand Mann2006), and, as
we report here, valuable data can be gathered and
applied to the complex disease gene discovery process. In addition, mouse strains have been extensively geno-typed; indeed, many of the SNPs between strains are known and are publicly available. SNP data can be used to focus on genes in genomic regions that are not iden-tical by descent (IBD) (Peterset al.2007) and to
iden-tify amino acid changes in the protein-coding region. This allows the selection of candidates that may affect the QTL through functional changes rather than quantitative differences in mRNA and protein levels.
Typically, large-scale protein interrogation studies involve either two-dimensional (2D) gel electrophoresis followed by mass spectrometry (MS) or large-scale im-munoblotting (BD Biosciences, San Jose, CA). However, these technologies have limitations. The proteins that can be interrogated on 2D gels are limited in size and nature and require considerable effort to identify. Im-munoblotting is limited by the availability and cost of antibodies. For the identification of larger-scale com-plex proteomes, a technology for proteome analysis by MS has emerged (Aebersoldand Mann2003). This
method can be extended by coupling liquid chroma-tography withmatrix-assistedlaser-inducedionization– tandemtimeofflight (MALDI–TOF/TOF) MS. Relative and absolute quantitation of proteins by MS is possible with either labeled (Rosset al.2004; Zhenet al.2004) or
label-free (Onoet al.2006) technologies.
1Present address: University of Pennsylvania, School of Medicine,
In-stitute for Translational Medicine and Therapeutics, Philadelphia, PA 19104-6160.
2Present address:454 Life Sciences, Branford, CT 06405.
3Corresponding author: The Jackson Laboratory, 600 Main St., Bar
Harbor, ME 04609. E-mail: [email protected]
The maturation of both microarray and proteomic technologies has led to a small number of whole-transcriptome–proteome comparisons (Gygiet al.1999;
Valenzuela et al. 2003; McRedmond et al. 2004;
Ribeiro et al. 2004; Ruse et al. 2004; Mijalski et al.
2005; Pastorelliet al.2006). However, limited
quan-titative analysis of protein and transcript abundance could be performed as the starting point of these pro-teomics studies was 2D electrophoresis followed by sin-gle protein-by-protein identification using MS. In this study, to complement the microarray data, we employed a quantitative proteomics approach usingisobaric tags forrelative andabsolutequantitation (iTRAQ reagents) in combination with liquid chromatography–MALDI– TOF/TOF technology for extensive protein analysis and quantitation of two inbred mouse strains. We were able to directly identify and simultaneously quantify a total of 943 liver proteins in a gel-free MS analysis. To our knowledge this is the first attempt to correlate dif-ferentially regulated proteins with QTL to identify candi-date genes for complex quantitative phenotypes.
A systematic search for candidate genes must also include a search for nonsynonymous coding changes. This is possible for 16 inbred mouse strains with the combination of the public sequencing of C57BL/6, the sequencing of A, DBA/2 and 129 by Celera (Muralet al.
2002), and the resequencing of 15 strains by Perlegen (http://mouse.perlegen.com/mouse/). Combining these databases will identify a large proportion of the coding differences. The mouse strains ‘‘Small’’ (SM)/J (SM) and ‘‘New Zealand Black’’ (NZB)/B1NJ (NZB) are cur-rently not on the list of such strains; however, the SNP data can be used to examine the haplotypes, and coding differences between SM and NZB can be inferred since mouse inbred strains share common ancestry (Wadeet al.
2002). The SNP data identified many candidate genes that had neither mRNA nor protein abundance differ-ences, yet differed at SNPs in the coding region and hence might affect protein function.
The mouse strains SM (Chai 1956) and NZB
(Bielschowskyand Goodall1970) differ in a number
of metabolic phenotypes (http://www.jax.org/phenome) (Bogueet al. 2007). These were used in a large
inter-cross to yield QTL for a number of complex traits including lipid levels (Korstanje et al. 2004), body
composition and size (Stylianouet al.2006), and
gall-stone susceptibility (Lyonset al.2005). In this study we
evaluate genes within nine QTL for these traits, using all three approaches: mRNA levels, protein levels, and amino acid-changing SNPs in the coding region. The number of candidate genes in each QTL was reduced from hundreds down to a list ranging from 10 to 88 genes depending on the QTL. Some genes were iden-tified by more than one method, but each approach yielded unique genes, showing that it is the combination of methods that provides the best list of candidate genes for further testing.
MATERIALS AND METHODS
Mice, crosses, and tissue collection: SM and NZB inbred mice were obtained from The Jackson Laboratory, Bar Harbor, Maine. Further details relating to the NZB3SM F2cross and
husbandry conditions have been published (Stylianouet al. 2006). All the QTL identified between SM and NZB are pres-ent in both sexes except for two QTL that are female specific (supplemental Table S1); thus only females were interrogated on the microarray and proteomic platforms.
Liver samples from the large lobe of the liver of three female mice for each strain, NZB and SM, were dissected under conditions suitable for RNA. Following a 4-hr morning fast, samples were collected and flash frozen in liquid nitrogen. Two liver samples from each mouse were taken and stored separately to be used for gene and protein analysis. Microarray experiments were performed using all three samples of each strain, but proteomic analysis was performed on two samples of each strain. Additional mice of each sex from both strains were dissected under the same conditions for Western blot analysis. All experiments were performed on 8-week-old mice main-tained on a standard chow diet and procedures were approved by The Jackson Laboratory’s Animal Care and Use Committee. SNP and haplotype analysis:The 138,000 SNPs (1 SNP/ 24 kb) from the Broad Institute database were updated to NCBI Build 36 and used to compare the NZB and SM strains over the nine QTL regions as defined by the 95% confidence interval (C.I.). Where the strains shared at least three common adjacent SNPs, we inferred that the region might be in a haplotype block and be identical by descent. The SNP feature of the Mouse Phenome database was used to search these same QTL regions for all genes carrying a coding-region difference that resulted in an amino acid change. These genes were then compared to the haplotype data, and those genes in regions identical between NZB and SM were eliminated from the list. Examination of the candidate genes for association to their respective traits in published literature was performed as previously described (Stylianouet al.2006).
Microarrays:RNA was extracted from frozen samples using TRIzol as previously described (Stylianouet al.2005), and the quality of the RNA was assessed using a 2100 Bioanalyzer instrument and RNA 6000 Nano LabChip assay (Agilent Tech-nologies, Palo Alto, CA). Following reverse transcription with an oligo(dT)-T7 primer (Affymetrix, Santa Clara, CA), stranded cDNA was synthesized with the Superscript double-stranded cDNA synthesis custom kit (Invitrogen, San Diego). In anin vitrotranscription (IVT) reaction with T7 RNA poly-merase, the cDNA was linearly amplified and labeled with biotinylated nucleotides (Enzo Diagnostics, Farmingdale, NY). Fifteen micrograms of biotin-labeled and fragmented cRNA was then hybridized onto Mouse Genome 430 2.0 Gene-Chip arrays (Affymetrix) for 16 hr at 45°. Posthybridization staining and washing were performed according to manufac-turer’s protocols using the Fluidics Station 450 instrument (Affymetrix). Finally, the arrays were scanned with a GeneChip Scanner 3000 laser confocal slide scanner. The data have been deposited in the Gene Expression Omnibus database (series reference GSE4765).
Array images were quantified using GeneChip Operating Software (GCOS) v1.2. Probe level data were imported into the R software environment and expression values were summa-rized using the Robust MultiChip Average (RMA) function (Irizarryet al.2003a) in the R/affy package in Bioconductor (version 1.3.25; R. A. Irizarry, L. Gautier, and B. M. Bolstad). Using the R/maanova package (Wuet al.2003), an analysis of variance (ANOVA) model was applied to the data. The model
was used to fit the log-transformed gene expression measures Yi, wheremis the mean for each array, STRAIN is the strain effect, andeicaptures random error. Strain differences were
tested usingFs, a modifiedF-statistic incorporating shrinkage
estimates of variance components (Cui et al. 2005). The proportion of false positives generated was estimated using a false discovery rate (FDR) adjustment described previously (Storeyand Tibshirani2003). Differences between strains were determined at the level FDR,0.01, which corresponded to permutationP-values,2.63103.
TaqMan assays:mRNA differences of a number of genes that were identified by microarrays were confirmed by TaqMan quan-titative real-time PCR assays. Briefly, total RNA (1mg) was reverse transcribed using the High-Capacity cDNA Archive kit (Applied Biosystems, Foster City, CA) according to manufacturer’s pro-tocol. A portion of the cDNA was then used in a PCR reaction containing TaqMan Universal PCR Master Mix (Applied Bio-systems), which includes AmpliTaq Gold DNA Polymerase, AmpErase UNG, dNTPs with dUTP, Passive Reference 1, and other buffer components. The gene-specific primers and probe sets were obtained from the Applied Biosystems Assay on De-mand service and used according to manufacturer’s protocols. Real-time PCR was performed in an ABI PRISM 7900HT se-quence detection system (Applied Biosystems) with the stan-dard protocol of 95°for 10 min to activate the DNA polymerase followed by 40 cycles of amplification. The threshold cycle (Ct)
was determined using the sequence detection system software (SDS2.2) and relative fold change ratios were calculated.
Mass spectrometry: Two samples for each strain were prepared in parallel. Liver lobes were diced with a sterile scalpel and placed into extraction buffer containing 500 mm triethyl ammonium bicarbonate, 6mGuHCl, 0.1% Triton X-100, pH 8.5. DNA and tissue were sheared by using a 3-cc syringe fitted with a 20-gauge needle and then sonicated for 20 min. Protein was separated from the buffer by the addition of 63vol of ice-cold acetone. Samples were then incubated at 20° for 2 hr and then briefly spun before removing the acetone. The protein was solubilized in iTRAQ reagent dissolution buffer with SDS. Protein determination was done using bicinchoninic acid (BCA) (Pierce, Rockford, IL). A total of 100mg of each sample were labeled with iTRAQ reagent. Reduction and cysteine blocking were done according to standard protocol. Trypsin digestion was done in two steps: half of the recommended amount of trypsin was added to each sample and incubated for 2 hr at 37°and then the second half was added and left overnight at 37°.
Labeling: The iTRAQ reagents were added to each of the samples as follows: SM no. 1 with 114 (S1), SM no. 2 with 115 (S2), NZB no. 1 with 116 (N1), and NZB no. 2 with 117 (N2). La-beling was performed according to the standard protocol. After labeling the samples were pooled and dried on a Speed-Vac.
HPLC:iTRAQ reagent-labeled samples were diluted in cation exchange loading buffer to reduce the salt concentration. The pH was adjusted to 3.0 with 1 N phosphoric acid. The sample was loaded onto a poly LC polysulfoethyl A 4.53100-mm, 5-mm, 200-A˚ column using the Agilent 1100. UV at A˚214was measured.
Samples were loaded at 0.5 ml/min and the gradient was run at 1.0 ml/min. The gradient conditions were 0% buffer B (10 mm sodium phosphate, 25% acetonitrile, 500 mmKCl, pH 3.0) to 10% buffer B for 2 min, 20% buffer B to 45% for 2 min, and 45% buffer B to 100% for 5 min. One-milliliter fractions were collected and dried to completeness on Speed-Vac. Fractions were then subjected to reverse phase chromatography, com-bined with MALDI-matrix, and spotted on a MALDI target plate. MS and MS/MS spectra were acquired using a 4800 Proteomics Analyzer (ABI) MALDI–TOF/TOF mass spectrometer.
Protein mass spectroscopy experiments were performed in duplicate and converted to ratios between samples (i.e.,
SM2:SM1, NZB1:SM1, NZB2:SM1). Protein measures (analo-gous to the transcript measures above) were derived from these ratios by first arbitrarily setting the SM1 value equal to one, calculating the corresponding values from the ratio rela-tionships, log transforming each value (SM1, SM2, NZB1, NZB2), and recentering the data by subtracting the column means. The statistical tests for differences in protein levels between strains were performed in the same manner as for transcrip-tional differences except that the significance level (determined by permutation) was set atP,0.1. No significant differences would have been found using an FDR as for mRNA due to the limitations of the method (only two biological replicates).
Western analysis for liver proteins: Western analysis was performed to confirm differentially abundant candidate pro-teins identified from the MS analysis. Frozen livers were crushed on a stainless steel block while on dry ice and trans-ferred to a glass homogenizer with a Teflon pestle containing lysis buffer (50 mmTris pH 8.0, 150 mmNaCl, 1 mmEDTA, 1% igepal CA-630 detergent, 1 mmsodium fluoride, 1 mmsodium vanadate, and 13Sigma protease inhibitor cocktail P2714). Following centrifugation at 16,0003gfor 15 min, the protein concentrations of the supernatants were evaluated using a BCA assay (Pierce). Electrophoresis of 10 mg of each lysate was performed using 4–12% Bis–Tris SDS–PAGE gels with MOPS buffer (Invitrogen). Proteins were transferred to 0.45 mm polyvinylidene fluoride membranes (Invitrogen), using Invi-trogen’s transfer buffer containing 10% methanol for 1 hr at 30 V and 25°. Membranes were blocked for 1 hr in Tris-buffered saline Tween-20 with 10% skim milk.
Acyl-coenzyme A dehydrogenase, short chain: Rabbit anti-acyl-coenzyme A dehydrogenase, short chain (ACADS) serum (kindly provided by G. Vockley’s lab from the Children’s Hospital of Pittsburgh) was used at the dilution of 1:1000 with 5% skim milk for the primary immunostain. Goat anti-rabbit IgG horseradish peroxidase (HRP) (0.4 mg/ml) was used at 1:50,000 for the secondary immunostain (Pierce).
NADH dehydrogenase (ubiquinone) 1 a-subcomplex 9: Mouse monoclonal against purified mitochondrial complex I of cow (200mg/ml) (Santa Cruz Biotechnology, Santa Cruz, CA) was used at the dilution of 1:500 with 5% skim milk for the primary immunostain. Goat anti-mouse IgG HRP (10mg/ml) was used at 1:1000 for the secondary stain (Pierce).
Fumarate hydratase: Goat polyclonal IgG (Santa Cruz Bio-technology) was used at the dilution of 1:200 with 5% skim milk for the primary immunostain. Donkey anti-goat IgG H1 L HRP (1 mg/ml) was used at 1:5000 for the secondary stain (Novus Biologicals, Littleton, CO).
Hydroxysteroid 11-b dehydrogenase 1: Rabbit polyclonal anti-body (Abcam, Cambridge, MA) to human sequence was used at 1:300 for the primary immunostain. Goat anti-rabbit IgG (H 1L) HRP (0.4 mg/ml) was used at 1:50,000 dilution for the secondary stain. For a loading control, we used rabbit anti-b -tubulin conjugated with HRP at a 1:200 dilution of 200 mg/ml (Santa Cruz Biotechnology).
For each blot, 3 samples each from a different mouse were run for both strains (SM and NZB) and both sexes, resulting in a total of 12 samples with an N ¼ 3 within-sex–strain com-parison and anN¼6 within-strain comparison. The immuno-blots were immersed in Pierce’s SuperSignal West Dura HRP substrate and imaged using a FujiLas CCD camera. Quantita-tion was performed using ImageJ (Abramoffet al.2004).
RESULTS
QTL analysis: Previous analysis of the SM 3 NZB
the phenotypes of high-density lipoprotein (HDL) cho-lesterol (Korstanjeet al.2004), gallstone susceptibility
(Lyonset al.2005), body weight, adiposity, and obesity
(Stylianouet al.2006), including 2 HDL QTL affected
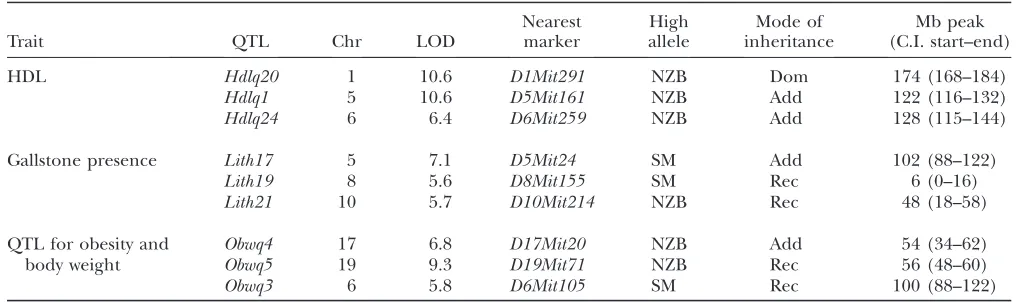
by sex (supplemental Table S1). In this report we fo-cused on the three most significant QTL for each of these traits:Hdlq20, -1, and -24on chromosomes (Chrs) 1, 5, and 6, respectively for HDL;Lith17, -19, and -21on Chrs 5, 8, and 10, respectively, for gallstones; andObwq3, -4, and -5on Chrs 6, 17, and 19, respectively, for obesity. We reanalyzed the QTL data from the original publica-tions with updated marker posipublica-tions based on mouse genome Build 36 (Table 1). To obtain the 95% confi-dence intervals, we used posterior probability distribu-tion as described previously (Senand Churchill2001).
Use of SNP data to reduce the QTL interval and
identify genes with coding changes:QTL regions were
reduced by eliminating regions within the 95% C.I. that appeared to be IBD between the two parental strains; these regions are unlikely to contain the causal poly-morphisms unless the mutation arose in the last 100 years since the strains were inbred. It is estimated that 97% of mutations are ancestral (Wadeet al.2002). Thus,
3% of mutations, and by inference 3% of QTL, may be due to a recent mutation unique to a single strain. If a mutation is recent, then the QTL is unlikely to be found except in a cross with that particular strain; thus, if the same QTL is found in more than one intercross, the mutation is more likely to be ancestral. For all QTL in this report except one (Lith19on Chr 8), the QTL have been reported in other crosses, thus increasing greatly the probability that the causal mutation is ancestral and shared among strains. We inferred the IBD regions by directly examining the common polymorphisms be-tween the parental strains, using 130,000 SNPs for SM and NZB from the Broad Institute (http://www.broad. mit.edu/mouse/snp_xls.html). These data were used
to exclude large regions within each QTL and reduced the QTL genomic space by between 40 and 72%.
To identify genes that differed within the coding region of the gene, we utilized all the Perlegen SNP data in combination with all SNPs for SM and NZB available through the Mouse Phenome database (http://www.jax. org/phenome) (Bogueet al.2007). We inferred coding
differences between SM and NZB for the nine QTL (Table 2). This resulted in a list of genes that may be causal for each QTL due to coding and hence functional differences (supplemental Tables S2–S10).
Transcriptome analysis: Liver mRNA profiles were
compared between three SM and three NZB female mice, using the Affymetrix Mouse Genome 430 2.0 oligonucleotide GeneChip arrays. Statistical diagnostic analysis indicates that the array data generated are highly replicable and hence robust. Genes that are not differentially expressed between the two strains have a characteristically even distribution of nonsignificantP -values (Figure 1A). Scatter plots of mRNA gene expres-sion measures from the six arrays derived from robust multichip analysis (RMA) (Irizarryet al.2003b) show
that within-strain comparisons are tightly distributed and between-strain distributions show differential ex-pression (Figure 1B). To validate the microarray results, we performed real-time PCR using TaqMan assays on 10 differentially expressed genes that had conservative absolute fold changes of ,4.0 and FDRs ,1 3 104.
TaqMan assays were consistent with microarray data for all 10 genes; that is, all genes were differentially ex-pressed in the expected direction and the differences were significant after correcting for multiple testing (supplemental Table S11). Using the stringent FDR of
,13 104, we identified 831 differentially expressed
(DE) probe sets.
Candidates based on differences in mRNA
abun-dance:A number of differentially expressed genes were
TABLE 1
Selected QTL from the SM3NZB F2cross for three complex traits
Trait QTL Chr LOD
Nearest marker
High allele
Mode of inheritance
Mb peak (C.I. start–end)
HDL Hdlq20 1 10.6 D1Mit291 NZB Dom 174 (168–184)
Hdlq1 5 10.6 D5Mit161 NZB Add 122 (116–132)
Hdlq24 6 6.4 D6Mit259 NZB Add 128 (115–144)
Gallstone presence Lith17 5 7.1 D5Mit24 SM Add 102 (88–122)
Lith19 8 5.6 D8Mit155 SM Rec 6 (0–16)
Lith21 10 5.7 D10Mit214 NZB Rec 48 (18–58)
QTL for obesity and body weight
Obwq4 17 6.8 D17Mit20 NZB Add 54 (34–62)
Obwq5 19 9.3 D19Mit71 NZB Rec 56 (48–60)
Obwq3 6 5.8 D6Mit105 SM Rec 100 (88–122)
identified from the microarray analysis (Figure 2, sup-plemental Tables S2–S10 and S12). Several of these are of particular interest because there is evidence that they are involved with the target traits (Table 3). The
cholesterol scavenger receptor class B member 1 (Scarb1) is a known receptor for HDL (Acton et al.
1996; Trigattiet al. 2003) and therefore an obvious
candidate forHdlq1 on Chr 5; adiponectin receptor 2 (Adipor2) is a functional candidate for Hdlq24 and
Obwq3 on Chr 6. For gallstone QTL, the connective tissue growth factor (Ctgf), shown to have a 40-fold mRNA differential expression in the gallbladders of human cholecystolithiasis patients compared to con-trols (Koningeret al.2005), is a candidate forLith21on
Chr 10; also Slc10a2 on Chr 8 is essential for efficient intestinal absorption of bile acids and therefore may be responsible for the Lith19QTL (Dawsonet al.2003).
Finally, for the obesity QTL on Chr 19, attractin-like 1 (Atrnl1) has a 3.4-fold upregulation in NZB relative to SM. Attractin is part of the agouti pathway that leads to obesity due to aberrant ectopic protein expression (He et al.2001), andAtrnl1may similarly be involved in this pathway.
Mass-spectrometric proteomic analysis: We
exam-ined liver protein expression differences between the strains using mass spectrometry with iTRAQ reagent chemistry labeling technology (Rosset al.2004).
Sam-ples were used from two of the three biological replicates used for the microarray study. iTRAQ labels are essentially chemical compounds with two parts. The first part, retained by the peptide after scattering, is available at four different masses of 114, 115, 116, or 117 Da. The second part of the label is not retained; this part of the molecule is designed to balance the mass of the
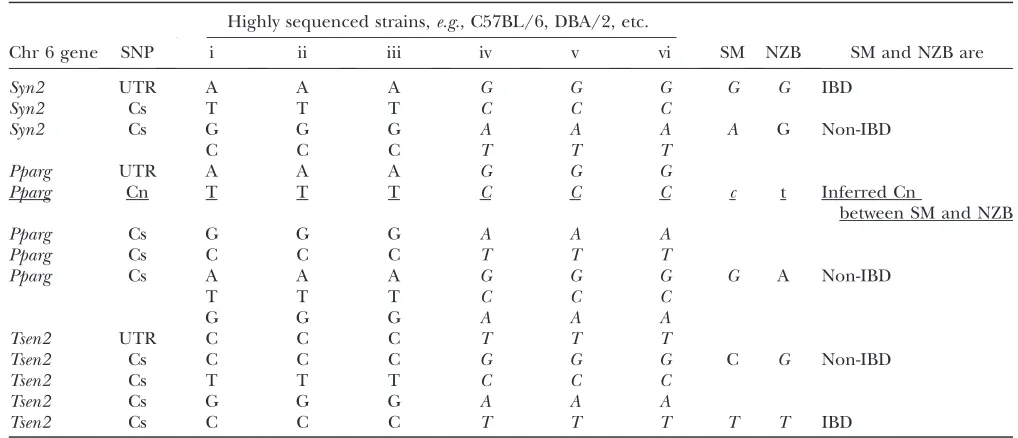
TABLE 2
Inferring codon changing SNPs between SM and NZB by examining SNPs between highly sequenced strains
Highly sequenced strains,e.g., C57BL/6, DBA/2, etc.
Chr 6 gene SNP i ii iii iv v vi SM NZB SM and NZB are
Syn2 UTR A A A G G G G G IBD
Syn2 Cs T T T C C C
Syn2 Cs G G G A A A A G Non-IBD
C C C T T T
Pparg UTR A A A G G G
Pparg Cn T T T C C C c t Inferred Cn
between SM and NZB
Pparg Cs G G G A A A
Pparg Cs C C C T T T
Pparg Cs A A A G G G G A Non-IBD
T T T C C C
G G G A A A
Tsen2 UTR C C C T T T
Tsen2 Cs C C C G G G C G Non-IBD
Tsen2 Cs T T T C C C
Tsen2 Cs G G G A A A
Tsen2 Cs C C C T T T T T IBD
Italic nucleotides indicate an alternative haplotype present in common inbred strains that can be used to infer the origin of polymorphisms from less well characterized strains. Although SM and NZB are not as well sequenced as other strains, missing SNPs between SM and NZB can be inferred by examining the haplotypes of the other strains. For the Cn inPparg(underlined), SM is inferred to be ‘‘C’’ and NZB is inferred to be ‘‘T.’’ Cs, coding synonymous; Cn, coding nonsynonymous; IBD, identical by descent.
four labels. Thus all four labels are isobaric, so that observed differences are not due to the differential mass of the labels. Up to four samples can be labeled so that within a sample every peptide is equally tagged with an additional mass of 114, the peptides of the second sample can be tagged with a mass of 115, and so on. We identified 943 proteins with 95% confidence:7% were ribosomal and 43% represented novel or uncharacter-ized gene products.
These data are presented as exploratory; the statistical power is not optimal since only a two-by-two comparison is possible on this proteomics platform. Consequently we are using a statistical threshold ofP, 0.1, derived from permutation analysis, which we are using to indicate peptides that might be significantly differen-tially expressed under more reproducible experimental conditions such as Western analysis. Rather than reduce the statistical threshold for this technology and
elimi-nate possible candidates, the higher threshold exposes us to type I errors, which are more acceptable to us than type II errors, that is, to eliminate candidate genes that are responsible for the QTL. For example, apolipopro-tein A-II precursor (APOA2), which has a P-value of 0.077 in our analysis, has been shown previously to be differentially abundant with no mRNA difference (Doolittle et al. 1990) and is responsible for the
HDL QTL linked to it (Wanget al.2004).
We identified 45 proteins as differentially regulated between the two strains (P,0.1) (supplemental Table S13); 33 of these 45 could be linked to corresponding genes. The remaining 12 peptides included 8 peptides that could not be mapped and 4 problem peptides that did not map to a unique location because they were in highly conserved protein families.
Candidates based on differences in protein
abun-dance: Only a few of the 33 differentially expressed
proteins mapped to a QTL (Figure 2). For the HDL QTL, APOA2 (P ¼ 0.077) and fumarate hydratase (FH1) (P¼0.073) are encoded by genes that fall within the Hdlq20 QTL interval on Chr 1. Additionally, hy-droxysteroid 11-b dehydrogenase 1 (HSD11B1) maps close to this QTL and knockout mice for this gene have increased HDL cholesterol levels (Mortonet al.2001).
The gene that encodes ACADS (previously known as SCAD) maps within Hdlq1 on Chr 5 (Table 1), and NADH dehydrogenase (ubiquinone) 1a-subcomplex 9 (NDUFA9) is encoded by a gene within theHdlq24QTL on Chr 6. The gallstone QTLLith17on Chr 5 overlaps with the HDL QTL Hdlq1, and thus ACADS is also a candidate for this gallstone QTL.
To validate some of the candidates identified from the iTRAQ ABI 4800 Proteomics Analyzer, antibodies suit-able for Western analysis were obtained for several proteins. These include FH1 and HSD11B1 on Chr 1, ACADS on Chr 5, and NDUFA9 on Chr 6. Western analysis confirmed the initial results from MS (Figure 3). Significant differences were observed for all four proteins after normalizing to b-tubulin: P ¼ 0.0033
(NDUFA9),P¼0.0002 (FH1),P¼0.0091 (HSD11B1), andP¼0.016 (ACADS).
DISCUSSION
Often QTL are large, containing hundreds of genes, so different tools and approaches are needed to reduce the number of probable candidate genes that require further testing. Combining three approaches, we gen-erated smaller candidate gene lists for each QTL, and the overall summary for candidate genes identified is given in Table 4. This was achieved by searching for differential amounts of either mRNA or protein abun-dance and by mining publicly available SNPs to exclude regions of the QTL that are inferred to be identical by descent and to identify genes with protein-coding differ-ences that may indicate functional differdiffer-ences. Each of these three approaches has its limitations and strengths as discussed below.
If these three approaches have not reduced the possible candidate genes to a manageable list, which we consider #10 genes, then other approaches are
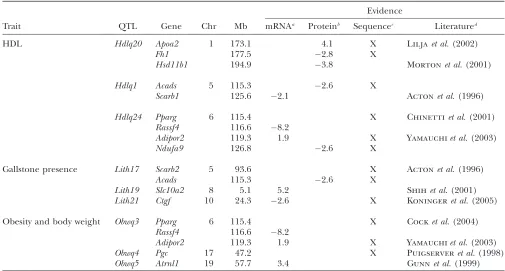
TABLE 3
Candidate genes for each QTL based on our data and published evidence—the genes to test first
Evidence
Trait QTL Gene Chr Mb mRNAa Proteinb Sequencec Literatured
HDL Hdlq20 Apoa2 1 173.1 4.1 X Liljaet al.(2002)
Fh1 177.5 2.8 X
Hsd11b1 194.9 3.8 Mortonet al.(2001)
Hdlq1 Acads 5 115.3 2.6 X
Scarb1 125.6 2.1 Actonet al.(1996)
Hdlq24 Pparg 6 115.4 X Chinettiet al.(2001)
Rassf4 116.6 8.2
Adipor2 119.3 1.9 X Yamauchiet al.(2003)
Ndufa9 126.8 2.6 X
Gallstone presence Lith17 Scarb2 5 93.6 X Actonet al.(1996)
Acads 115.3 2.6 X
Lith19 Slc10a2 8 5.1 5.2 Shihet al.(2001)
Lith21 Ctgf 10 24.3 2.6 X Koningeret al.(2005)
Obesity and body weight Obwq3 Pparg 6 115.4 X Cocket al.(2004)
Rassf4 116.6 8.2
Adipor2 119.3 1.9 X Yamauchiet al.(2003)
Obwq4 Pgc 17 47.2 X Puigserveret al.(1998)
Obwq5 Atrnl1 19 57.7 3.4 Gunnet al.(1999)
Genes listed are in QTL regions that are not identical by descent between SM and NZB (Hsd11b1maps close toHldq20). Protein and mRNA fold changes are given where a positive value indicates upregulation and a negative one indicates downregulation in NZB relative to SM.
a
Fold changes for mRNA are significant (Fs,13104). b
Proteins are significantly different as determined by Western analysis (Figure 3), except for APOA2, which is suggestive (P, 0.1) on the basis of MS/MS data.
cGenes that contain known or extrapolated codon-changing SNPs leading to potential functional differences are indicated by ‘‘X.’’ dGene names from supplemental Table S2 were systematically interrogated against the PubMed database using relevant
available, some of which have been discussed previously (Dipetrilloet al.2005; Flintet al.2005). For example,
comparative genomics is a useful approach both for narrowing the QTL if a homologous QTL has been found in other species and for examining the genes found in a human genomewide association study in the mouse. Another approach is to examine the expression databases to determine if the candidate gene is ex-pressed in the relevant tissues. Following this bioinfor-matics work or global expression studies, we test the small list of candidates by sequencing and by expression analysis. Our goal is to obtain at least three independent lines of evidence for a candidate gene.
mRNA expression data: Today microarray
technol-ogy yields reliable, consistent, and reproducible data from probe sets that are well annotated. As with the platform used here (Affymetrix GeneChip Mouse Ge-nome 430 2.0), most technologies report mRNA ex-pression for many thousands of genes, approaching the entire known transcriptome. It is likely, therefore, that if a differentially expressed gene in the liver is causal for any of the nine QTL, we should be able to detect it. Indeed, when we examine the differentially ex-pressed probes in the QTL intervals located in haplo-type regions that are not identical by descent between our two strains, we find several genes that are
obvi-ous candidates. These include Scarb1 for Hdlq1 on Chr 5,CtgfforLith21on Chr 10,Slc10a2forLith19on Chr 8, and Atrnl1for Obwq5on Chr 19 (Figure 3 and Table 3).
Although searching for differential gene expression using microarrays is probably the most advanced tech-nology of the three methods, it has several limitations. Suitable probes for a gene may not be on the microarray and splice variants are difficult to detect. The differen-tial expression could be caused by differendifferen-tial binding of the mRNA due to SNPs in the probe. This can be guarded against by searching the databases for SNPs in the probes and by confirming any expression difference with new probes and RT–PCR. Trans-regulatory ele-ments outside of the QTL may cause differential expression of a gene in the QTL region; similarly, gene interaction or epistasis could cause the parental strains to have similar gene expression even though differential expression was causal for the QTL in an inbred cross. Both errors can be guarded against by measuring gene expression in tissues from selected F2progeny
(com-paring mice homozygous for one parent over the QTL region to mice homozygous for the other parent over the same region).
Protein analysis: The primary aim of microarrays is
to identify differentially expressed genes that are
Figure 3.—Western blot analysis of ACADS, FH1, NDUFA9, HSD11B1, and controlb-tubulin. F and M indicate female and male, and each sex or strain is represented by three biological repli-cates. As there was no significant difference be-tween sexes for any of the proteins, significance (P-value*) was determined by at-test of the ratios of the target proteins tob-tubulin between strains (N ¼6). †, FC indicates fold change relative to NZB. U, an additional NZB male-specific HSD11B1 isoform is apparent at55–60 kDa (supplemental Figure S1); however, females do not have this isoform and conse-quently NZB females are still significantly decreased compared to SM. ‡, ACADS was probed to a second blot with an identical setup and normalized tob-tubulin probed to the second blot.
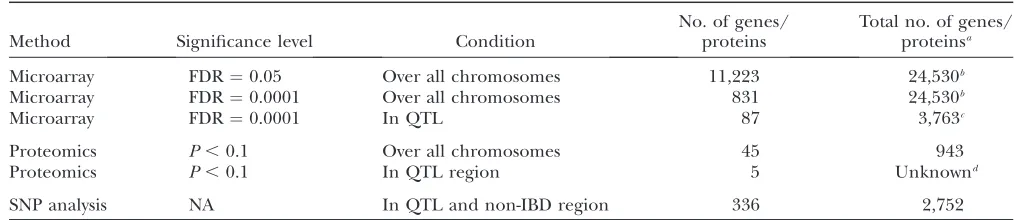
TABLE 4
Summary of candidate genes identified by the various methods used
Method Significance level Condition
No. of genes/ proteins
Total no. of genes/ proteinsa
Microarray FDR¼0.05 Over all chromosomes 11,223 24,530b
Microarray FDR¼0.0001 Over all chromosomes 831 24,530b
Microarray FDR¼0.0001 In QTL 87 3,763c
Proteomics P,0.1 Over all chromosomes 45 943
Proteomics P,0.1 In QTL region 5 Unknownd
SNP analysis NA In QTL and non-IBD region 336 2,752
a
Gene here also refers to an Affymetrix probe for the microarrays and a peptide linked to a protein entry in the Swiss-Prot or TrEMBL databases for the proteomics.
b
There are 45,037 noncontrol probe sets on the arrays; however, 20,507 are not expressed in any of the six samples, indicating that genes for those probes are not expressed in adult female mouse liver.
c
The total number of probes within the total space of the nine QTL including IBD regions between SM and NZB.
d
representing differentially abundant proteins. Large-scale proteomic techniques have only recently become feasible; however, they are technically and financially restrictive relative to mRNA arrays. Nonetheless, as proteomic technologies improve they may replace microarray gene expression since it will be possible to directly interrogate the presence of differentially abun-dant proteins. Despite the ability to directly identify 943 proteins, making direct comparisons between mRNA regulation and protein regulation remains difficult, principally because MS/MS proteomics and the accom-panying bioinformatics are still at early stages of de-velopment. Areas of improvement that will significantly advance the field should include standardized protocols on tissue processing. In this study, we chose a single tissue-processing condition (pH 8.5) that would yield the widest variety of protein peptides from liver; this isolation may miss more basic and more acidic pro-teins. A more thorough investigation of the liver proteome would include a range of tissue-processing conditions.
Another desirable improvement is peptide annota-tion, specifically linked annotation between protein/ peptides and gene databases. Although we identified 943 proteins, a significant proportion of these (43%) could not be assigned to a gene; thus direct comparisons with Affymetrix probe identifications could not be made. Furthermore, a significant proportion of the 943 pro-teins, despite a protein identifier, had little or no an-notation in public databases and indeed BLAST searches of the peptides to genome databases (Ensembl_mouse) derived no hits at all, even after decoding the peptide into DNA sequence. Finally, standardized analytical methods of MS/MS data are currently lacking and an initiative similar to that seen for mRNA gene analysis is required.
Despite the need for continued technological ad-vancements in the proteomic field, the technology is developed enough to identify changes in protein abun-dance between samples. ACADS, a protein encoded by a gene in both the HDL QTLHdlq1and the gallstone QTL Lith17 on Chr 5, showed significantly increased protein abundance in SM adult female liver relative to the NZB strain (a 2.6- and a 1.6-fold change from MS and Western analysis, respectively), but no difference in mRNA expression (Table 2). The difference in protein abundance was confirmed by Western blot analysis. Similar results were obtained for FH1, HSD11B1, and NDUFA9 (Table 3, Figures 2 and 3). Finally, our MS data indicate a 4-fold protein increase of APOA2 in NZB relative to SM protein abundance with no mRNA expression difference. A difference in the quantity of APOA2 protein but not in mRNA was reported pre-viously between two different strains (Doolittleet al.
1990). We have previously shown that the geneApoa2is responsible for the HDL QTLHdlq5(Wanget al.2004)
in mice and associated with HDL levels in human studies (Liljaet al.2002).
The proteomics analysis reveals two important aspects of this study. First, differentially abundant proteins can be identified and may underlie QTL, and second, as others have shown in yeast (Gygi et al. 1999), these
differentially expressed proteins are not necessarily accompanied by differences at the mRNA level. Of the 33 named differentially expressed proteins identified with corresponding Affymetrix probe sets, 12 had differentially expressed mRNA in the same direction with an FDR of q, 0.05 (39%) (supplemental Table S13). We expect that differentially abundant proteins whose mRNA levels are similar will have changes at the gene (e.g., 59- and 39-UTRs) or the protein level (e.g., phosphorylation) that will affect protein synthesis and degradation. APOA2 is known to have such an amino acid change (Wanget al.2004).
SNPs and haplotype data: We used public SNP
information to first eliminate those regions that were in the 95% confidence interval of the QTL but were identical by descent between NZB and SM. We then examined the remaining genes by identifying codon-changing SNPs. Once genes with nonsynonymous SNPs were identified between well-characterized strains, they were compared to the haplotypes of SM and NZB, which allowed us to infer if the same nonsynonymous poly-morphism might be present between SM and NZB as illustrated in Table 2. This generated a list of genes that may have nonsynonymous changes between the two strains, which may affect the function of the proteins, thus causing the QTL. However, the number of genes identified using this method for some QTL was still prohibitively large for testing (e.g., 88 genes in the
Obwq4 QTL). In addition, it has recently been shown that SNPs causing synonymous codon changes, for which the alternate codon is rare, can lead to a difference in protein efficiency or function (Kimchi
-Sarfatyet al.2007).
The method of using SNPs does have several draw-backs that will become less important in the future as SNP databases improve (Reuveniet al.2007). Using the
SNP database to eliminate regions that are identical by descent could lead to error by incorrectly eliminating regions; this type of error will be reduced as the density of the SNPs improves. The SNP database, even for those strains sequenced by Celera and Perlegen, is incomplete because both groups used rigorous criteria to guard against false positives. On the basis of the Perlegen data,
50% of the SNPs will be identified if the minor allele is shared by three strains (58% if the minor allele frequency is shared by seven strains) (Yang and
Churchill2007) or a somewhat better percentage if
Celera data are included or only classic inbreds (not wild-derived strains) are considered.
Summary:In spite of the limitations for each method,
Chr 5 and Adipor2 for Obwq3 on Chr 6 (Table 3 and supplemental Table S2) but multiple lines of evidence do not prove that it is the causal gene. In one case we were able to identify a known gene for a QTL (Apoa2); and each method revealed likely candidates that the other methods did not. We conclude that QTL candi-date genes should be assessed for changes in coding and both protein and message levels.
We give special thanks to Stephen Grubb, Allison Cox, and Sikander Hayat for assistance with bioinformatics; to Douglas Hinerfeld and the Gene Expression and Protein Chemistry Services at The Jackson Laboratory; to G. Vockley’s Lab from the Children’s Hospital of Pittsburgh for the ACADS antibody; to Applied Biosystems for the kind donation of the TaqMan assays; and to Sarah Langley for assistance in proofreading. This work was supported by The American Heart Association grant 0525816T (to I.M.S.) and by National Institutes of Health grants HL77796 and HL66611 (to B.P.) and GM070683 (to G.C.).
LITERATURE CITED
Abramoff, M. D., P. J. Magelhaesand S. J. Ram, 2004 Image
pro-cessing with ImageJ. Biophotonics Int.11:36–42.
Acton, S., A. Rigotti, K. T. Landschulz, S. Xu, H. H. Hobbset al.,
1996 Identification of scavenger receptor SR-BI as a high den-sity lipoprotein receptor. Science271:518–520.
Aebersold, R., and M. Mann, 2003 Mass spectrometry-based
pro-teomics. Nature422:198–207.
Aitman, T. J., A. M. Glazier, C. A. Wallace, L. D. Cooper, P. J.
Norsworthyet al., 1999 Identification of Cd36 (Fat) as an
in-sulin-resistance gene causing defective fatty acid and glucose me-tabolism in hypertensive rats. Nat. Genet.21:76–83.
Bielschowsky, M., and C. M. Goodall, 1970 Origin of inbred NZ
mouse strains. Cancer Res.30:834–836.
Bogue, M. A., S. C. Grubb, T. P. Maddatu and C. J. Bult,
2007 Mouse Phenome Database (MPD). Nucleic Acids Res.
35:D643–D649.
Chai, C. K., 1956 Analysis of quantitative inheritance of body size
in mice. I. Hybridization and material influence. Genetics14:
157–164.
Chinetti, G., S. Lestavel, V. Bocher, A. T. Remaley, B. Neveet al.,
2001 PPAR-alpha and PPAR-gamma activators induce choles-terol removal from human macrophage foam cells through stim-ulation of the ABCA1 pathway. Nat. Med.7:53–58.
Cock, T. A., S. M. Houtenand J. Auwerx, 2004 Peroxisome
prolif-erator-activated receptor-gamma: too much of a good thing causes harm. EMBO Rep.5:142–147.
Cui, X., J. T. Hwang, J. Qiu, N. J. Bladesand G. A. Churchill,
2005 Improved statistical tests for differential gene expression by shrinking variance components estimates. Biostatistics6:59–75. Dawson, P. A., J. Haywood, A. L. Craddock, M. Wilson, M. Tietjen et al., 2003 Targeted deletion of the ileal bile acid transporter eliminates enterohepatic cycling of bile acids in mice. J. Biol. Chem.278:33920–33927.
DiPetrillo, K., X. Wang, I. M. Stylianou and B. Paigen,
2005 Bioinformatics toolbox for narrowing rodent quantitative trait loci. Trends Genet.21:683–692.
Doolittle, M. H., R. C. LeBoeuf, C. H. Warden, L. M. Beeand A. J.
Lusis, 1990 A polymorphism affecting apolipoprotein A-II
translational efficiency determines high density lipoprotein size and composition. J. Biol. Chem.265:16380–16388.
Flint, J., W. Valdar, S. Shifmanand R. Mott, 2005 Strategies for
mapping and cloning quantitative trait genes in rodents. Nat. Rev. Genet.6:271–286.
Gunn, T. M., K. A. Miller, L. He, R. W. Hyman, R. W. Daviset al.,
1999 The mouse mahogany locus encodes a transmembrane form of human attractin. Nature398:152–156.
Gygi, S. P., Y. Rochon, B. R. Franzaand R. Aebersold, 1999
Cor-relation between protein and mRNA abundance in yeast. Mol. Cell. Biol.19:1720–1730.
He, L., T. M. Gunn, D. M. Bouley, X. Y. Lu, S. J. Watsonet al.,
2001 A biochemical function for attractin in agouti-induced pigmentation and obesity. Nat. Genet.27:40–47.
Irizarry, R. A., B. M. Bolstad, F. Collin, L. M. Cope, B. Hobbset al.,
2003a Summaries of Affymetrix GeneChip probe level data. Nucleic Acids Res.31:e15.
Irizarry, R. A., B. Hobbs, F. Collin, Y. D. Beazer-Barclay, K. J.
Antonelliset al., 2003b Exploration, normalization, and
sum-maries of high density oligonucleotide array probe level data. Biostatistics4:249–264.
Johannesson, M., L. M. Olsson, A. K. Lindqvist, S. Moller,
D. Koczanet al., 2005 Gene expression profiling of arthritis
us-ing a QTL chip reveals a complex gene regulation of the Cia5 region in mice. Genes Immun.6:575–583.
Kimchi-Sarfaty, C., J. M. Oh, I. W. Kim, Z. E. Sauna, A. M. Calcagno et al., 2007 A ‘‘silent’’ polymorphism in the MDR1 gene changes substrate specificity. Science315:525–528.
Koninger, J., F. F.diMola, P. DiSebastiano, A. Gardini, D. R.
Brigstocket al., 2005 Transforming growth factor-beta
path-way is activated in cholecystolithiasis. Langenbecks Arch. Surg.
390:21–28.
Korstanje, R., and B. Paigen, 2002 From QTL to gene: the harvest
begins. Nat. Genet.31:235–236.
Korstanje, R., R. Li, T. Howard, P. Kelmenson, J. Marshallet al.,
2004 Influence of sex and diet on quantitative trait loci for HDL cholesterol levels in an SM/J by NZB/BlNJ intercross pop-ulation. J. Lipid Res.45:881–888.
Lilja, H. E., A. Soro, K. Ylitalo, I. Nuotio, J. S. Viikariet al.,
2002 A candidate gene study in low HDL-cholesterol families provides evidence for the involvement of the APOA2 gene and the APOA1C3A4 gene cluster. Atherosclerosis164:103–111. Lyons, M. A., R. Korstanje, R. Li, S. M. Sheehan, K. A. Walshet al.,
2005 Single and interacting QTLs for cholesterol gallstones re-vealed in an intercross between mouse strains NZB and SM. Mamm. Genome16:152–163.
McRedmond, J. P., S. D. Park, D. F. Reilly, J. A. Coppinger, P. B.
Maguireet al., 2004 Integration of proteomics and genomics
in platelets: a profile of platelet proteins and platelet-specific genes. Mol. Cell Proteomics3:133–144.
Mijalski, T., A. Harder, T. Halder, M. Kersten, M. Horschet al.,
2005 Identification of coexpressed gene clusters in a compara-tive analysis of transcriptome and proteome in mouse tissues. Proc. Natl. Acad. Sci. USA102:8621–8626.
Morton, N. M., M. C. Holmes, C. Fievet, B. Staels, A. Tailleux et al., 2001 Improved lipid and lipoprotein profile, hepatic in-sulin sensitivity, and glucose tolerance in 11beta-hydroxysteroid dehydrogenase type 1 null mice. J. Biol. Chem. 276: 41293– 41300.
Mural, R. J., M. D. Adams, E. W. Myers, H. O. Smith, G. L. Miklos et al., 2002 A comparison of whole-genome shotgun-derived mouse chromosome 16 and the human genome. Science296:
1661–1671.
Ono, M., M. Shitashige, K. Honda, T. Isobe, H. Kuwabaraet al.,
2006 Label-free quantitative proteomics using large peptide data sets generated by nanoflow liquid chromatography and mass spectrometry. Mol. Cell Proteomics5:1338–1347.
Pastorelli, R., D. Carpi, R. Campagna, L. Airoldi, R. Pohjanvirta et al., 2006 Differential expression profiling of the hepatic proteome in a rat model of dioxin resistance: correlation with genomic and transcriptomic analyses. Mol. Cell Proteomics5:
882–894.
Peters, L. L., R. F. Robledo, C. J. Bult, G. A. Churchill, B. J. Paigen et al., 2007 The mouse as a model for human biology: a re-source guide for complex trait analysis. Nat. Rev. Genet. 8:
58–69.
Pilch, B., and M. Mann, 2006 Large-scale and high-confidence
pro-teomic analysis of human seminal plasma. Genome Biol.7:R40. Puigserver, P., Z. Wu, C. W. Park, R. Graves, M. Wright et al.,
1998 A cold-inducible coactivator of nuclear receptors linked to adaptive thermogenesis. Cell92:829–839.
Reuveni, E., V. E. Ramenskyand C. Gross, 2007 Mouse SNP Miner:
an annotated database of mouse functional single nucleotide polymorphisms. BMC Genomics8:24.
Ribeiro, J. M., R. Charlab, V. M. Pham, M. Garfieldand J. G.
and proteome of the adult female mosquito Culex pipiens quin-quefasciatus. Insect Biochem. Mol. Biol.34:543–563.
Ross, P. L., Y. N. Huang, J. N. Marchese, B. Williamson, K. Parker et al., 2004 Multiplexed protein quantitation inSaccharomyces cerevisiaeusing amine-reactive isobaric tagging reagents. Mol. Cell Proteomics3:1154–1169.
Ruse, C. I., F. L. Tan, M. Kinterand M. Bond, 2004 Integrated
anal-ysis of the human cardiac transcriptome, proteome and phos-phoproteome. Proteomics4:1505–1516.
Sen, S., and G. A. Churchill, 2001 A statistical framework for
quan-titative trait mapping. Genetics159:371–387.
Shih, D. Q., M. Bussen, E. Sehayek, M. Ananthanarayanan, B. L.
Shneideret al., 2001 Hepatocyte nuclear factor-1alpha is an
es-sential regulator of bile acid and plasma cholesterol metabolism. Nat. Genet.27:375–382.
Storey, J. D., and R. Tibshirani, 2003 Statistical significance for
ge-nomewide studies. Proc. Natl. Acad. Sci. USA100:9440–9445. Stylianou, I. M., M. Clinton, P. D. Keightley, C. Pritchard, Z.
Tymowska-Lalanne et al., 2005 Microarray gene expression
analysis of theFob3bobesity QTL identifies positional candidate gene Sqle and perturbed cholesterol and glycolysis pathways. Physiol. Genomics20:224–232.
Stylianou, I. M., R. Korstanje, R. Li, S. Sheehan, B. Paigenet al.,
2006 Quantitative trait locus analysis for obesity reveals multi-ple networks of interacting loci. Mamm. Genome17:22–36. Theuns, J., J. Del-Favero, B. Dermaut, C. M. van Duijn, H.
Backhovenset al., 2000 Genetic variability in the regulatory
re-gion of presenilin 1 associated with risk for Alzheimer’s disease and variable expression. Hum. Mol. Genet.9:325–331.
Trigatti, B. L., M. Kriegerand A. Rigotti, 2003 Influence of the
HDL receptor SR-BI on lipoprotein metabolism and atheroscle-rosis. Arterioscler. Thromb. Vasc. Biol.23:1732–1738. Valenzuela, J. G., I. M. Francischetti, V. M. Pham, M. K. Garfield
and J. M. Ribeiro, 2003 Exploring the salivary gland
transcrip-tome and proteome of theAnopheles stephensimosquito. Insect Biochem. Mol. Biol.33:717–732.
Wade, C. M., E. J. Kulbokas, 3rd, A. W. Kirby, M. C. Zody, J. C.
Mullikinet al., 2002 The mosaic structure of variation in the
laboratory mouse genome. Nature420:574–578.
Wang, X., R. Korstanje, D. Higginsand B. Paigen, 2004
Haplo-type analysis in multiple crosses to identify a QTL gene. Genome Res.14:1767–1772.
Wu, H., K. Kerrand G. Churchill, 2003 MAANOVA: A Software Package for the Analysis of Spotted cDNA Microarray Experiments in the Analysis of Gene Expression Data: An Overview of Methods and Soft-ware, edited by G. Parmgiani, E. S. Garret, R. A. Irizarryand S.
L. Zeger, pp. 313–431. Springer, New York.
Yamauchi, T., J. Kamon, Y. Ito, A. Tsuchida, T. Yokomizoet al.,
2003 Cloning of adiponectin receptors that mediate antidia-betic metabolic effects. Nature423:762–769.
Yang, H., and G. Churchill, 2007 Estimating p-values in small
mi-croarray experiments. Bioinformatics23:38–43.
Zhen, Y., N. Xu, B. Richardson, R. Becklin, J. R. Savage et al.,
2004 Development of an LC-MALDI method for the analysis of protein complexes. J. Am. Soc. Mass Spectrom.15:803–822.