External ear microRNA expression profiles
during mouse development
LEDA TORRES
1, ULISES JUÁREZ
1,2, LAURA GARCÍA
3,4, JUAN MIRANDA-RÍOS
4and SARA FRIAS*
,1,5 1Laboratorio de Citogenética, Depto. de Investigación en Genética Humana, Instituto Nacional de Pediatría, 2Posgradoen Ciencias Biológicas, Universidad Nacional Autónoma de México, 3Posgrado en Ciencias Biomédicas, Universidad Nacional Autónoma de México, 4Unidad de Genética de la Nutrición, Depto. Biología Molecular y Biotecnología, Instituto de Investigaciones Biomédicas, Universidad Nacional Autónoma de México e Instituto Nacional de Pediatría and 5Unidad de Genética de la Nutrición. Depto. Medicina Genómica y Toxicología Ambiental, Instituto de Investigaciones Biomédicas,
Universidad Nacional Autónoma de México e Instituto Nacional de Pediatría, México DF, México
ABSTRACT MicroRNAs (miRNAs) comprise a class of approximately 22 nucleotide regulatory non-coding RNAs that play several roles in diverse biological processes. Recent reports suggest that embryonic development in mammals is accompanied by dynamic changes in miRNA expression; however, there is no information regarding the role of miRNAs in the development of the external ear. The aim of this study was to determine the stage-specific expression of miRNAs during mouse external ear development in order to identify potentially implicated miRNAs along with their pos-sible targets. miRNA expression profiles from fetal mice pinnae and back skin tissues at 13.5 dpc and 14.5 dpc were obtained using an Affymetrix GeneChip miRNA 3.0 array. Biological triplicates for both tissues, each collected from a litter averaging 16 fetuses, were analyzed. The results were analyzed with Affymetrix’s Transcriptome Analysis Console software to identify differentially ex-pressed miRNAs. We observed differential expression of 40 miRNAs including some predicted to target genes implicated in external ear development, such as mmu-miR-10a, a miRNA known to modulate Hoxa1 mRNA levels, and mmu-miR-200c and mmu-miR-205. To our knowledge, this is the first miRNA expression profiling study of external ear development in mammals. These data could set the basis to understand the implications of miRNAs in normal external ear development
KEY WORDS:
miRNA, pinnae, auricle, microtia, GEO (GSE64945)
In mammals, the outer ear is formed by the ear pinna (i.e., the auricle and the external ear), the external acoustic meatus (i.e., the ear canal), and the outer layer of the tympanic membrane (i.e., the eardrum). The outer ear develops as a result of complex tissue in-teractions between ectoderm and mesoderm during embryogenesis. Outer ear development is driven by the mesenchyme of the first and second pharyngeal arches and is controlled, at least in part, by the genes that determine the first and the second pharyngeal arch identity. The auricle is formed from six protuberances in the first and the second arches known as the auricular hillocks (Jones and Chuan, 1934; Mallo and Gridley, 1996). In mice, several genes involved in external ear development have been identified, includ-ing Hoxa2, Hoxa1, Hoxb1, Prrx1, Dlx1, Dlx5, Six1, Six4, Sall1,
Tbx1, Bmp5, Fgf3, Fgf8, Fgf10 and Eya1. The genetic and cellular
mechanisms underlying normal morphogenesis of the external
www.intjdevbiol.com
*Address correspondence to: Sara Frias. Instituto Nacional de Pediatría México /Instituto de Investigaciones Biomédicas Universidad Nacional Autónoma de
México. Insurgentes Sur 3700-C, CP 04530, Col. Insurgentes-Cuicuilco, Mexico D.F., México. Tel: +52-55-1084-5533. E-mail: [email protected]; [email protected]
Accepted: 2 December 2015.
ISSN: Online 1696-3547, Print 0214-6282 © 2015 UBC Press
Printed in Spain
Abbreviations used in this paper: dpc, days post coitum; mmu, Mus musculus. ear are incompletely understood (Minoux et al., 2013; Luquetti et
al., 2012). Recent reports suggest that embryonic development in
mammals is accompanied by dynamic changes in the expression of an extensive class of regulatory molecules termed miRNAs (Lau
et al., 2001; Berezikov, 2011); therefore, these molecules could be
influencing the external ear development process.
develop-ment (Gavalas et al., 1998; Petri et al., 2014; Pasquinelli, 2012). The study of miRNAs is a novel field, and little is known about their role in organogenesis (the development of organs or tissues) or the mechanisms that regulate their expression and function (Pasquinelli, 2012). However, there have been several mice stud-ies that explored the role of miRNAs in the development of heart, retina, brain and inner ear. These studies have shown a particular spatiotemporal pattern of miRNAs expression, where specific sets of miRNAs are expressed in the developmental processes of each structure (Petri et al., 2014; Sacheli et al., 2009).
In the mouse, the study of miRNAs in the inner ear has shown temporal and spatial expression of the miR-96/-182/-183 cluster that correlates with the inner ear’s functional maturation (Sacheli et
al., 2009). However, the miRNA expression profile during external
ear development has not been assayed.
The purpose of this study was to determine the stage-specific expression of miRNAs during external ear development in mice under normal conditions and to identify the miRNAs along with their possible targets.
Results and Discussion
We describe the expression pattern of miRNAs involved in the development of the external ear in mice at two different stages of development; 13.5 days post coitum (dpc) and 14.5 dpc, us-ing GeneChip miRNA 3.0 arrays from Affymetrix. We compared the expression profiles from pinnae and back skin tissues and observed, as expected, that there are distinct patterns of miRNA expression between the tissues and the stages of development.
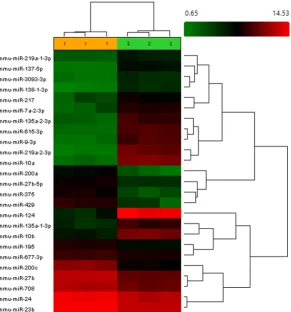
Fig. 1. Heat map of miRNA expression at 13.5 dpc, showing differentially expressed miRNAs between pinnae and back skin tissues. Hierarchical clusters of 25 miRNA genes were found to be significantly differentially expressed (adjusted p value <0.05) in pinnae compared to back skin controls. Each row of the hierarchical clusters represents an individual miRNA and each column represents one biological replica of either pinnae tissue (1) or skin tissue (2). The scale represents the gene expression intensity (log2 scale ranges between -1.5 and 1.5). Red color indicates an increase in miRNA gene expression (relative to the other expression measurements in the same row) and green indicates a decrease.
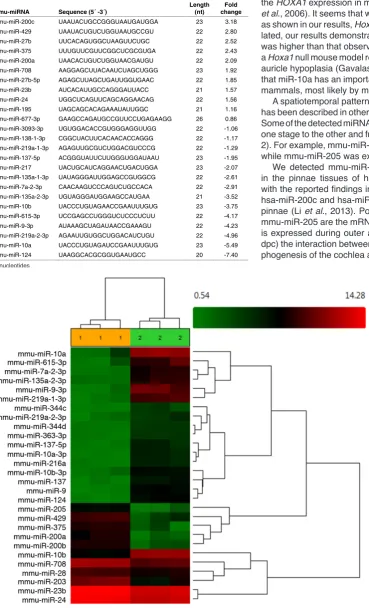
The differentially expressed miRNAs between pinnae and back skin tissues at 13.5 dpc and 14.5 dpc are shown as heat maps in Figs 1 and 2, respectively.
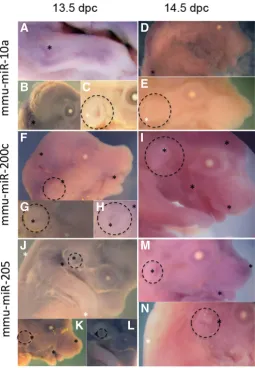
Spatial expression pattern showed by in situ hybridiza-tion of mmu-miR-10a, mmu-miR-205 and mmu-miR-200c at 13.5 and 14.5 dpc, confirmed the results observed by microarrays. We observed signal of mmu-miR-10a at both stages analyzed in the dorsal region and in the bones of anterior limbs, and almost undetectable signal in pinnae, the signal for mmu-miR-200c and mmu-miR-205 was present in lips and nose, as previously reported (Warner et al., 2014) and in pinnae, with high levels of 205 and low levels in the case of mmu-miR-200c at both stages (Fig. 3).
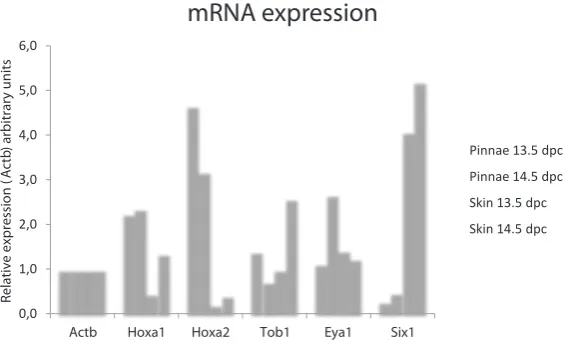
We performed real-time quantitative RT-PCR analysis in the interest to know if mRNAs of Hoxa1, Hoxa2, Tob1,
Eya1 and Six1 were present in pinnae or skin at the
stages studied. The relative expression levels of mRNAs
in relation to the Actb reference gene are presented in Fig. 4. We detected mRNA of the five genes studied in both tissues.
The microarrays analysis showed in fetal mice of 13.5 dpc, 25 different mmu-miRNAs differentially expressed in the pinnae with 11 of the mmu-miRNAs presenting elevated expression levels and 14 with lowered expression levels (Table 1). At 14.5 dpc, 31 different mmu-miRNAs showed differential expression in the pin-nae with 14 mmu-miRNAs displaying elevated levels of expression while 17 exhibited decreased levels of expression (Table 2). We observed that mmu-miR-429, mmu-miR-375, mmu-miR-200a, mmu-miR-708, mmu-miR-27b-5p, mmu-miR-23b and mmu-miR-24 were highly expressed in both stages. These miRNAs have sev-eral possible targets according to the consulted databases; some of them (like Eya1, Hoxa2 and Six4) are known to be related to external ear development. However, their interactions have not yet been corroborated.
It has been reported that in mouse embryo, miR-10a expression follows a HoxB-like expression pattern with a common regulatory element (Tanzer et al., 2005). According to previous luciferase activ-ity studies, it was suggested that miR-10a could be an inhibitor of the HOXA1 expression in megakaryocytic differentiation (Garzon
et al., 2006). It seems that when mmu-miR-10a expression is low,
as shown in our results, Hoxa1 mRNA levels will not be downregu-lated, our results demonstrate that Hoxa1 mRNA levels in pinnae was higher than that observed in back skin. Moreover, a report of a Hoxa1 null mouse model revealed that the deficient mice present auricle hypoplasia (Gavalas et al., 1998). These findings support that miR-10a has an important role during pinnae development in mammals, most likely by modulating the Hoxa1 expression.
A spatiotemporal pattern of miRNA expression, similar to what has been described in other tissues, was found in the external ear. Some of the detected miRNAs changed their expression levels from one stage to the other and from one site to the other (Tables 1 and 2). For example, mmu-miR-200c was expressed only at 13.5 dpc, while mmu-miR-205 was expressed at 14.5 dpc.
We detected mmu-miR-200c and mmu-miR-205 expression in the pinnae tissues of healthy mice (Fig. 3). This correlates with the reported findings in human patients with microtia where hsa-miR-200c and hsa-miR-205 have reduced expression in the pinnae (Li et al., 2013). Possible targets of mmu-miR-200c and mmu-miR-205 are the mRNAs of Six1 and Eya1. In mouse, Eya1 is expressed during outer and middle ear morphogenesis (13.5 dpc) the interaction between Eya1 and Six1 is crucial for the mor-phogenesis of the cochlea and the posterior ampulla during inner mmu-miRNA Sequence (5´ -3´) Length (nt) change Fold
mmu-miR-200c UAAUACUGCCGGGUAAUGAUGGA 23 3.18
mmu-miR-429 UAAUACUGUCUGGUAAUGCCGU 22 2.80
mmu-miR-27b UUCACAGUGGCUAAGUUCUGC 22 2.52
mmu-miR-375 UUUGUUCGUUCGGCUCGCGUGA 22 2.43
mmu-miR-200a UAACACUGUCUGGUAACGAUGU 22 2.09
mmu-miR-708 AAGGAGCUUACAAUCUAGCUGGG 23 1.92
mmu-miR-27b-5p AGAGCUUAGCUGAUUGGUGAAC 22 1.85
mmu-miR-23b AUCACAUUGCCAGGGAUUACC 21 1.57
mmu-miR-24 UGGCUCAGUUCAGCAGGAACAG 22 1.56
mmu-miR-195 UAGCAGCACAGAAAUAUUGGC 21 1.16
mmu-miR-677-3p GAAGCCAGAUGCCGUUCCUGAGAAGG 26 0.86
mmu-miR-3093-3p UGUGGACACCGUGGGAGGUUGG 22 -1.06
mmu-miR-138-1-3p CGGCUACUUCACAACACCAGGG 22 -1.17
mmu-miR-219a-1-3p AGAGUUGCGUCUGGACGUCCCG 22 -1.29
mmu-miR-137-5p ACGGGUAUUCUUGGGUGGAUAAU 23 -1.95
mmu-miR-217 UACUGCAUCAGGAACUGACUGGA 23 -2.07
mmu-miR-135a-1-3p UAUAGGGAUUGGAGCCGUGGCG 22 -2.61
mmu-miR-7a-2-3p CAACAAGUCCCAGUCUGCCACA 22 -2.91
mmu-miR-135a-2-3p UGUAGGGAUGGAAGCCAUGAA 21 -3.52
mmu-miR-10b UACCCUGUAGAACCGAAUUUGUG 23 -3.75
mmu-miR-615-3p UCCGAGCCUGGGUCUCCCUCUU 22 -4.17
mmu-miR-9-3p AUAAAGCUAGAUAACCGAAAGU 22 -4.23
mmu-miR-219a-2-3p AGAAUUGUGGCUGGACAUCUGU 22 -4.96
mmu-miR-10a UACCCUGUAGAUCCGAAUUUGUG 23 -5.49
mmu-miR-124 UAAGGCACGCGGUGAAUGCC 20 -7.40
TABLE 1
THE miRNAs DIFFERENTIALLY EXPRESSED IN PINNAE VERSUS SKIN BACK TISSUES AT 13.5 DPC
nt: nucleotides
ear development. (Kalatzis et al., 1998; Zheng et al., 2003). In addition, it has been observed that mutations in the human genes
EYA1, SIX1 and SIX5, cause the autosomal dominant syndrome
Branchio-Oto-Renal, an early developmental defect characterized by varying combinations of branchial (fistulas, sinuses, and cysts),
outer, middle and inner ear, as well as renal anomalies. (Song et
al., 2013). The RT-PCR analysis confirms the presence of mRNA
of Six1 and Eya1, both possible targets of mmu-miR-200c and mmu-miR-205. All together, these findings suggest that miR-200c and miR-205 have an important role during normal external ear development in mammals.
Furthermore, we observed in the pinnae tissues that mmu-miR-124 expression levels changed between the two analyzed stages. This miRNA remains low during 13.5 dpc and rises at 14.5 dpc, indicating that its activity is required in this stage. Recent reports have implicated this miRNA in neuronal development and aging processes (Neo et al., 2014). A miR-124 knockout mouse model resulted in clear reduction of mature miR-124 levels that led to de-fective neuronal survival and axonal outgrowth, along with smaller brain size (Sanuki et al., 2011). The participation of miR-124 in the development of the external ear has not been reported. However, mmu-miR-124 is predicted to have several putative target genes implicated in external ear development, such as Six4, Dlx5, Eya1 and Prrx1. Although none of these genes have been validated as direct targets of miR-124, these findings suggest that mmu-miR-124 might contribute to external ear development.
Moreover, bioinformatics analyses of putative mRNA targets for differentially expressed miRNAs, allowed us to propose nine new candidate genes (Zeb1, Zeb2, Tob1, Snai1, Smad5, Runx1,
Fig. 3. miRNA in situ hybridization (ISH) at 13.5 and 14.5 dpc. Black (*) marks indicate positive signal; white (*) marks indicate absence of signal. Dashed circle surrounds pinna region. (A-C) ISH of mmu-miR-10a at 13.5 dpc; (D,E) ISH of mmu-miR-10a at 14.5 dpc; (F-H) ISH of mmu-miR-200c at 13.5 dpc; (I) ISH of mmu-miR-200c at 14.5 dpc; (J-L) ISH of mmu-miR-205 at 13.5 dpc and (M,N) ISH of mmu-miR-205 at 14.5 dpc. (A) Signal of mmu-miR-10a is present in the bone of anterior limbs. (B) Presence of mmu-miR-10a in the back skin, according with the microarrays results. (C)
Pinna with significantly lower signal of mmu-miR-10a as compared with back skin. (D) Lateral view of fetus with strong mmu-miR-10a expression in the back skin. (E) Undetectable expression of mmu-miR-10a in pinna.
(F) Presence of mmu-miR-200c in head and face 13.5 dpc, heavy mark in lips commissure, and light signal in skin surrounding pinnae. (G) and
(H) Pinna closer view with detectable stain for mmu-miR-200c. (I) Head and face 14.5 dpc with mmu-miR-200c detection, positive signal was observed in all face and head, including the pinna. (J) Detectable signal of mmu-miR-205 in pinna and surrounding skin, and undetectable signal in anterior limbs and back skin. (K) Nose, lips commissure and pinna with positive signal. (L) Closer view of pinna showing mmu-miR-205 expression.
(M) mmu-miR-205 is present in pinna, lips and nose. (N) mmu-miR-205 is almost absent in back skin and present in the pinna area.
G
mmu-miR-205 UCCUUCAUUCCACCGGAGUCUG 22 5.92
mmu-miR-203 GUGAAAUGUUUAGGACCACUAG 22 3.76
mmu-miR-429 UAAUACUGUCUGGUAAUGCCGU 22 3.37
mmu-miR-200a UAACACUGUCUGGUAACGAUGU 22 2.74
mmu-miR-200b UAAUACUGCCUGGUAAUGAUGA 22 2.73
mmu-miR-375 UUUGUUCGUUCGGCUCGCGUGA 22 2.63
mmu-miR-205-3p GAUUUCAGUGGAGUGAAGCUCA 22 2.02
mmu-miR-708 AAGGAGCUUACAAUCUAGCUGGG 23 1.92
mmu-miR-27b-5p AGAGCUUAGCUGAUUGGUGAAC 22 1.76
mmu-miR-24 UGGCUCAGUUCAGCAGGAACAG 22 1.46
mmu-miR-23b AUCACAUUGCCAGGGAUUACC 21 1.43
mmu-miR-497 CAGCAGCACACUGUGGUUUGUA 22 1.09
mmu-miR-28 AAGGAGCUCACAGUCUAUUGAG 22 1.06
mmu-miR-324-3p CCACUGCCCCAGGUGCUGCU 20 0.71
mmu-miR-363-3p AAUUGCACGGUAUCCAUCUGUA 22 -0.76
mmu-miR-344c UGAUCUAGUCAAAGCCUGACAGU 23 -0.77
mmu-miR-344d GAUAUAACCACUGCCAGACUGA 22 -0.85
mmu-miR-216a UAAUCUCAGCUGGCAACUGUGA 22 -1.39
mmu-miR-137 UUAUUGCUUAAGAAUACGCGUAG 23 -1.44
mmu-miR-10a-3p CAAAUUCGUAUCUAGGGGAAUA 22 -1.65
mmu-miR-10b-3p CAGAUUCGAUUCUAGGGGAAUA 22 -1.92
mmu-miR-124-5p CGUGUUCACAGCGGACCUUGAU 22 -2.19
mmu-miR-9 UCUUUGGUUAUCUAGCUGUAUGA 23 -2.27
mmu-miR-7a-2-3p CAACAAGUCCCAGUCUGCCACA 22 -2.84
mmu-miR-135a-2-3p UGUAGGGAUGGAAGCCAUGAA 21 -3.02
mmu-miR-615-3p UCCGAGCCUGGGUCUCCCUCUU 22 -3.22
mmu-miR-344 UGAUCUAGCCAAAGCCUGACUGU 23 -3.39
mmu-miR-10b UACCCUGUAGAACCGAAUUUGUG 23 -3.81
mmu-miR-219-3p AGAAUUGUGGCUGGACAUCUGU 22 -3.94
mmu-miR-9-3p AUAAAGCUAGAUAACCGAAAGU 22 -5.13
mmu-miR-10a UACCCUGUAGAUCCGAAUUUGUG 23 -5.61
TABLE 2
THE miRNAs DIFFERENTIALLY EXPRESSED IN PINNAE VERSUS SKIN BACK TISSUES AT 14.5 DPC
Runx2, Crim1 and Dicer1) that could be participating in external
ear development in mice. Zeb1 and Zeb2 encode transcription factors that are involved in neural development and in the develop-ment of tissues derived from neural crest cells (Shin et al., 2012).
Tob1 may negatively regulate the BMP/Smad signaling pathway
in osteoblasts, a signaling pathway that has also been implicated in external ear development of early stage mice (Yoshida et al., 2000; Minoux et al., 2013) We found mRNA of Tob1 in pinnae (Fig. 4), but the interaction with mmu-miR-200c, mmu-miR-205 and mmu-miR-429, their possible regulators, is still unknown. The remaining genes, Sani1, Runx1 and Runx2, have been implicated in the process of chondrogenesis (Yoshida and Komori, 2005; Chen and Gridley, 2013).
In summary, we observed that there is a specific spatiotemporal pattern of miRNA expression during external ear development at 13.5 dpc and 14.5 dpc.
This analysis is the first miRNA expression profiling study during external ear development in mammals. Thus, it could set up the basis for understanding the role of miRNAs in normal external ear development in mammals and for determining miRNA involvement in the etiology of external ear congenital malformations, such as microtia.
Materials and Methods
Mice
The CD1 mouse strain was used in this study. Scheduled mating was carried out in order to obtain fetuses at specific developmental stages. Pregnant females were sacrificed at 13.5 dpc or 14.5 dpc. The gestational age of the fetus was determined by the day of appearance of the vaginal plug (0.5 dpc) and confirmed by morphological criteria. All procedures were performed in accordance with the Mexican regulation NOM-062-ZOO-1999 norm and the Guide for the Care and Use of Laboratory Animals, Institute for Laboratory Animal Research of the National Academy of Sciences. The Institutional Animal Care and Use of Laboratory Animals and Research Committees from the Instituto Nacional de Pediatría approved this study.
0,0
Fig. 4. mRNA relative expression levels at 13.5 and 14.5 dpc. Comparative mRNA expression levels in pinnae and back skin tissues of putative mRNA targets of the mmu-miR studied. Relative expression levels for each gene and each comparison between tissues were calculated using the formula of relative expression (R=2-ΔΔCp) (Pfaffl, 2006).
Tissues samples and RNA extraction
Biological triplicates for each tissue and each development stage were analyzed. One litter represents one biological replica and each litter had an average of 16 fetuses. External ear tis-sue, the pinna (cartilage and skin), and back skin tissues were dissected under stereomicroscope in iced and cooled nuclease free PBS (Gibco, Waltham, MA USA) and were kept in RNAlater (Ambion, Waltham, MA USA) at -80°C until further processing. The region used as reference (back skin) is of an ectodermal origin, is close to the pinnae on the embryo and it differentiates at the same developmental stage. Using the reference region, we were able to identify the miRNAs that were specifically expressed in the external ear in these stages. Total RNA extraction including short RNAs (<200 bp) was performed with an RNA Mini elute kit (Qiagen, Venlo, Netherlands) and quantification was performed with a NanodropTM spectrophotometer (Nanodrop Technologies,
Wilmington, DE, USA). RNA quality was monitored by agarose gel electrophoresis.
miRNA array analysis
Affymetrix GeneChip miRNA Arrays 3.0 (Affymetrix, Santa Clara, CA, USA) were used to screen the miRNA profile expression during external ear development. A single array is comprised of 179,217 probes that represent 19,913 mature miRNA contained in miRBase V.17 (www.mirbase.org) with probes for 153 different organisms, including 1111 probes for Mus musculus miRNAs and 855 pre-miRNAs. The array analysis followed the manufacturer’s instructions. Briefly, 500 ng of total RNA, including short RNAs, was labeled with the FlashTag ® Biotin HSR kit (Genisphere/Affymetrix, Santa Clara, CA, USA) and the labeling was tested using an Enzyme Linked Oligosorbent Assay (ELOSA) QC As-say (Thermo Fisher Scientific Inc, Waltham, MA, USA). The denaturalized samples were then injected into array chips and hybridized at 48°C and 60 rpm for 17 hours in an Affymetrix Hybridization Oven 645. Arrays were then stained and washed in the Affymetrix GeneChip Fluidic Station 450 and scanned using an Affymetrix GeneChip Scanner 3000 7G (Affymetrix, Santa Clara, CA, USA).
The array data were normalized by global normalization using the miRNA QC Tool of the Expression Console software (Affymetrix, Santa Clara, CA, USA). To identify differentially expressed miRNAs at each stage, linear regression analysis using the Bioconductor LiMMa (Lineal Models for Microarrays) algorithm was employed. Hierarchical clustering analysis was performed with the Bioconductor and Transcriptome Analysis Console software from Affymetrix. The microarrays data were deposited in the Gene Expression Omnibus database (accession number GSE64945).
Putative mRNA targets for differentially expressed miRNAs were identi-fied using the bioinformatic predicting tools TargetScanMouse Release 6.2 (www.targetscan.org) miRNA body Map (www.mirnabodymap.org), miRBase (www.mirbase.org) and DIANA Tools (Tarbase, microT v4 and microT-CDS), (http://diana.imis.athena-innovation.gr/DianaTools).
Real-time quantitative RT-PCR analysis
Technologies, Wilmington, DE, USA).
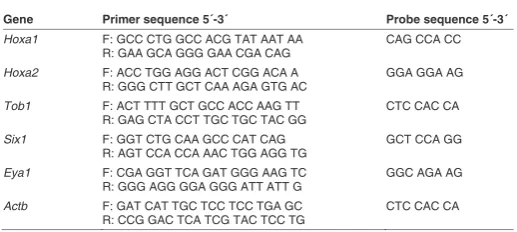
Real-time quantitative-PCR (q-PCR) was performed on cDNA samples in duplicate for two biological repeats. The q-PCR was performed with the Universal Probes system (Roche Diagnostics, GmbH, Mannheim, Germany) and the Light Cycler Taq Man Master kit (Roche Diagnostics, GmbH, Mannheim, Germany). Besides target genes expression, Actb expression was quantified as reference gene. Primers for each gene were designed on line with the ProbeFinder Software (www.universalprobelibrary.com) and manufactured at Sequencing and Synthesis Unit (IBT, UNAM). The primers and the universal probe sequences for each gene are indicated in Table 3. The q-PCR was carried out in the Light Cycler 2.0 Carousel Roche equipment and the conditions were as follows: 1 cycle at 95°C for 10 min-utes, denaturalization at 95°C for 10 seconds, annealing at 60°C for 30 seconds and extension and detection at 72°C for 5 seconds for a total of 45 cycles. Relative expression levels for each gene and for each tissue were calculated using the formula of relative expression R=2-ΔΔCp (Pfaffl, 2006).
Whole mount in situ hybridization
The protocol followed was the recommended by Exiqon (Exiqon, Vedbæk, Denmark) (Thisse et al., 2004; Kloosterman et al., 2006) with modifications. Briefly, embryos were fixed overnight at 4oC in 4% paraformaldehyde in
PBS and subsequently transferred to 25%, 50%, 75% and 100% methanol in PBST (PBS containing 0.1% Tween-20), and stored at –20oC until
fur-ther processing. At the first day of the in situ hybridization embryos were rehydrated by successive washes for 5 min at room temperature (RT) in 75%, 50%, 25% and 100% PBST (4 x 5 min). Embryos were treated with 10 ug/ml proteinase K (Roche Diagnostics, GmbH, Mannheim, Germany) in PBST for 45 min at 37oC, refixed for 20 min in 4% paraformaldehyde
in PBS at RT and washed 5 x 5 min with PBST at RT. The embryos were then transferred to hybridization mix (HM)(50% Formamide, 5x SSC, pH 6.0, 0.1% Tween, 9.2 mM citric acid, 50 ug/ml heparin, 500 ug/ml yeast RNA) and prehybridized for 2-3 hour at the hybridization temperature (57oC
for probes mmu-miR-205 and mmu-miR-200c, 53oC for probe
mmu-miR-10a). Hybridization was performed in fresh pre-heated hybridization buffer containing 10 nM of DIG labeled LNA probe (Exiqon, Vedbæk, Denmark) overnight, at the hybridization temperature. Post-hybridization washes were done at the hybridization temperature by successive incubations for 15 min in HM without heparin and yeast RNA, 75% HM-/25% 2x SSC, 50% HM-/50% 2x SSC, 25% HM-/75% 2x SSC, 100% 2x SSC, twice in 0.2x SSC 30 min. Subsequently, embryos were transferred to PBST through successive incubations for 10 min at RT in 75% 0.2x SSC/25% PBST, 50% 0.2x SSC/50% PBST, 25% 0.2x SSC/75% PBST and 100% PBST. After washing the embryos were exposed for 1 hour in blocking buffer (1X blocking in PBST) (Roche Diagnostics, GmbH, Mannheim, Germany), then were incubated overnight at 4oC in blocking buffer containing anti-DIG-AP
FAB fragments (1:2000) (Roche Diagnostics, GmbH, Mannheim, Germany). The next day, embryos were washed once in PBST 5 min RT, after 5 x 1 hour in PBST and then at 4oC in PBST overnight. After the post-antibody
washes, the embryos were washed 3 x 5 min in staining buffer (100 mM Tris HCl pH9.5, 50 mM MgCl2, 100 mM NaCl, 0.1% tween 20). Staining was done in buffer supplied with 4.5 ul/ml NBT (50 mg/ml stock)(Roche Diagnostics, GmbH, Mannheim, Germany) and 3.5 ul/ml BCIP (50 mg/ml stock)(Roche Diagnostics, GmbH, Mannheim, Germany). The reaction was stopped with 1 mM EDTA in PBST and the embryos were refixed for 60 min in 4% paraformaldehyde in PBS at RT and washed 5 x 5 min with PBST at RT. For observation and imaging the embryos were mounted in 50% glycerol. The embryos were observed under a stereoscopic micro-scope over petri dishes coated with a layer of 1% agarose (± 2 mm thick) prepared in PBS; pictures were taken using a digital camera, first for the complete embryo and then for specific structures as pinnae and limbs.
Acknowledgments
Financial support: Federal Funding from the Instituto Nacional de Pedi-atría 053/2013. U. Juarez received a CONACyT scholarship 270077. We would like to thank the personnel of the animal care facility of the Instituto Nacional de Pediatría, for their professional work with the mice, to Dra. Diana Escalante for their valuable advice for in situ hybridization technique and to Dra. Ana Valeria Martínez Silva from Instituto de Fisiología Celular, UNAM for technical support, to Dr. Benilde García de Teresa for their valu-able comments and revision of the manuscript, to Dr. Pablo González for bioinformatics analysis, and to the Sequencing and Synthesis Unit from the Instituto de Biotecnología, UNAM, for primer synthesis.
References
BEREZIKOV E (2011). Evolution of microRNA diversity and regulation in animals.
Nat Rev Genet 12: 846-860.
CHEN Y, GRIDLEY T (2013). Compensatory regulation of the Snai1 and Snai2 genes during chondrogenesis. J Bone Miner Res 28: 1412-1421.
GARZON R, PICHIORRI F, PALUMBO T, IULIANO R, CIMMINO A, AQEILAN R, VO-LINIA S, BHATT D, ALDER H, MARCUCCI G, CALIN GA, LIU CG, BLOOMFIELD CD, ANDREEFF M, CROCE CM (2006). MicroRNA fingerprints during human megakaryocytopoiesis. Proc Natl Acad Sci USA 103: 5078–5083.
GAVALAS A, STUDER M, LUMSDEN A, RIJLI FM, KRUMLAUF R, CHAMBON P (1998). Hoxa1 and Hoxb1 synergize in patterning the hindbrain, cranial nerves and second pharyngeal arch. Development 125: 1123-1136.
JONES FW, CHUAN WI (1934). The development of the external ear. J. Anat 68:525-533.
KALATZIS V, SAHLY I, EL-AMRAOUI A, PETIT C (1998). Eya1 expression in the developing ear and kidney: towards the understanding of the pathogenesis of Branchio-Oto-Renal (BOR) syndrome. Dev Dyn 213: 486-99
KLOOSTERMAN WP, WIENHOLDS E, de BRUJIN E, KAUPPINNEN S, PLASTERK RH (2006). In situ detection of miRNAs in animal embryos using LNA-modified oligonucleotide probes. Nat Methods 3: 27-29
LAU NC, LIM LP, WEINSTEIN EG, BARTEL DP (2001). An abundant class of tiny RNAs with probable regulatory roles in Caenorhabditis elegans. Science 294: 858-862. LI C, HAO S, WANG H, JIN L, QING F, ZHENG F, ZHANG P, CHEN L, MA D, ZHANG
T (2013). MicroRNA expression profiling and target genes study in congenital microtia. Int J of Pediatr Otorhinolaryngol 77: 483-487.
LUQUETTI DV, HEIKE CL, HING AV, CUNNINGHAM ML, COX TC (2012). Microtia: Epidemiology and genetics. Am J Med Genet 158A: 24-139.
MALLO M, GRIDLEY T (1996). Development of the mammalian ear: Coordinate regulation of formation of the tympanic ring and the external acoustic meatus.
Development 122: 173-179.
MINOUX M, KRATOCHWIL CF, DUCRET S, AMIN S, KITAZAWA T, KURIHARA H, BOBOLA N, VILAIN N, RIJLI FM (2013). Mouse Hoxa2 mutations provide a model for microtia and auricle duplication. Development 140: 4386-4397.
NEO WH, YAP K, LEE SH, LOOI LS, KHANDELIA P, NEO SX, MAKEYEV EV, SU IH (2014). MicroRNA miR-124 controls the choice between neuronal and astrocyte differentiation by fine-tuning Ezh2 expression. J Biol Chem 289: 20788-20801. PASQUINELLI AE (2012). Non-Coding RNA MicroRNAs and their targets: recognition,
regulation and an emerging reciprocal relationship. Nat Rev Genet 13: 271-282. PETRI R, MALMEVIK J, FASCHING L, AKERBLOM M, JAKOBSSON J (2014).
Gene Primer sequence 5´-3´ Probe sequence 5´-3´
Hoxa1 F: GCC CTG GCC ACG TAT AAT AA
miRNAs in brain development. Exp Cell Res 321: 84-89.
PFAFFL MW (2006). Relative quantification. In Real-time PCR. (Ed. M. Tevfik Dorak),Taylor & Francis Group. New York, N Y. pp 63-80.
SACHELI R, NGUYEN L, BORGS L, VANDENBOSCH R, BODSON M, LEFEBVRE P, MALGRANGE P (2009). Expression patterns of miR-96, miR-182 and miR-183 in the developing inner ear. Gene Expr Patterns 9:364-370.
SANUKI R, ONISHI A, KOIKE C, MURAMATSU R, WATANABE S, MURANISHI Y, IRIE S, UNEO S, KOYASU T, MATSUI R (2011). miR-124a is required for hip-pocampal axogenesis and retinal cone survival through Lhx2 suppression. Nat
Neurosci 14: 1125–1134.
SHIN JO, KIM EJ, CHO KW, NAKAGAWA E, KWON HJ, CHO SW, JUNG HS (2012). BMP4 signaling mediates Zeb family in developing mouse tooth. Histochem Cell
Biol 137: 791-800.
SONG MH, KWON TJ, KIM HR, JEON JH, BAEK JI, LEE WS, KIM UK, CHOI JY (2013). Mutational analysis of EYA1, SIX1 and SIX5 genes and strategies for manage-ment of hearing loss in patients with BOR/BO syndrome. PLoS One 8: e67236
TANZER A, AMEMIYA CT, KIM CB, STADLER PF (2005). Evolution of microRNAs located within Hox gene clusters. J Exp Zool B Mol Dev Evol 304: 75-85. YOSHIDA CA, KOMORI T (2005). Role of Runx proteins in chondrogenesis. Crit Rev
Eukaryot Gene Expr 15: 243-254.
THISSE B, HEYER V, LUX A, ALUNNI V, DEGRAVE A, SEILIEZ I, KIRCHNER J, PARKHILL JP, THISSE C. (2004). Spatial and temporal expression of the zebrafish genome by large-scale in situ hybridization screening. Methods Cell
Biol 77: 505-519.
WARNER DR, MUKHOPADHYAY P, BROCK G, WEBB CL, PISANO MM, GREENE RM (2014). MicroRNA expression profiling of the developing murine upper lip.
Develop Growth Differ 56: 434-447.
YOSHIDA Y, TANAKA S, UMEMORI H, MINOWA O, USUI M, IKEMATSU N, HOSODA E, IMAMURA T, KUNO J, YAMASHITA T, MIYAZONO K, NODA M, NODA T, YAMAMOTO T (2000). Negative regulation of BMP/Smad signaling by Tob in osteoblasts. Cell 103: 1085-1097.
The molecular biology of ear development - “Twenty years are nothing”
Fernando Giraldez and Bernd Fritzsch Int. J. Dev. Biol. (2007) 51: 429-438
http://www.intjdevbiol.com/web/paper/072390fg
5 yr ISI Impact Factor (2013) = 2.879
Pocket proteins and cell cycle regulation in inner ear development
Sonia M.S. Rocha-Sanchez and Kirk W. Beisel Int. J. Dev. Biol. (2007) 51: 585-595
http://www.intjdevbiol.com/web/paper/072387sr
Patterning and morphogenesis of the vertebrate inner ear
Jinwoong Bok, Weise Chang and Doris K. Wu Int. J. Dev. Biol. (2007) 51: 521-533
http://www.intjdevbiol.com/web/paper/072381jb
Molecular evolution of the vertebrate mechanosensory cell and ear
Bernd Fritzsch, Kirk W. Beisel, Sarah Pauley and Garrett Soukup Int. J. Dev. Biol. (2007) 51: 663-678
http://www.intjdevbiol.com/web/paper/072367bf
Mouse models to study inner ear development and hereditary hearing loss
Lilach M. Friedman, Amiel A. Dror and Karen B. Avraham Int. J. Dev. Biol. (2007) 51: 609-631