Single Parameter Model for Free Recall And the Nature of Partially Filled Working
Memory
Eugen Tarnow, Ph.D.
18-11 Radburn Road
Fair Lawn, NJ 07410
[email protected] (e-mail)
Abstract:
I present a single parameter model of free recall and fit the one parameter, the probability per time unit of an item in working memory entering the next memory store (similar to Atkinson and Shiffrin, 1968), to the original Murdock (1962) data. Working memory is modeled as having space for a maximum of 4 items (Cowan, 2001).
Introduction
Short list recall probabilities is the focal point of many important issues: the number of chunks that can be held in focus at any one time, which happens to be 4 (Cowan, 2001), how items in working memory go into the next memory store, which items are recalled in which order, etc. There are many complex models that exist (for a review see Daming (2009)) but the more complex the model and the more parameters used the more difficult it is to evaluate the interplay between the experimental data and the model itself. In this paper I am going to make the simplest possible model and see what information can be obtained. It is a model that I would expect would be used in text books because of its simplicity but also one that has important things to say about the shape of the initial part of the free recall curves, i.e. about the properties of a partially filled working memory.
Model
In this model an item can be either in working memory (WM), in the next memory store (NMS) or lost. Working memory can handle up to four chunks (Cowan, 2001). We are going to assume that experimental items are to be treated as chunks. As a new item is presented the probability that it goes into working memory is 1 and the probability that each of the items in working memory leave working memory is ¼. While in working memory the
probability per unit time that an item is transferred into NMS is α for small times. Before the list is presented,
WM is unfilled and it is assume that the first four items do not leave WM.
My model is a simplification of Atkinson & Shiffrin (1968) in which four parameters were used, the buffer size (set to 4 by the data in Cowan (2001)), the probability of entering WM (effectively set to 1 in my model), the decay rate of information from LTS (effectively set to 0 in my model. Note that having a non-zero decay rate suggests that the NMS should not be termed LTS as in Atkinson & Shiffrin (1968)).
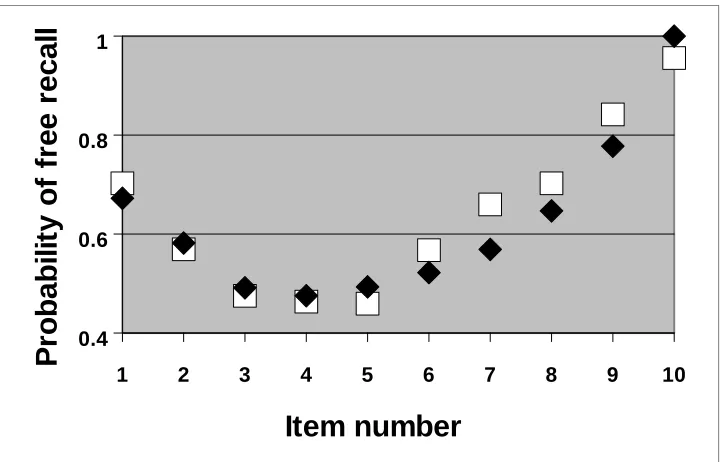
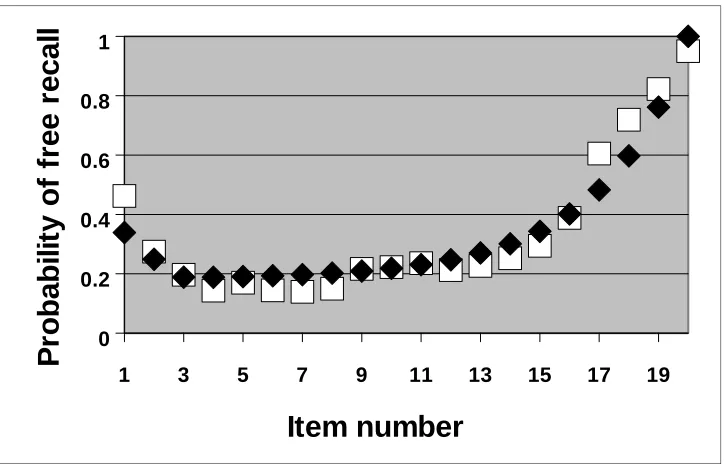
Fig. 1a. The probability of free recall from the Murdock 10-2 experiment compared with the model fit using the
parameter α=0.11/second. R squared is 0.994.
It is presently not known just how working memory works on the biochemical level (my own prediction is in Tarnow (2009)) and it is not known why there is a limit of four chunks although there are some speculations (Cowan, 2001). Not much is known either about the nature of the four chunk limit. For example, one can ponder whether one item in WM takes up one quarter of the space or whether it takes up all the space. The first four items tell us important information about the partially filled working memory because they are presumably independent of how items in WM are displaced since they come from an assumption that no items are displaced until WM is full.
My one parameter model predicts that the three differences in recall probabilities of the first and second, second
and third and third and forth items are proportional to α with proportionality constants
1
−
3
/
4
N−4 ,1
−
3
/
4
N−4 and
¾
N−4
1
−
3
/
4
N−4
where N is the number of items in the list. Variouscombinations of these differences have similar properties. These proportionality constants are “rules” that
experimental measurements should fulfill if the theory is correct. In particular, their ratios are independent of α
and only dependent on the partially filled working memory.
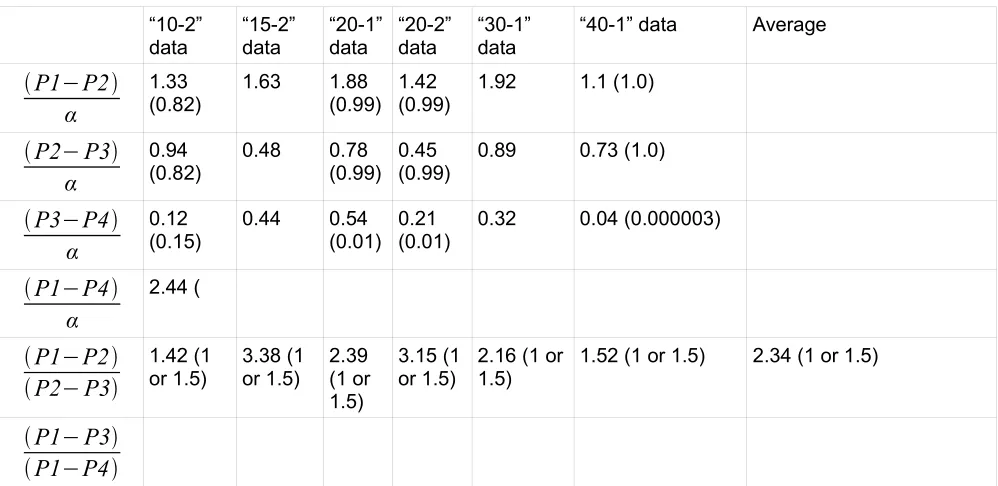
Let's have a look what experimental measurements can tell us about these three constants. In table 1 is shown
the constants calculated from the Murdock (1962) data. The α values used are the α values used in the initial
fits.
1 2 3 4 5 6 7 8 9 10
0.4 0.6 0.8 1
Item number
Pr
oba
bi
li
ty
of
f
ree
r
e
cal
“10-2” data “15-2” data “20-1” data “20-2” data “30-1” data
“40-1” data Average
P1
−
P2
α
1.33
(0.82) 1.63 1.88(0.99) 1.42(0.99) 1.92 1.1 (1.0)
P2
−
P3
α
0.94 (0.82) 0.48 0.78 (0.99) 0.45 (0.99)0.89 0.73 (1.0)
P3
−
P4
α
0.12
(0.15) 0.44 0.54(0.01) 0.21(0.01) 0.32 0.04 (0.000003)
P1
−
P4
α
2.44 (
P1
−
P2
P2
−
P3
1.42 (1
or 1.5) 3.38 (1or 1.5) 2.39(1 or
1.5)
3.15 (1
or 1.5) 2.16 (1 or1.5) 1.52 (1 or 1.5) 2.34 (1 or 1.5)
P1
−
P3
P1
−
P4
Table 1. Values of difference constants calculated from Murdock (1962) data. The theoretical values are shown in parenthesis.
The experimental data is noisy and differences of noisy measurements tend to be noisier than the numbers. There seems to be somewhat of an agreement, however. If the experimental data were to improve, my model can make another prediction. One measurement of this would be whether a single item in WM has a probability
of α to go into NMS or whether it has a probability of 4α . In the latter case, the theoretical predictions of the
One item, one channel One item, 4 channels, two items 2 channels each, 3 items 4/3 channels each
P1
−
P2
α
1
−
3
/
4
N−42
1
−
3
/
4
N−4
P2
−
P3
α
1
−
3
/
4
N−44
/
3
1
−
3
/
4
N−4
P3
−
P4
α
¾
N−4
1
−
3
/
4
N−4
¾
N−4
1
−
3
/
4
N−4
P1
−
P2
P2
−
P3
1 1.5
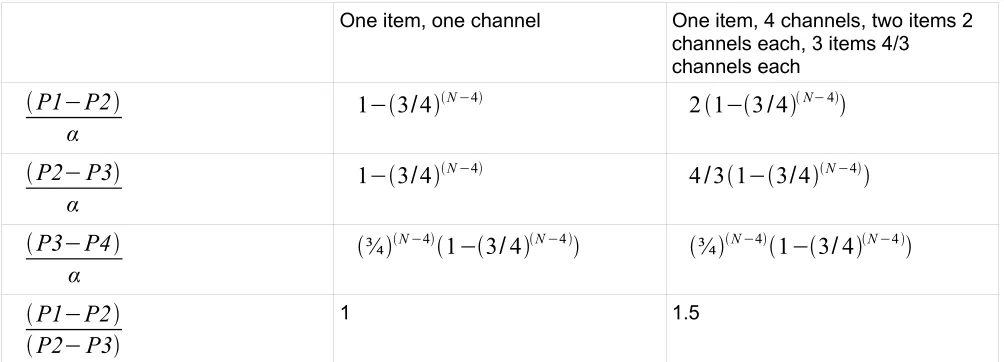
Table 2. Theoretical values of difference constants in two types of partially filled WM: the second column shows the case for which each item is treated as a single item even if WM is partially filled, the third column shows the case for which each item fills up as much of WM as is possible. The last row shows the ratio that experiment should use to distinguish between the two cases (see below). It is independent of the total number of items in the list.
Notice that the third difference is the same for the two cases. Since α is not known experimentally, the two
cases can be simplest distinguished by the ratio of
P1
−
P2
P2
−
P3
. If each item gets a single channel in anotherwise empty WM the ratio should be 1, otherwise it should be 1.5, independent of the number of items in the list. The calculations from measurements in Murdock (1962) are shown in Table 1. Two values are 1.5 and two values are much larger. The experimental noise is too high to give us an answer but from now on we will select the second possibility for the model because it seems to fit the beginning items the best.
Fig. 2a-f show the model and Murdock (1962) results for the six experiment assuming a working memory in which the single item takes up the full working memory. While I could have used only one fitting constant, I
included one for each measurement to show that there is a variation in α that makes sense: The trend in α is to
become lower the higher the number of items or the longer the experiment takes. This may reflect boredom from the experimental subjects, the longer the experiment the lower the probability of moving an item from WM to NMS. Note that the partially filled properties of working memory can be done with very small lists, minimizing the subjects' boredom.
implying that the potential rehearsal of working memory items themselves improves their recall probabilities.)
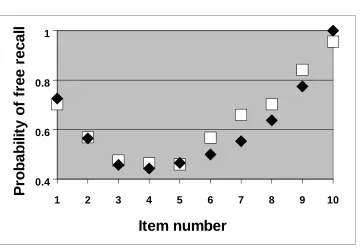
Fig. 2a. The probability of free recall from the Murdock 10-2 experiment compared with the model fit using the
parameter α =0.098/second and one item – four channels. R squared is 0.992. Average over the last four items
is 0.79 versus fitted 0.74.
1 2 3 4 5 6 7 8 9 10
0.4 0.6 0.8 1
Item number
Pr
oba
bi
li
ty
of
f
ree
r
e
cal
Fig. 2b. The probability of free recall from the Murdock 15-2 experiment compared with the model fit using the
parameter α=0.093/second and one item – four channels. R squared is 0.989.Average over the last four items is
0.80 versus fitted 0.74.
Fig. 2c.The probability of free recall from the Murdock 20-1 experiment compared with the model fit using the
parameter α=0.091/second and one item – four channels. R squared is 0.978. Average over the last four items
is 0.77 versus fitted 0.71.
1 3 5 7 9 11 13 15 17 19
0 0.2 0.4 0.6 0.8 1
Item number
P
ro
b
abi
li
ty of
f
ree r
ecal
l
1 3 5 7 9 11 13 15
0 0.2 0.4 0.6 0.8 1
Item number
P
ro
b
abi
li
ty of
f
ree r
e
cal
Fig. 2d. The probability of free recall from the Murdock 20-2 experiment compared with the model fit using the
parameter α=0.070/second and one item – four channels. R squared is 0.988. Average over the last four items
is 0.77 versus fitted 0.72.
Fig. 2e. The probability of free recall from the Murdock 30-1 experiment compared with the model fit using the
parameter α=0.0088/second and one item – four channels. R squared is 0.979. Average over the last four items
is 0.78 versus fitted 0.71.
1 3 5 7 9 11 13 15 17 19
0 0.2 0.4 0.6 0.8 1
Item number
Pr
oba
bi
li
ty
of
f
ree
r
e
c
a
ll
1 6 11 16 21 26
0 0.2 0.4 0.6 0.8 1
Item number
P
ro
b
abi
li
ty of
f
ree r
ecal
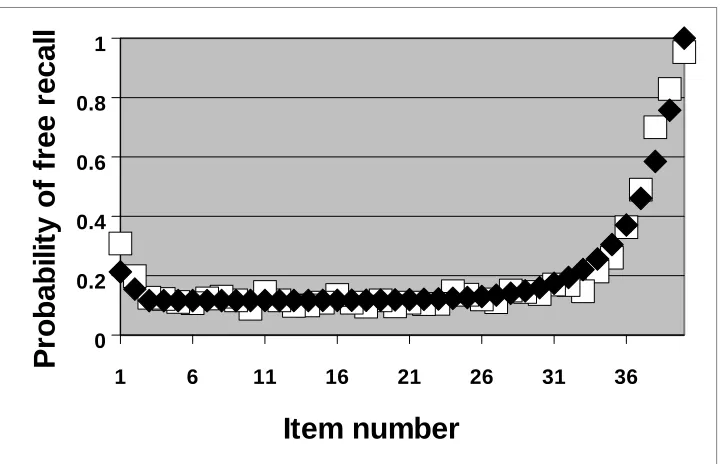
Fig. 2f The probability of free recall from the Murdock 40-1 experiment compared with the model fit using the
parameter α=0.058/second and one item – four channels. R squared is 0.984. Average over the last four items
is 0.74 versus fitted 0.70.
Finally, Cowan (2001) finds that some subjects may have 3 or 5 as a working memory chunk limit. My model fits to the 10-2 curve under those circumstances are shown in Fig. 3. The differences are not all that large, again suggesting the importance of a high statistics experiment. The number of starting points above the bottom is (chunk limit – 2), the middle items move up and down unpredictably with the chunk limit, the last items, excluding the very last item, move up with the chunk limit.
1 6 11 16 21 26 31 36
0 0.2 0.4 0.6 0.8 1
Item number
Pr
oba
bi
li
ty
of
f
ree
r
e
c
a
Fig. 3. The probability of free recall with the model fit for 3, 4 and 5 places in WM. Note that the number of starting points above the bottom is (chunk limit – 2).
Acknowledgements
I thank the Bennet Murdock, Jeroen Raaijmakers, Steve Schmidt for critical readings, the Computational Memory Lab at University of Pennsylvania for their on-line database which contained the Murdock (1962) data (http://memory.psych.upenn.edu/DataArchive).
0 1 2 3 4 5 6 7 8 9 10
0 0.1 0.2 0.3 0.4 0.5 0.6 0.7 0.8 0.9 1
Single parameter model WITH 3 CHANNEL WM
Single parameter model WITH 5 CHANNEL WM
REFERENCES
Atkinson, R. C., & Shiffrin, R. M. (1968). Human memory: A proposed system and its control processes. In K. W. Spence & J. T. Spence (Eds.), The psychology of learning and motivation: Advances in research and theory (Vol. 2, pp. 89-195). New York: Academic Press.
N Cowan. (2001) The magical number 4 in short-term memory: A reconsideration of mental storage capacity.-Behavioral and Brain Sciences 24(1):87-114.
Daming. Serial Position Curves in Free Recall. Preprint.
Murdock Jr., Bennet B. The serial position effect of free recall. Journal of Experimental Psychology. Vol 64(5), Nov 1962, 482-488.
Tarnow. (2009) Short term memory may be the depletion of the readily releasable pool of presynaptic