Complex Motion Processing
Richard Stewart Watson
University of London
Phd
ProQuest Number: U642060
All rights reserved
INFORMATION TO ALL USERS
The quality of this reproduction is dependent upon the quality of the copy submitted.
In the unlikely event that the author did not send a complete manuscript and there are missing pages, these will be noted. Also, if material had to be removed,
a note will indicate the deletion.
uest.
ProQuest U642060
Published by ProQuest LLC(2015). Copyright of the Dissertation is held by the Author.
All rights reserved.
This work is protected against unauthorized copying under Title 17, United States Code. Microform Edition © ProQuest LLC.
ProQuest LLC
789 East Eisenhower Parkway P.O. Box 1346
Table of Contents
Abstract
6
List of Figures and Tables
7Chapter 1
Introduction
1.1 A bstract 26
1.2 Literature Review 27
1.2.1 The Utility o f M otion Inform ation 27
1.2.2 The Com putational Approach 28
1.2.3 M odelling Optic Flow A nalysis 32
1.2.4 Physiology 35
1.2.5 Psychophysics 37
1.2.5.1 Speed and D irection in Local M echanism s 38 1.2.5.2 Speed and D irection in Global M echanism s 40
Chapter 2
General Methods
2.1 Technical Issues 48
2.1.1 Sam pling the O bserver’s Psychom etric Function 48
2.1.2 Stimuli 49
2.1.3 Data Processing 54
2.1.4 M odel Fitting 57
2.1.5 G oodness-of-Fit 60
2.1.6 Confidence Lim its on the Param eters Estim ated 62
2.1.7 Softw are and H ardware 64
2.1.7.1 Softw are Code Generation 64
2.1.7.3 The V isual Display U nit (VDU) 66
2.2 M ethods 69
Chapter 3
Direction Band widths of Rotation, Radial and Translation
Motion Mechanisms
3.1 A bstract 72
3.2 Introduction 73
3.3 E xperim ent 1 77
3.3.1 M ethods 80
3.3.2 Results 82
3.3.3 Discussion 86
3.4 E xperim ent 2 90
3.4.1 M ethods 91
3.4.2 Results and D iscussion 91
3.5 Experim ent 3 100
3.5.1 M ethods 104
3.5.2 Results 107
3.6 General Discussion 108
Chapter 4
The Dependency of Sensitivity on Spatial Frequency in Radial Flow
4.1 A bstract 112
4.2 Introduction 113
4.3 Experim ent 1 117
4.3.1 M ethods 117
4.3.2 Results 124
4.4.1 M ethods 127
4.4.2 Results 129
4.5 Discussion 131
Chapter 5
Nulling the Radial Motion Speed Illusion
5.1 A bstract 135
5.2 Introduction 136
5.2.1 An Overview o f the Experim ents 143
5.3 Experim ent 1 143
5.3.1 M ethods 144
5.3.2 Results 147
5.4 Experim ent 2 150
5.4.1 M ethods 150
5.4.2 Results 151
5.5 Experim ent 3 152
5.5.1 M ethods 153
5.5.2 Results 153
5.6 Discussion 155
5.7 C onclusions 161
Chapter 6
Discrimination of Speed in Radial, Rotation and Translation
Motion Mechanisms
6.1 A bstract 163
6.2 Introduction 164
6.3 E xperim ent 1 168
6.3.1 M ethods 171
6.4 Experim ent 2 180
6.4.1 M ethods 183
6.4.2 Results 184
6.5 Experim ent 3 190
6.5.1 M ethods 191
6.5.2 Results 193
6.6 Discussion 199
Chapter 7
Do Relative Motion and Binocular Disparity Interact in the
Detection of Shear Motion?
7.1 A bstract 202
7.2 Introduction 203
7.3 Experim ent 1 209
7.3.1 M ethods 209
7.3.2 Results 213
7.4 Experim ent 2 216
7.4.1 M ethods 217
7.4.2 Results 218
7.5 Experim ent 3 220
7.5.1 M ethods 220
7.6 Results and Discussion 223
Chapter 8
Conclusions
228Bibliography
233Appendix 1
ABSTRACT
W hen an observer m oves, or objects in his field o f view move, com plex patterns com prising a heterogeneous range o f speeds and directions are projected onto the retinae. Several classes o f these optic flow patterns have been identified, including translation, rotation, radiation and shear. This thesis investigates the properties o f m otion-sensitive detectors in hum an vision using established psychophysical techniques.
T he range o f directions to w hich rotation and radial m otion d etectors are sensitive w ere m easured. These ‘bandw idths’ w ere found to be narrow er than estim ated by previous investigators, a result that is incom patible w ith the notion that com plex patterns are coded by a basis set o f elem entary com ponents.
The size and spectral content selectivity o f expansion detectors was m easured. Surprisingly the visual system prefers pattern elem ents not to change size as they approach, contrary to real life. Sim ilarly, optim al perform ance was found with constant spatial frequency, except at high speeds. W e conclude that the spatial frequency tuning o f low-level m otion detectors places a fundam ental lim it on the detection o f radial patterns.
A cue conflict paradigm was used to explore the exaggerated speed experienced with radial motion. A dditional depth cues w ere ineffective in com prom ising the illusion, suggesting that it may not be due to a m otion-in-depth interpretation, or that cue com bination in the visual system w eights relative m otion m ore highly than other depth cues.
The sm allest difference in speed that can be discrim inated in rotation, radial m otion and tran slatio n p atterns w as m easu red using tw o techniques. W e conclude that thresholds are in keeping w ith existing literature, though results were inconsistent betw een techniques.
List of Figures and Tables
Chapter 1 : Introduction
Figure 1.1 E la b o ra te d R e ic h ard t D etecto r. L o c a lised spatial freq u en cy filters, SF, and SF2, respond to sim ilar patterns appearing at two different retinal locations. Each response is delayed by the TD units before being m ultiplied with the other un-delayed signal. If the tim e delay in TD m atches the tim e taken for the pattern to travel across the retina the correlation o f the signals is registered by the m u ltip lic a tio n units, X. U nits TA p ro v id e tem poral averaging over a short duration, before the signals are finally subtracted from each other to provide a directional response.
Figure 1.2 The half-height bandw idth o f a m otion detector with a G aussian tuning profile. The detector responds m axim ally when stim ulated by a m otion at 0 degrees. The height o f the horizontal line is positioned at h a lf o f this peak. The w idth o f the m echanism is conventionally taken w here the horizontal line in tersects the G aussian p ro file and can be e stim ated from the x axis by projecting vertically from the intersection points. In this exam ple the half-height bandw idth is from - 1 8 degrees to 18 degrees, i.e. 36 d egrees. A ltern a tiv e ly the b a n d w id th can be com p u ted m athem atically by taking the inverse o f the G aussian form ula at the intersection points.
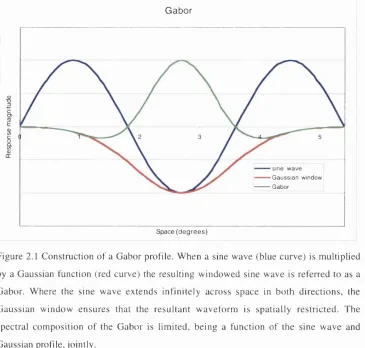
Gaussian w indow ensures that the resultant w aveform is spatially restricted. The spectral com position o f the G abor is lim ited, being a function o f the sine wave and Gaussian profile, jointly.
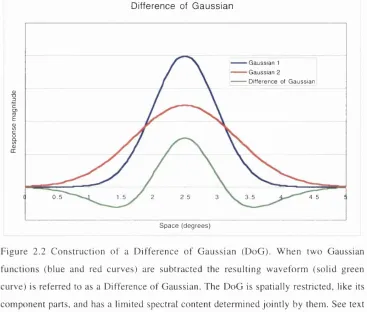
Figure 2.2 C onstruction o f a D ifference o f G aussian (DoG). W hen two G aussian functions (blue and red curves) are su b tracted the resu ltin g w aveform (solid green curve) is refe rre d to as a D ifference o f G aussian. The D oG is spatially restricted, like its com ponent parts, and has a lim ited spectral content determ ined jointly by them . See text for details.
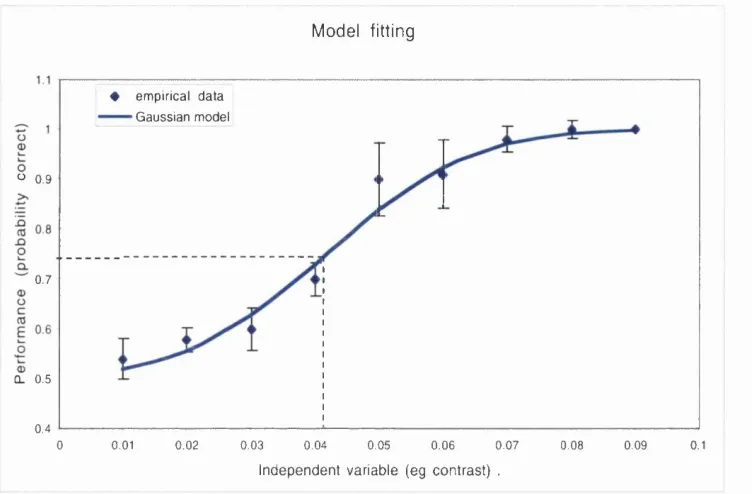
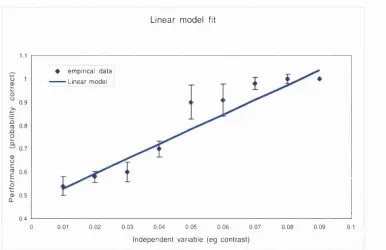
Figure 2.3 A sigm oid function (blue curve) fitted to a hypothetical data set (blue diam onds). The graph show s how the p ro b ability o f a correct answ er (on the y-axis) varies with the signal strength o f the in d e p e n d e n t v a ria b le on the x -ax is. In th is case the independent variable is the contrast o f signal in a tw o alternative, forced choice (2A FC ) detection task. P erform ance range: the c h o ic e b e tw e en 2 o p tio n s y ie ld s a m in im u m th e o re tic a l p e rfo rm a n c e o f 0.5 d ue to g u e s sin g , w ith a m ax im u m perform ance o f 1 at the highest stim ulus values.
Figure 2.5 L inear fit. The data from figure 2.3 are fitted here by a straight line. Although the error m etric has been m inim ised, the data is not fitted well by this m odel.
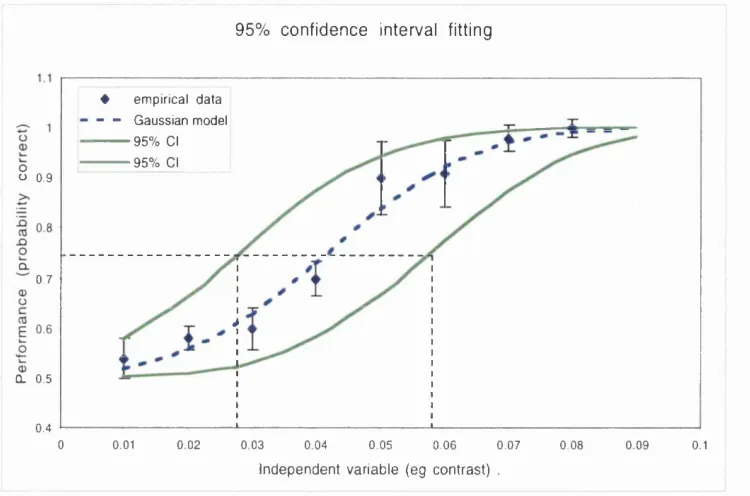
Figure 2.6 Confidence intervals. The broken blue curve was used to estim ate a perform ance threshold at a p ro b ability correct o f 0.75. T he uncertainty attached to this estim ate is indicated by a confidence interval (C.I.) that has a defined likelihood o f containing the true threshold value. The confidence interval is obtained by fitting two additional m odels to the data set (green curves). T he slope param eter o f the green m odels is identical to that o f the best- fitting blue m odel. Their position along the stim ulus axis (x-axis) is determ ined not by m inim isation o f the error betw een the data and the m odel, b ut by aim ing the optim isation procedure at a defined error value based on the error obtained in fitting the best- fit m odel. See text for details. The C.I. is bounded by the stim ulus values found by projecting from p(correct)= 0.75 to each o f the green m odels (broken lines).
Chapter 3: Direction B andw idths o f Rotation, Radial and Translation M otion M echanism s
dynam ic stim ulus and are added to assist the reader. The subjects n o m inated: a) in w hich location the signal occurred, and b) w hether the signal dots flow ed to the right or left o f vertical.
Figure 3.2 R e sp o n se tu n in g cu rv e s o f d ire c tio n a lly se n sitiv e m o tio n m ec h a n ism s. F ig u re 3.2A show s resp o n se activ ity to high co n trast stim uli on the y-axis is p lo tted as a function o f the stim ulus direction, and is represented here as a Gaussian function. M e c h a n is m B re s p o n d s m a x im a lly to v e rtic a l m o tio n . M echanism s A & C respond m axim ally to m otion slightly left and slightly right o f vertical, respectively. Figure 3.2B shows the reduced response o f the sam e m echanism s to low contrast stim uli, as used in E xperim ent 1. The m echanism s now do not overlap in th e ir resp o n ses, so p sy c h o p h y sic a l perfo rm an ce is m ediated solely by the m ost responsive m echanism .
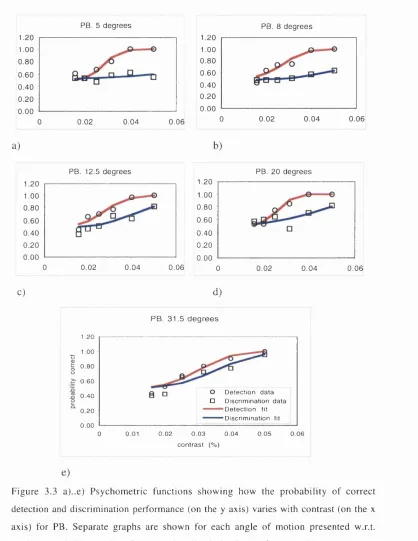
Figure 3.3 P sychom etric functions show ing how the probability o f correct detection and discrim ination perform ance (on the y axis) varies w ith contrast (on the x axis). Separate graphs are shown for each angle o f m otion presented w .r.t. vertical. A t shallow angles o f p re s e n ta tio n d isc rim in a tio n p e rfo rm a n c e is very p o o r, n o t re a c h in g a s y m p to te . A s th e a n g le o f m o tio n in c re a s e s discrim ination perform ance im proves. D etection perform ance is good regardless o f the direction of the motion.
are rep roduced on each figure. P oints o f co n v ergence w ere calculated by solving the equations sim ultaneously for a com m on value, these being taken to represent the point at which responses w ere in dependent o f the co n trib u tio n o f the vertical m otion m echanism . Error bars are 95% confidence intervals.
Table 3.1 B andw idth estim ates o f local translation m echanism s in degrees (colum n 2). E stim ates o f h a lf o f the full w idth o f a directional m otion analyser taken from the point o f convergence o f curves best-fitting detection and discrim ination thresholds, see text and figure 3.4. As directions tested w ere sym m etrical about zero degrees, the data w ere co llap sed , rem oving the sign o f the d irection. C onsequently, full w idth bandw idths are found by d o u b lin g the calc u la te d w idths, colum n 3. B an d w id th s are conventionally quoted as full w idth at h a lf height (colum n 4), w hich can be calculated on the assum ption that the response profiles o f m echanism s are Gaussian, and that their m easured full width is equivalent to 6 standard deviations (see text for details).
the points at which curves A & C intersect with curve B (scenario 2, 'w inner-take-air com bination rule), the half-height bandw idth is not calculable w ithout know ledge o f the separation betw een m echanism s.
Figure 3.6 Schem atic o f a 2*2AFC detection & discrim ination trial. Stim uli w ere presented in two spatial locations, both o f which contained a field o f 200 D ifference o f G aussian dots. In the ‘noise’ location, right, all dots have a direction com ponent chosen at random to produce incoherent m otion signals. The signal location (signal + noise), left, com prises two populations o f dots. One population o f d o ts shares an id en tical d ire c tio n co m ponent, in this case translating approxim ately 40 degrees to the right o f vertical (filled dots). The rem aining dots each have a random ly chosen direction com ponent (unfilled). A rrow s and filling show n here w ere not present in the dynam ic stim ulus and are added to assist the reader. The subjects nom inated: a) in w hich location the signal occurred, and b) w hether the signal dots flow ed to the right or left o f vertical.
Table 3.3 Sum m ary o f the findings o f studies w here the breadth o f the tuning functions o f m otion sen sitiv e m echanism s have been estim ated or implied.
* calculated from the au th o rs’ w idth estim ates, w hich has been assum ed to reflect the full w idth o f a single m echanism , whose response profile is presum ed to be Gaussian.
Figure 3.7 Schem atic o f a detection and discrim ination trial. B oth spatial locations contain a 200 dot RDK. Panel B has random m otion as indicated. In Panel A if the dots follow ed the blue arrow s they w ould form a pure rotation. In fact an angular offset is added to this ideal rotation trajectory such that dots follow the red arrows, sim ulating an inward spiral m otion. Several levels o f the angular offset variable w ere explored, a m otion coherence threshold for both detection and discrim ination being established for each. Subjects w ere required to detect in w hich location the spiral appeared (detection), and w hether it was an inw ard or outw ard spiral (discrim ination).
Figure 3.8 The response function o f a hypothetical detector tuned to rotation m otion, m o d elled as a G au ssian fu n ction. T he blue arrow indicates the stim ulation presented by a set o f ideal local m otions form ing a rotating pattern (see text and figure 3.9). The red arrow represents the stim ulation caused by a spiral pattern, form ed by perturbing the ideal rotation trajectories by an angular offset o f - 30 degrees. The detector can be said to have a bandw idth along the dim ension o f angular offset.
m ust travel from their start point to their destination in the same time. As tim e is constant the length o f the arrows is proportional to the speed o f each dot. It is apparent that the speed o f each dot in such a pattern is related to its eccentricity from the centre of rotation.
Figure 3.10 Schem atic o f a detection and discrim ination trial. B oth spatial locations contain a 200 dot RD K. Panel B has random m otion as indicated. In Panel A if the dots follow ed the blue arrow s they would form a pure expansion. In fact an angular offset is added to this ideal rotation trajectory such that dots follow the red arrows, sim ulating clockw ise spiral m otion. Several levels o f the angular offset variable w ere explored, a m otion coherence threshold for both detection and discrim ination being established for each. Subjects w ere required to d etect in w hich location the spiral appeared (detection), and w h eth er it w as clockw ise or a n ti clockw ise (discrim ination).
C hapter 4: The D ependency o f Sensitivity on Spatial Frequency in Radial Flow
Figure 4.1 Schem atic o f a 2AFC detection trial. Stim uli w ere presented in tw o spatial locations, both o f w hich contained a field o f 75 D ifference o f Gaussian dots. In the ‘noise’ location, right, all dots h av e a directio n co m p o n en t ch o sen at random to p ro d u ce incoherent m otion signals. The signal location (signal + noise), left, com prises two populations o f dots. One population o f dots referred to as ‘signal’ (filled) are arranged to produce a radially structured pattern, either contraction, or expansion (show n). The re m a in in g d o ts each h av e a ra n d o m ly ch o sen d ire c tio n com ponent (unfilled). A rrow s and filling show n here w ere not present in the dynam ic stim ulus and are added to assist the reader. T he subjects nom inated the location in w hich they perceived radial motion.
Figure 4.2 Elem ent size changes o f D ifference o f G aussian (DoG) elem ents. A veridical sim ulation o f an approaching object increases in retinal size betw een first (left) and second (right) sam ples o f its m o tio n . T he g ro w th ra te o f e le m e n ts w as m a n ip u la te d independently o f the rate at w hich elem ents diverged from each other. Panel A illustrates zero grow th rate betw een sam ples. Subsequent panels show veridical grow th (B), tw ice the veridical rate (C) and four tim es the veridical rate (D).
size and spatial relationships in the original plane (the com puter display), p ro je c t from the observation point through the new p o sitio n . T h e sim ulated m o tio n -in -d e p th has p rese rv ed the relationships betw een dot size and the centre-to-centre distance betw een texture elem ents (divergence).
Figure 4.3b The geom etry o f sim ulating a field o f tw o random dots (black rectangles) approaching an observer, with dot-size increasing at a greater rate than specified by divergence. The dots at point A in the upper panel (at tim e 1) are to m ove to point B, low er panel at tim e 2. T o calculate their spatial relationships and size in the original plane, p ro ject from the observation point. To distort elem ent grow th rate the size o f the dots in the projection plane has been exaggerated. The centre-to-centre relationships betw een elem ents has been preserved, keeping divergence rates am ong dots equal to the ‘reference’ sim ulation depicted in figure 4.3a.
Table 4.1 M ean change in the peak spatial frequency o f R D K dots as a function o f speed and elem ent growth conditions.
Figure 4.4 C oherence thresholds for detecting radial m otion. T hree curves are shown, one for each speed condition explored. Thresholds on the y-axis are plotted as a function o f the elem ent grow th rate, on the x-axis. Each data point represents the m ean threshold o f three observers. E rror bars are one standard error o f the m ean.
sam e filter applied to different dots results in spectrally sim ilar dots, differing in size.
Figure 4.6 Frequency spectra o f a sam ple o f the filtered dots o f Experim ent 2. D ots o f different sizes w ere convolved with the sam e filter, resu ltin g in isotropic elem ents differing in size, yet sharing a com m on spatial frequency com position. Sizes o f dots p rior to filtering are listed in the insert.
Figure 4.7 C oherence thresholds for detecting radial m otion. T hree curves are shown, one for each speed condition explored. Thresholds on the y-axis are plotted as a function o f the elem ent grow th rate, on the x-axis. Each data point represents the m ean threshold o f three observers. Error bars are one standard error o f the mean.
Chapter 5: N ulling the Radial M otion Speed Illusion
Figure 5.2 The geom etry o f crossed (panel A) and uncrossed (panel B) disparities. Point F is the point o f fixation point O is the location o f an object in the scene. In panel A the object is closer than the fixation plane, and its projection falls on opposite sides o f the fixation points on the retinae, as indicated by the directions o f the arrow s. Panel B show s how an o b ject fu rth er from fixation projects to the same side, relative to the fixation image.
Figure 5.3 A stereo pair showing an expanding stim ulus. Each im age shows a field o f dots travelling in the directions indicated by the arrows. By view ing through a W heatstone stereoscope, only one im age is seen by each eye. Each im age contains exactly the sam e spatial arrangem ent o f dots, but those in the right panel are displaced to the right relative to the surrounding black fram e. The m ark on the top edge o f the w indow s is the p o in t that subjects w ere asked fixate during a trial
Figure 5.5 C om parison betw een the m agnitudes o f the speed illusion in E xperim ent 1 (filled bars) and E xperim ent 2 (open bars). In Experim ent 1 the disparity applied to the radial pattern rem ained at a co n stan t level th ro u g h o u t a trial. In E x p erim en t 2 the disparity varied during the trial, consistent with m otion through depth. The data show that the m agnitude o f the speed illusion was not affected by the dynam ic disparity m anipulation o f Experim ent
2.
Figure 5.6 C om parison betw een the m agnitudes o f the speed illusion in E x p erim en t 1 (filled b ars), E x p e rim e n t 2 (open bars) and Experim ent 3 (grey bars). In E xperim ent 1 the radial pattern had a fixed d isp arity th ro u g h o u t each trial. In E x p e rim en t 2 the disparity varied during the trial, consistent w ith m otion through depth. In Experim ent 3 disparity varied throughout a trial, and the size o f dots ch an g ed c o n siste n t w ith the m o tio n -in -d e p th signalled by the disparity change. The pattern o f results across all three experim ents shows the speed illusion to be insensitive to these depth m anipulations.
Chapter 6: D iscrim ination o f Speed in R adial, R otation and T ranslation M otion M echanism s
Figure 6.2 ‘Speed b a la n c in g ’ in the signal-in-noise stim ulus. W hen two anim ations containing global m otion are presented in the speed discrim ination task o f E x p erim ent 1, the signal speed o f one pattern, the ‘R eference’ is fixed (Panel B). The signal speed in the ‘T est’ pattern is m anipulated (Panel A, double headed arrow ) to generate a psychom etric function. This would norm ally result in a difference betw een the average speeds o f the test and reference patterns that could be used to discrim inate betw een them . To rem ove this w e m anipulated the speed o f the ‘n o ise ’ dots in the reference pattern (Panel B, double headed arrow s) in concert with the signal speed in the test pattern. This m anipulation ensured that both anim ations shared the sam e average and peak speeds at all tim es. Speed profiles are triangular in shape reflecting how dot density varies w ith eccentricity, i.e. there are m ore high-speed dots at the outer circum ference o f a rotating disc than there are near its centre. M ore dots appear in the periphery, and they travel at greater speed.
Figure 6.3 Exam ples o f psychom etric functions relating the probability o f seeing the test pattern as faster (y-axis) to the m edian speed o f the test pattern (x-axis). Panels A & B show data for the R adial condition. (NB O bserver AS was unable to perform this task). Panels C, D & E show data for the Rotation condition, and panels F, G & H show the Translation data. B lue diam onds signify the em pirical data points, the best-fitting cum ulative Gaussian (solid purple line) is flanked by curves delim iting the 95% confidence interval.
lo w -speed condition (m edian speed= 1.57 degrees/s), panel B show s the sam e in fo rm atio n fro m the hig h -sp eed condition (m edian speed=3.14 degrees/s). E rror bars are 95% confidence intervals.
Figure 6.5 E xam ple o f stim uli used in E xperim ent 2. A pair o f concentric annuli equated for stim ulus area, w ere presented. Each com prised a field o f 200 random ly positioned D ifference o f G aussian dots. B oth annuli shared the sam e direction o f rotation, clockw ise or anti-clockw ise, chosen at random on each trial. The observers ju d g e d w hich annulus app eared faster. T hree co n d itio n s o f annulus diam eter were used: Panel A ‘L arge-M edium ’; Panel B ‘L arg e S m all’; Panel C “M ed iu m -S m all’. T he larger diam eter a n n u lu s was alw ays the fix e d -sp e e d refe re n c e p atte rn . See M ethods for dim ension details.
Figure 6.6 Points o f subjective equality (PSE) betw een concentric rotating annuli o f unequal diam eter (Experim ent 2). For each observer the curves show how the P S E ’s (y-axis) vary with the m ean speed o f the reference pattern (x-axis). T he reference w as alw ays the larger o f the pair. D ata (blue diam onds) are fitted w ith a linear regression, w hose equation and value are reproduced on the graphs. The solid yellow line is the perform ance predicted if the subjects w ere m atching pattern speeds using local linear dot speeds. The solid purple line shows the predicted m atch if angular velocity were being used.
taking the in v erse o f the b e st-fittin g cu m u la tiv e G aussian function to the subject’s psychom etric function. Thresholds were only calculated w here the subject’s perform ance on the task was consistent with the use o f angular velocity, i.e. when the point o f s u b je c tiv e e q u a lity a c ro ss a ran g e o f sp e ed c o n d itio n s qualitatively m atched the point o f objective equality predicted by an angular velocity m atching strategy.
Figure 6.7 E xam ple o f stim uli used in E x p erim ent 3. A pair o f adjacent annuli that w ere equated for stim ulus area w ere presented. Each com prised a field o f 200 random ly positio n ed D ifference o f Gaussian dots. Both annuli shared the same direction o f rotation, clockw ise or anti clockw ise, chosen at random on each trial. The observers judged which pattern appeared faster. Three conditions o f annulus diam eter were used: Panel A ‘L arge-M edium ’; Panel B ‘L arge-S m all’; Panel C “M edium -S m alT . The larger diam eter annulus w as alw ays the fix e d -sp e e d refe re n c e p atte rn . See M ethods for dim ension details.
Table 6.2 Speed discrim ination thresholds obtained w ith non-concentric rotating annuli. Thresholds are expressed as the percentage speed increase required by the test pattern over the reference pattern for the test to be ju d g ed faster on 75% o f trials. T his speed was calculated by taking the inverse o f the best-fitting cum ulative G au ssian fu n ctio n to the s u b je c t’s p sy c h o m e tric fu n ctio n . Thresholds were only calculated w here the subject’s perform ance on the task was consistent with the use o f angular velocity, i.e. w hen the point o f subjective equality across a range o f speed conditions qualitatively m atched the point o f objective equality predicted by an angular velocity m atching strategy.
Figure 6.9 Sum m ary histogram o f speed d iscrim in atio n thresh o ld s as a function o f observer and view ing configuration that resulted in m atching using angular velocity.
Chapter 7: D o R elative M otion and B in o cu lar D isparity In teract in the Detection o f Shear M otion?
Figure 7.1 As an observer travels in the direction indicated by arrow A, a typical landscape gives rise to opposing directions o f m otion on the retin a, arrow s B and C. W hen c o m b in e d w ith d ep th in fo rm atio n this relativ e m otion (R M ) is d iag n o stic o f the o b se rv e r’s direction o f travel. A scene c o n tain in g a sm ooth change in depth produces a sm ooth speed gradient, with velocity falling to zero at the fixation point.
is proportional to the speed com ponent o f the m otion vector. The progressive change in arrow length w ith vertical displacem ent from the centre o f fixation (black dot) reflects the sm ooth speed gradient observed when view ing a flat ground plane.
Figure 7.3 Schem atic representation o f the th re e c o n d itio n s o f d ep th structure sim ulated using binocular disparity. Panel A shows the RD K elem ents receding sm oothly in depth, as a landscape w ould ( ‘slan ted ’). Panel B show s dots random ly distributed in depth (ra n d o m ’) and Panel C show s all dots at a c o n sta n t depth ( ‘fix e d ’). D istances show n w ere calculated with respect to the screen o f the V D U, which was view ed from a distance o f 57cm. Filled dots are signal, whose directions produce shear m otion (not shown), unfilled dots are directionally random noise dots.
Figure 7.4 M otion coherence thresholds for the detection o f shear m otion (vertical axis) as a function o f m edian speed (horizontal axis) and disparity condition (red, blue and yellow curves). The first three graphs show data for each o f the three observers separately. Error bars are 95% confidence intervals. A s the data for each subject were sim ilar the final graph shows the data for all three observers collapsed. Error bars are one standard error o f the mean.
Figure 7.6 M otion coherence thresholds for the detection o f shear m otion (vertical axis) as a function o f m edian speed (horizontal axis) and disparity condition (red, blue and yellow curves). T he three graphs show data for each o f the observers separately. E rror bars are 95% confidence intervals.
Figure 7.7 Schem atic representation o f the th re e c o n d itio n s o f d epth structure sim ulated in Experim ent 3. Signal dots (filled) obey the three disparity conditions, as before. N oise dots now occupy their own depth plane at all times.
Chapter 1
Introduction
1.1 Abstract
1.2 Literature Review
1.2.1 The Utility of Motion Information
A note on term inology. U nlike electrophysiologists, psychophysicists can never be sure w hether a single neuron or a group o f neurons is responsible for the patterns o f perform ance shown by observers. In com m on with the psychophysics literature hypothetical ‘m echanism s’ (Graham , 1985) or an appropriate synonym such as ‘detecto rs’ or ‘an aly sers’ will be referred to in order to describe the underlying neural hardw are that is presum ed to be responsible for sensing visual stimuli.
T he ability to process im age m otion is ex p lo ited in m any w ays by living organism s. The study o f this ability has value to those interested in how hum an and anim al brains function, and to those concerned with autom ating processes that previously required hum an involvem ent. N akayam a (1985) p ro vided a com prehensive review o f the tasks that m otion detection helps us to perform . These include: navigation through com plicated environm ents; estim ating tim e to collision during navigation; the detection o f m oving objects; the control o f eye m ovem ents; im age segm entation, and the analysis o f the relative depth structure o f the environm ent. This thesis is concerned w ith the m otion m echanism s that detect and interpret the retinal m otion produced by self-m ovem ent in the world. These signals were term ed ‘optic flow ’ by G ibson (1950, 1979), w ho recognised th at m uch valuable inform ation w as contained in the com plicated array o f m otion vectors produced by locom otion.
m otion. Finally, fundam ental to any m ovem ent are the attributes o f speed and direction. M uch psychophysical effort has been directed at investigating the ability o f hum ans to code speed and direction, and the results o f this work are described below . N aturally, the results from each field influence one another, and their interaction guides the direction o f future research.
U nfortunately, two conventions have arisen in the literature on com plex patterns o f m otion, w here com m on term s are used having different m eanings. Som e investigators refer to translation to describe the m otion o f the observer, w here others talk about the tran slatio n o f retinal signals. S im ilarly, ro tatio n is som etim es used in body coordinates, e.g. rotation o f the head or eye, versus a rotating field o f m otion signals on the retina. To avoid confusion all references to translation, rotation (and radiation, which has not been duplicated) throughout the thesis will refer to retinal motion signals, not observer motion.
1.2.2 The Computational Approach
The m atching or correspondence model.
Furtherm ore the m odel takes as its starting point some o f the very properties we w ould like to end up w ith (object properties), and w hich m otion can be so helpful in extracting. The well-known phenom ena o f structure from m otion (e.g. Longuet-H iggins & Prazdny, 1980) illustrates that m otion may not only precede but also be necessary for the segm entation o f a scene into constituent objects. F o r these reasons we know that m otion is coded very early in the visual pathw ays, and since low -level cells do not have object features available to them, m odels w orking on quite different principles have been proposed.
C orrelator models.
tl
t2
At (t2-tl)
Figure 1.1 Elaborated Reichardt Detector. Localised spatial frequency filters, SF, and
SF2, respond to similar patterns appearing at tw o different retinal locations. Each
response is delayed by the TD units before being multiplied with the other un-delayed
signal. If the time delay in TD matches the time taken for the pattern to travel across the
retina the correlation of the signals is registered by the multiplication units, X. Units TA
provide temporal averaging over a short duration, before the signals are finally
The single channel, pre-filter m odel.
A m odel that inhabits a m iddle ground betw een low -level spatial frequency m atching on one hand and global feature m atching on the other is that o f M organ (1992) (see also M organ & Fahle, 1992 and M organ & M ather, 1994). The m odel o f M organ and colleagues differs from low -level m odels in the filtering applied to the input. A s p ointed out in the previous section, the generally accepted existence o f several ‘independent’ spatial frequency channels has led to the assum ption that m otion detection occurs separately in spatial frequency bands, before these m otion signals are com bined to produce a final decision on the likely m otion param eters present. (The initial conception that spatial frequency channels are independent has not survived intact. See W ilson & W ilkinson, 1997). Their single-channel, pre-filter m odel places ju st one filter, o f Gaussian profile according to later w ork (M organ & M ather, 1994), ahead o f m otion detection. W att & M o rg a n ’s (1 9 8 5 )‘zero-bounded re g io n s’ are the features that are m atched, the zero boundary being the zero crossing o f M arr & H ildreth (1980) that is taken to signify an o b je c t’s edge. I f such a bounded region can be taken as the outline o f an object then the m odel detects the m otion o f high-level features. On the other hand its earliest incarnation used the zero- crossings them selves as the m atched features, w ithout the further constraint that they should form a bounded region. This am bivalence regarding the exact nature o f the representations to be used in the m atching process stems from the fact that the m odel was developed prim arily to account for the em pirical data on D„,a^. The nam e 0^,3% i s given to the m axim um distance across w hich a dot can be displaced while still eliciting som e m easure o f apparent m otion in the observer, for exam ple direction discrim ination.
The Gradient M odel.
com paring steep lum inance and tem poral gradients m ight yield the speed and d irection estim ates req u ired (see also H arris, 1986; M ather, 1990). This technique has the advantage o f using a very low -level m eans o f extracting one sim ple feature from the array, achievable using the properties o f low-level cells, and w ithout requiring an entire object level representation. This schem e has had its adherents despite the p o pularity o f later m odels w orking on differen t p rinciples, and despite its unreliable perfo rm an ce at peaks and troughs o f lum inance. T his difficulty arises because the g radient detecto r divides the derivative o f intensity over tim e with the derivative o f intensity over space. Zero or near zero values in the spatial com ponent result in very large quotients, leading to unreliable param eter estim ates (Johnston & C lifford, 1994). H eeger (1987) has pointed out that highly textured im ages present great difficulties for m odels w orking on the gradient principle, as the gradient direction m ay vary random ly betw een points. These m odels are held to be prone to producing errors if noise is introduced to the scene, or the im age intensity is n ot preserved betw een fram es o f an apparent m otion sequence (Perrone, 1990).
1.2.3 Modelling Optic Flow Analysis
by optic flow in visual navigation (R ieger & Toet, 1985; W arren & H annon, 1990), detecting object boundaries (H ildreth, 1992), coding the m ovem ent o f independent objects in the field (Zem el & Sejnow ski, 1998), and generating opto-kinetic eye-m ovem ents and sm ooth pursuit (D ursteler and W urtz, 1988; K om atsu and W urtz, 1988; E rickson and D ow , 1989; K aw ano et. al., 1994). M odels o f optic flow processing are m ost often identified with extra-striate area m edial superior tem poral area (M ST) in prim ates, w here large receptive field sizes and sensitivity to com plex, optic flow -like stim uli are found (e.g. Saito et. al., 1986; Tanaka et. al., 1986; Lagae et. al., 1994).
In a recent review, Perrone (2001) suggested a distinction betw een biologically- inspired ‘tem plate m o d els’ o f optic flow pro cessin g and the m ore ab stract m athem atical ‘vector m odels’. The tem plate class o f m odels are so nam ed for their m otion m atching architecture. In order to register a com plex pattern o f m otion a hypothetical detector receives signals from m ultiple local velocity detectors, specifically organised in their spatial distribution to m atch a typical or com m only occurring pattern. D ifferent patterns dem and different organisational structures, but each is a sim ple prototype aw aiting an appropriate trigger. Such a technique has the advantage o f being able to side-step com plex tasks (Glunder, 1990). For instance, com puting speed could be achieved by estim ating distance travelled and tim e taken, follow ed by the appropriate division: distance/tim e. H ow ever, a tem plate m odel responds w hen its spatial and tem poral param eters are m et, w ithout in term ed iate rep resen tatio n s o f distan ce and tim e b eing computed.
generally seek to use ju s t the retinal m otion inform ation to unconfound these signals (R ieger & L aw ton, 1985; K oenderink & van D oom , 1981; H eeger & Jepson, 1992), proving that such signals are sufficiently inform ative. H ow ever, psychophysical evidence (e.g. Royden, C row ell & B anks, 1994) suggests that extra-retinal signals may be used in determ ining heading direction accurately by accounting for self-generated sources o f retinal m otion such as eye rotation, and tem plate m odellers have recently begun to incorporate extra-retinal signals to assist in segregating the various signals (Beintem a, 1998).
th e tem p la te s resp o n sib le for ac h ie v in g it are u sually rad ia l, ro ta tio n , deform ation and translation detectors. These detectors have been linked to the theoretical com ponents identified by K oenderink & van D oom (1975), nam ely,
div: the rate o f expansion, curl: the rate o f rotation. A further category, def: the rate o f deform ation, has received a little physiological support from Orban et. al., (1992), and som e behavioural support from M eese and H arris (2001a, 2001b). N eurones whose response selectivities are im m une to contam ination by m ultiple com ponents (e.g. rotation and radiation com bined) w ould be consistent with decom position to a basis set. How ever, physiological studies have recorded m any departures from this i d e a l ’ representation. R eceptive field selectivities that form a continuum o f responses from radial through spiral to rotation patterns have been found (D uffy & W urtz, 1991), as have r f ’s responsive to sim ultaneously presented com binations o f canonical com ponents (G raziano et. al., 1994). There is also som e behavioural evidence against the decom position hypothesis. D uffy & W urtz (1993) and G rigo & L appe (1998) found that com bining radial expansion w ith translation leads to a m isperception o f the centre o f expansion, im plying lack o f the ability to separate the com ponents effectively. This effect was m odelled by Lappe & Duffy (1999), show ing that a population o f neurones was capable o f em ulating the behavioural evidence w ithout resorting to basis set selectivities. The em erging view is that M ST (and other extra-striate areas) form a com plex set o f representations o f patterns o f optic flow, depending on their utility and their frequency o f occurrence (Lappe et. al., 1996; Irvins et. al., 1999).
1.2.4 Physiology
so are ill suited to respond unam biguously to the m ovem ent o f objects that exceed their field o f view (the aperture problem , described above).
e a rlie r visual areas the rec e p tiv e field size o f M T neurons varies w ith eccentricity, becom ing larger with increasing distance from the fovea (A lbright & D esim one, 1987). M T projects to M ST w here receptive fields are larger in size, and are thought to be especially suited to the detection o f w ide-field m ovem ents (Tanaka, 1998). Such patterns o f flow are those typically caused by the m otion o f the observer through the environm ent, and may take the form o f a rigid translation, expansion / contraction or rotation. Cells selectively responsive to these prototypical patterns are found in dorsal M ST (Sakata et al, 1985; Sakata et. al., 1986; Sakata et al., 1994; Saito et al., 1986; D uffy & W urtz, 1991; O rban et. al, 1992; G raziano et. al., 1994), presum ably allow ing for the coding o f ego m otion, especially when one unusual property o f these cells is considered. ‘Position invariance’ refers to the lack o f sensitivity o f radial and rotary cells to th e lo c u s o f th e ir p r e f e rr e d p a tte rn o f m o tio n . T h e c e n tre o f expansion/contraction or rotation fields does not need to be placed at the centre o f the receptive field in order to elicit strong cell responses. This may give these cells the ability to code the m otion o f the an im al’s body independently o f the gaze direction. Cells in ventral M ST exhibit a different pattern o f responses to those in the dorsal region, one that seem s to be sensitive to the relationship betw een figure and ground. A large proportion o f them register the presence o f sm all stationary stim uli, w ith the sign o f their directional selectivity being contingent on the presence or absence o f a background w ide field m otion (Sugita & Tanaka, 1991; T anaka et al., 1993). T his pattern o f responses gives these neurons the property o f detecting the relativ e m otion betw een o b ject and background (Tanaka, 1998).
1.2.5 Psychophysics
areas contain m otion-sensitive cells with m uch larger receptive fields than those o f V I , w hich p ro jects to them (M aunsell & N ew som e, 1987). I f these m echanism s rep resent a fu rth er stage o f m otion analysis, their speed and directional tuning com petence may be different to that m easured by previous investigators. The follow ing section deals w ith w hat is currently know n about speed and direction capabilities, as m easured by behavioural techniques.
1.2.5.1 Speed and Direction in Local Mechanisms
In the first instance the visual scene is analysed for the presence o f m otion in discrete regions. This ‘lo ca l’ analysis introduces a tension betw een com peting requirem ents if estim ates o f both speed and direction param eters are required from the sam e m echanism . To sense m otion it is necessary for a system to som ehow register the tim e taken to traverse a distance. The ability to obtain an accurate local estim ate o f speed depends on keeping the distance and tim e values in the equation low, avoiding averaging. Y et the accuracy o f a direction estim ate is im proved if these values are increased (G rzyw acz et al., 1994). C alculations of the error involved in local speed discrim ination by hum an observers range from 30% to 100%, indicating that speed is not initially com puted w ith great accuracy, (V aina et al., 1990; Bravo & W atam aniuk, 1991). W hen local signals are com bined, however, precision increases greatly, with discrim ination errors as low as 5% being reported (M cK ee et al., 1986; V aina et al., 1990; B ravo & W atam aniuk, 1991). These estim ates w ere obtained using random dot displays w ith isotropic (circular) elem ents, so it is certain that subjects w ere relying solely on their perception o f m otion direction, rather than using an artifactual orientation cue. The high errors in local m otion speed estim ation m ight lead us to conclude that accurate local speed estim ates have been sacrificed in favour o f directional tuning.
experim ents which have been designed to gauge how great the angular distance betw een signals is required to be in order that the m echanism s responding to them do not interact with each other, (e.g. Levinson & Sekuler, 1979; M ather & M oulden, 1980; Ball & Sekuler, 1979; Ball & Sekuler, 1980; Ball & Sekuler, 1981). These experim ents found that directions o f m otion had to be betw een 120 degrees and 150 degrees apart for independence betw een m echanism s to be evident. T hese figures have then been interpreted directly as bandw idths o f directional tuning. How ever, a principled estim ate o f bandw idth is obtained at the h a lf height o f the m echanism s response curve. C onsider figure 1.2 which shows a Gaussian profile representing the response profile o f a motion detector sensitive to a finite range o f directions. Conventionally the range o f directions to w hich it responds is quoted at h alf its m axim um response, hence ‘half-height bandw idth’. This definition is useful as an attem pt to m easure its w idth at the base would be problem atic due to the theoretically infinite nature o f the decay o f the G aussian function. In addition, low -level noise w ould be less likely to contam inate width estim ates m ade at half height. Estim ates m ade for half-height bandw idth have given rise to m uch sm aller figures o f 70-90 degrees (Raym ond,
R esponse profile of motion detector
0)
T3
c cn
03
E
Q) W C
o
CL W
2
- 6 0 - 5 0 - 4 0 - 3 0 - 2 0 - 1 0 0 10 2 0 3 0
m otio n d ire c tio n (d e g re e s )
4 0 5 0 6 0
Figure 1.2. T h e half-height b an d w id th o f a m otion d e te c to r with a Gaussian tunin g profile. The detec tor responds m a xim a lly when stim ulated by a motion at 0 degrees.
T h e horizontal line is po sitio n ed at h a l f this peak. T h e w idth o f the m e c h a n is m is conventionally taken where the horizontal line intersects the Gaussian profile and can be
estim ated from the x axis by projecting vertically from the intersection points. In this ex am p le the half-height bandw idth is from - 1 8 degre es to 18 degrees, i.e. 36 degrees.
Alternatively the b andw idth can be c o m p u ted m a th em atically by taking the inverse o f the Gaussian form ula at the intersection points.
1.2.5.2 Speed an d D irection in Global M echanism s
M e a s u r i n g the d ir e c t i o n a l tu n i n g b a n d w i d t h s o f c o m p l e x m o t i o n d e t e c t o r s
re q u ire s that stim uli o b lig e j u d g e m e n t s to be m a d e u sin g global d e te c to rs rath er
than local ones. E v id e n c e has b een a c c u m u la tin g fr o m p s y c h o p h y s ic s (R e g a n &
B e v e rle y , 1978; M o r r o n e , B u rr & V a in a , 1995; B u rr, M o r r o n e & V a in a , 1998;
S n o w d e n & M i l n e , 1 9 9 7 ; M e e s e & H a r r is , 2 0 0 0 ) a n d e l e c t r o - p h y s i o l o g y
( T a n a k a & Saito, 1989; D u ffy & W u rtz , 1991 ; G r a z ia n o , A n d e rs e n & S n o w d e n ,
such as rotation and radial patterns, as well as interm ediate spirals (M eese & Anderson, 2002; Snow den & M ilne, 1996). These m echanism s have also been ch a ra c te rise d as broadly tuned in th eir d ire c tio n a l se n sitiv ity in several psychophysical studies. For exam ple, m easuring m otion coherence thresholds M orrone et. al., (1999) found enhanced sensitivity to radial and rotation patterns o ver interm ed iate spirals. W hile not ru ling o u t the p o ssib le ex isten ce o f com paratively less sensitive spiral m echanism s, they chose to interpret their results in term s o f broadly tuned cardinal detectors. W here evidence is presented fo r cardinal or basis set com ponents, broad direction bandw idths are often assum ed, as these m echanism s need to detect com ponents at interm ediate angles o f flow in order for them to be coded in conjunction w ith another detector. M eese & H arris (2001) show ed that sum m ation betw een individually su b threshold stim uli declined w hen their directions exceeded approxim ately 30 degrees, falling to asym ptote at around 90 degrees o f separation. M odelling these data, M eese & H arris (2001) proposed th at m echanism s o f directional tuning b andw idth 80 to 120 degrees p ro v id ed an a cco u n t o f the resu lts, dep en d en t on the num ber o f m echanism s em p loyed. S im ilarly , M eese & Anderson (2002) settled on 92 degrees direction bandw idths in a continuum o f rotation, spiral and radial detectors to m odel sub-threshold sum m ation betw een those patterns o f optic flow . Burr, B adcock & R oss (2001) also exploited a sum m ation technique to provide evidence for cardinal optic flow detectors. O bservers w ere m ore sensitive in d iscrim in atin g the d irection o f spatially interleaved orthogonal optic flow patterns w hen the orthogonal com ponents w ere spirals than when they w ere rotation and radial patterns. T his result was taken to indicate that radial and rotation m otions are relatively independent, w hereas spirals share encoding com ponents, th ere fo re e n jo y in g increased sensitivity due to summation.
o f the effect was contingent on the sim ilarity betw een adapt and test patterns, being greatest when adapt and test w ere identical. These results w ere m odelled by m echanism s sensitive to a range o f pattern detectors that spanned radial, spiral and rotation sensitive units, their G aussian m echanism s having standard deviation o f 40 degrees, equating to 94 degrees bandw idth at half-height.
w ill be ad d ressed fu rth e r in the firs t ex p e rim e n tal ch ap ter, “ D irectio n B andw idths o f Rotation, Radial and Translation M otion M echanism s” .
Speed
Sm ith, Snow den & M ilne (1994) found that a w ide-field translating pattern needed a velocity increase o f circa 10-12% to be distinguished from a reference p a tte rn m o v in g at 4 d e g re e s/s. E x te n d in g e a rlie r w ork on th e speed d iscrim ination o f sim ple lin ear m otions, V erg h ese & Stone (1995) asked observers to discrim inate on the basis o f speed betw een tw o anim ations, each com prising m ultiple G abor patches. They found that speed d iscrim ination thresholds decreased with increasing num ber o f patches (1 patch= circa 19%; 6 patches = circa 11%, interpreted from their figure 3), a finding they attributed to the parsing o f visual space into discrete entities. W hen the area o f a single patch was increased in line with that shared across m ultiple patches thresholds w ere constant, at approxim ately 20% (interpreted from their figure 5a).
Sim ilarly, radial patterns contain m ultiple local speeds produced by relative m otion betw een the eye and the scene, th eir p recise values b ein g partly dependent on the structure o f the environm ent. H ow ever, the speed o f the relative motion is m ore im portant to the organism than individual retinal speeds.
To investigate w hether the angular speed o f rotating patterns is sensed, a series o f papers by W erkhoven & K oenderink (1990, 1991, 1993) exam ined the p e rc e p tio n o f speed in ro ta tin g R D K p a tte rn s. In th eir first study, one experim ental condition exam ined speed discrim ination betw een two tem porally separated rotating circles o f dots, having equal radius. O bservers discrim inated betw een a reference pattern o f constant speed (80 degrees/second) and a speed- varying test pattern, show ing that low est difference thresholds o f 8-10% w ere achievable. (D iscrim ination threshold was taken at the point w here observers judged the test pattern as faster on 84% o f trials).
In their second paper (W erkhoven & K oenderink, 1991) sim ilar stim uli w ere used in four experim ents exam ining the dependency o f speed discrim ination on several factors:
T em poral factors. A ran g e o f fram e duratio n s (1 4 ..114m s) and stim ulus durations (57.. 1829ms) w ere explored. Long stim ulus and short fram e durations gave rise to low est discrim ination thresholds o f over 5%, though short stim ulus and long fram e durations com prom ised thresholds severely, e.g. 60%.
Textural factors. T he num ber o f dots (1..32) and dot density w ere varied to explore how these param eters influenced d iscrim ination perform ance. (D ot density was m anipulated by scattering the dots at different eccentricities around the nom inal radius). D iscrim ination thresholds w ere found to be low est (circa 10%) w hen dots w ere m ore num erous, and w hen they w ere m ore densely organised on the nom inal radius.
(retinal) radii o f the annuli in a u-shaped pattern, i.e. higher thresholds (10.. 18%) for very long and very short view ing distances, but circa 8-10% for interm ediate view ing distances.
Finally, the dependence o f discrim ination threshold on rotation (angular) speed w as ex plored o ver the range 10..320 d egrees/second to ascertain w hether W eber’s law held for rotational m otion in the way it does for linear m otion. For speeds above 80 degrees/second it did, being consistently below 10%, though rates o f ro tatio n below 80 degrees/seco n d resu lted in p ro g ressiv ely m ore elevated thresholds o f 25% and above.
T h eir third p ap er (W erkhoven & K oenderink, 1993) explored how speed discrim ination thresholds were influenced by differences in the radii o f test and reference patterns. In these experim ents the reference and test annuli com prised eig h t dots rotating around a fixed point, again p resented in tw o tem poral intervals. Speed discrim in atio n w as m easured betw een referen ce and test patterns over a range o f reference speeds (40.. 160 degrees/second) and radii (the test pattern radius was a m ultiple o f the reference pattern radius, range: 0.25..2). D iscrim ination thresholds w ere found to vary w ith the degree o f m ism atch betw een the radii o f com parison stim uli. M inim um threshold was obtained when sizes were equal (7% ), increasing to m ore than 20% w hen radii differed by a factor o f two.
As a result o f these experim ents the authors concluded that local m echanism s w ere fu n d am en tally re sp o n sib le for the p a tte rn o f speed d isc rim in a tio n perform ance observed, although their results did not unequivocally support reliance on either local or global m echanism s.
those in the radial pattern. (Bex & M akous, 1997; Bex M etha & M akous, 1998; C lifford, B eardsley & V aina, 1999; C lifford, A rnold & W enderoth, 2000; G eesam an & Qian, 1996; G eesam an & Qian, 1998). This effect is know n to be caused by the spatial relationship am ongst the m otion signals m aking up the radial pattern as the illusory speed is obtained even w hen com parison rotation stimuli are com posed o f an identical set o f m otion vectors, albeit w ith the spatial arrangem ent necessary to produce rotation. One explanation for the exaggerated perception o f speed is that radial patterns are interpreted as relative m otion betw een observer and environm ent, and the speed perceived is that o f m otion-in- depth, rather than o f the velocity o f com ponent retinal signals. This possibility suggests one reason why the m agnitude o f the illusion varies so greatly betw een studies. E stim ating speed in depth is p ro b lem atic w ith o u t an estim ate o f distance. R etinally, the sam e stim ulation could be expected o f a nearby object m oving slowly tow ards the observer, or a distant object m oving quickly.
M am allian vision in co rp o rates a p leth o ra o f cell types, each o f w hich is specialised along several dim ensions (G raham 1985; 1989). A com prehensive list w ould be long, how ever som e im portant exam ples o f such dim ensions include m otion, orientation, colour and contrast.
As described in the foregoing paragraphs evidence has been accum ulating for the existence o f specialised m echanism s that encode com plex patterns o f m otion. M otion constitutes only one dim ension that they m ay respond to, and only by characterising these other dom ains can a full understanding o f their role in visual processing be gained. It was the aim o f the w ork described in the rem ainder o f this thesis to explore the sensitivities o f com plex m otion m echanism s to the follow ing attributes:
m otion. In chapter 3 the w idth o f such a range is m easured, establishing the bandw idth o f detectors sensitive to radial m otion, rotational m otion and sim ple translation.
Spatial frequency. The initial analysis o f the dynam ic visual scene is thought to be carried out by cells that respond to a lim ited range o f spatial frequencies. L ittle work has explored w hether m echanism s that code com plex patterns o f m otion are sim ilarly tuned. T he specificity o f radial m otion m echanism s for spatial frequency is explored in chapter 4.
Speed. Radially expanding patterns have been found to generate a sense o f speed in observers that is g reater than w ould be ex p ected o f the retinal speeds presented. It has been suggested that observers interpret a radially expanding pattern as m otion in depth, and that the speed they sense is that o f m otion in the third dim ension. C hapter 5 investigates this hypothesis to establish w hether m echanism s sensitive to radial flow are tuned to m otion in depth.
Speed. The capacity to estim ate speed accurately is revealed in the ability to discrim inate betw een objects m oving at sim ilar speeds. This ability is explored in chapter 6 to establish the speed discrim ination com petence o f m echanism s sensitive to radial, rotation and translation patterns.
Chapter 2
General Methods
2.1 Technical Issues
T he follow ing sections address basic issues concerning stim uli design, data processing, and the control o f com puter equipm ent.
D ocum enting the relatio n sh ip betw een an environm ental stim ulus and the observer’s perception is the root o f psychophysics enquiry. The result o f this process is frequently a psychom etric function, from which param eters such as response thresholds and sensitivity are estim ated. M any techniques for gathering raw data and processing it to the po in t o f param eter estim ation have been developed over the years. The first section will describe the processing m ethods used in this thesis to identify im portant trends in the data. A lso detailed are the type o f stimuli used here, and the reasons for their choice.
The autom atic presentation o f stimuli and recording o f participant’s responses is com m only carried out in m odern psychophysics on program m able personal com puters. R ecent advances in com puter pow er, their ready availability and relatively low cost m akes them an ideal choice. T o use such eq u ipm ent effectively to carry out experim ents requires both know ledge o f the capabilities and lim itations o f their m ajor com ponents, as w ell as the ability to control it through the developm ent o f custom ised softw are. This is the approach that has been used here, and the second section w ill outline som e key hardw are and software topics.
The final section details experim ental m ethods that are com m on to m any o f the chapters.
2.1.1 Sampling the Observer’s Psychometric Function
present to the subject (e.g. the m ethod o f adjustm ent, the m ethod o f lim its, the m ethod o f constant stim uli, and adaptive m ethods. See Treutw ein (1995) for a review ). In this thesis two techniques have been used: the m ethod o f constant stim uli, and an adaptive m ethod o f stim ulus selection known as ‘Q uest’ (W atson & Pelli, 1983; see also Ew en K ing-Sm ith et al., 1994). The m ethod o f constant stim uli presents a fixed set o f stim ulus values to the observer that is usually designed to sam ple the com plete range o f their perform ance, from guessing through to the m axim um po ssib le. T his schem e n ecessarily in v olves the experim enter in a large degree o f pilot work to ensure that the stim ulus set does indeed em brace the desired perform ance range. This problem is com pounded by individual differences th at m ay dictate th at som e observers w ith d ifferent sensitivities require a different stim ulus set to others, generating m ore work for the experim enter, and possibly m ore w asted trials for observers. Finally, this technique has been criticised on the grounds o f the relative inefficiency o f its sam pling schem e (Treutwein, 1995). Sam pling evenly throughout the observers’ psychom etric function is held to be w asteful as som e parts o f the function are m ore inform ative o f its shape than others. A m ore e fficien t m ethod w ould sam ple m ore densely at those points, and less so at co m p arativ ely less inform ative regions. The Q uest algorithm (W atson & Pelli, 1983) offers ju st such a sam pling schem e, typically concentrating sam pling o f the stim ulus space in areas leading to high perform ance (e.g. 82% ). This is achieved through a B ayesian p ro b ab ility density function (pdf) th at relates the likelihood o f a p ositive or negative response to stim ulus values. T he experim enter is only required to supply the algorithm with an estim ate o f the subject’s threshold, the algorithm then m aking ‘o n -lin e’ stim ulus value choices based initially on its inbuilt pdf, and subsequently on that distribution m odified by the incorporation o f the observer’s responses during the experim ent.
2.1.2 Stimuli
capable o f m oving with speed and directional properties that can be assigned independently o f its com panion’s speeds and directions. A typical R D K contains dots with lifetim es lim ited to a short num ber o f anim ation fram es. D ots are ‘reb o rn ’ at a new location when they expire, or when they travel outside the bounds o f the (frequently circular) region o f the display they are required to appear in. These properties o f the R D K m ean that com plex patterns o f m otion can be created w ithout the introduction o f ‘real w o rld ’ geom etric shapes like squares, rectangles and circles. Such shapes have properties that are not relevant to the study o f low -level m otion m echanism s, and m ay introduce undesirable cues that observers could use in place o f the variables under experim ental investigation. For exam ple, chapter 4 exam ines how the perception o f m otion-in- depth varies w ith the spatial frequency o f R D K dots m aking up a radially expanding optic flow. W hen an RD K is m ade up o f lim ited lifetim e dots that can be repositioned in random locations, a continuous flow field can be produced w ithout accom panying ‘object pro p erties’ intruding, or placing constraints on o v erall stim ulus du ratio n . I f m otion in d epth w ere sim u late d usin g an approaching square for an extended period the figure w ould eventually fill the entire display area. A dditionally its spatial frequency content w ould inevitably contain m ore pow er at low frequencies. U sing an R D K with lim ited lifetim e elem ents circum vents these problem s.