Thermo-Vision Scanning Of Vital Nodes in a
Substation Using Image Processing
HariharaVarma I1, Namitha R M1, Sunil G N1, Dr. H. V. Kumaraswamy2
UG Student, Dept. of Telecommunication, R.V College of Engineering, Bangalore, India1 Professor and HOD, Dept. of Telecommunication, R.V College of Engineering, Bangalore, India2
ABSTRACT: In electrical substations transformers are the most vital units, which have to be taken care against electrical surges, overloading, overheating etc. to avoid catastrophic disasters. Rise in temperature of the transformer is one of the crucial parameters that is to be measured. This paper discusses the design and development of a microcontroller based Thermo-vision scanning for real time monitoring of vital elements in the substation and transmission of real time data using wireless media. The system consists of transmitter, wireless media and receiver. This system consists of web camera which is connected to a PC along with wireless communication facility. The real time video of target nodes is received through web camera. The received video is processed using MATLAB and based on the intensity variations temperature values are assigned at particular instant of time. These temperature values are transmitted to the receiver using Xbee RF modules. The received temperature values are stored in MYSQL database. At normal loading at the transformer, whenever the power flow increases, the temperature at the target also increases. The continuous increase in power flow may lead to hotspot condition resulting in damage to the equipment. A GUI is created which alerts the maintenance person of the overloading condition.
KEYWORDS: Transformers, Wireless communication, Thermo-vision, Temperature values, Hotspot condition
I. INTRODUCTION
Transformers are required throughout the modern interconnected power systems. The size of these transformers range from as low as a few kilo volt amperes to over a few hundred mega volt amperes, with replacement costs ranging from a few hundred dollars to million dollars. Power transformers are usually very reliable, with 20-35 year design life. In practice, the life of a transformer can be as long as 60 years with appropriate maintenance. However, the in-service failure of a transformer is potentially dangerous to utility personnel through explosions and fire, potentially damaging to the environment through oil leakage, is costly to repair or replace, and may result in significantloss of revenue. Ina large public power utility, the number of transformers in the subtransmission and transmission network (excluding the lower-voltage distribution network) can be from few hundred to over one thousand (69 kV to 500kV).
As transformers age, their internal condition degrades which increases the risk of failure. Failures are usually triggered by severe conditions, such as lightning strikes, switching transients, short-circuits, or other incidents. When the transformer is new, it has sufficient electrical and mechanical strength to withstand unusual system conditions. As transformers age, their insulation strength can degrade to the point that they cannot withstand system events such as short-circuit faults or transient over-voltages.
To prevent these failures and to maintain transformers in good operating condition is a very important issue for utilities. Traditionally, routine preventive maintenance programs combined with regular testing were used. With deregulation, it has become increasingly necessary to reduce maintenance coasts and equipment inventories. This has led to reduction in routine maintenance. The need to reduce costs has also resulted in reductions in spare transformer capacity and increases in average loading. There is also a trend in the industry to move from traditional time-based maintenance programs to conditional-based maintenance. These changes occur at a time when the average age of the transformer in service is increasing and approaching the end of nominal design life.
equipment requires it. Hence, there is an increasing need for better nonintrusive diagnostic and monitoring tools to assess the internal condition of the transformers. If there is a problem, the transformer can then be repaired or replaced before it fails.
Many testing and monitoring techniques have been used by utilities.
In this paper we have built a prototype of an automated system which monitors the transformer nodes in real time rather than doing condition based maintenance. We used MATLAB programming to process the real time video obtained from a web camera. The intensity variations are noted and corresponding temperature values are transmitted via RF modules. We used Xbee modules based on the IEEE 802.15.4/Zigbee Wireless Personal Area Network (WPAN) standards to build a low-power, low maintenance WSN (Wireless Sensor Network). Small size, low power, low cost and long battery life are the reasons of using ZigBee. We used Arduino board which comes with ATmega168 or 328 for easy interfacing with the ZigBee module and for easy programming(in C) of the microcontroller. The Arduino boards come with a library for interfacing with Xbee.
The remaining of the paper is organized as follows.
Section II describes the methodology used in this project.Sections III describe the results. We conclude the paper and discuss some future extensions of our current prototype in Section IV.
II. METHODOLOGY
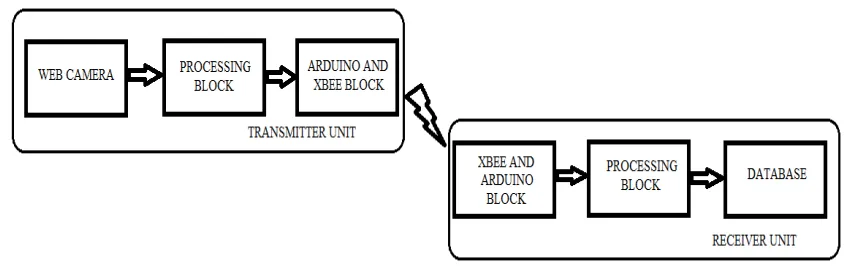
Figure 1 gives the complete block diagram of the system which majorly consists of transmitter block and receiver block linked by RF link through XBEE module.
Figure 1: Block Diagram of System
Transmitter Unit
Transmitter block consists of web camera, computer (processing unit), Arduino, Xbee module.
Web Camera
This is the block where the real time video of the transformer hotspot is captured. We are using a webcam for this purpose. The main sensor used is the light sensor which is the web camera. This must be replaced by thermal state capturing device such as thermo vision camera, but as of now, for the purpose of demonstration web camera is used.The video acquired by the web camera has specifications such as 30fps, RGB video, VGA, Logitech make etc. The captured video is processed by the computer using MATLAB Image Acquisition Tool Box.
Processing block
Video is taken into Matlab environment where in with the help of image acquisition toolbox in Matlab the captured image is processed to extract useful information from the image acquired.
The complete process is done with minimum possible delay (i.e. real time). The process involves capturing of image, getting image into Matlab, process image using defined toolbox functions, obtain state of object i.e., which camera is been used for video capture, serialize the data obtained and put it onto serial port from which data is carried to microcontroller to wireless module(xbee)
Processing of image mainly include
1. Configuring the timer of the image acquisition to capture definite number of frames for particular intervals of time (during image capture).
2. Start of timer interval wake the trigger on which image acquisition starts for duration and frames specified by the timer.
3. The region of interest is set for the captured image in which, required data is obtained. 4. The data obtained is by statistical measure of colored pixels in the region of interest.
5. Statistical measure involves the histogram of image, from which the average number of colorpixels(say red) are obtained and mapping the average obtained to the real situation obtains the intensity of flare or fire in ROI. This mapped data(temperature values) will be in the form of number (these are actual data) which are serial sent to next block that is microcontroller block.
6. Normally more the red pixels higher will be intensity of flare.
Arduino and Xbee block
Figure 2 shows the pin diagram of Arduino Uno board (ATMEGA 328) which is used to transmit data. The processed image data (temperature values) are put on to the serial monitor of the microcontroller (Arduino). An Xbee pro module is integrated with the Arduino uno board. The transmitter module is configured as end device using X-CTU software.
Figure 2:Pin diagram of Arduino Uno board (ATMEGA 328)
Arduino uno specifications are as follows Microcontroller ATmega328
Operating Voltage 5V
Clock Speed 16 MHz
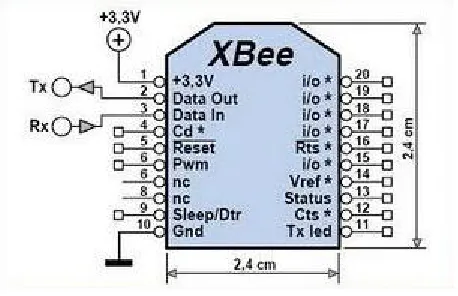
Figure 3 shows pin diagram of XBEE and its dimensions.
Figure 3: Pin diagram of XBEE module
Xbee specifications are as follows Supply voltage: 2.1-3.6V DC Operating frequency: 2.4 GHz RF data rate: 250 kbps
Indoor/urban range: 133ft (40 m)
Serial 1(TX) and 0(RX) pins are used to receive (RX) and transmit (TX) TTL serial data. These pins are connected to the corresponding pins of the ATmega8U2 USB-to-TTL Serial chip.
Receiver unit
Receiver block consists of Arduino, XBEE module, computer and database.
The transmitted temperature values are received by the receiver Xbee module which is configured as a coordinator. Coordinator is capable of controlling the network which consists of many end devices. The data received is in the following format
1 16-05-2013 10:00:34 40 1 Now a real time GUI(Graphical User Interface) is created.
GRAPHICAL USER INTERFACE (GUI)
The GUI is created using Microsoft Visual Studio 2010.The data obtained from the serial port is read and is displayed in a text box and plotted onto chart simultaneously and a backup is created for all the data obtained in a text file. Color mapping is used to display the temperature value for better pictographic representation and to make it more aesthetically pleasing. The various temperature ranges and their corresponding color mapping are shown in figure 4. An alert message is displayed whenever it crosses a certain threshold value. The alert message is displayed via a dialog or a message box. This alerts the maintenance personnel about the overloading condition and prevents any major damage to the equipment.
Figure 4: Temperature ranges and its appropriate color mapping
Database
The received values are stored in a MYSQL database.
III. RESULTS
A field test was performed on a real time video and the following results were achieved
1. Process the image at current time.
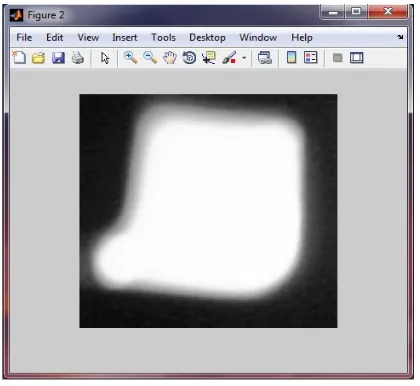
2. Obtain the intensity values (temperature) at the ROI as shown in figure 5.
3. Transmit the temperature data successfully using Arduino uno and Xbee modules.
4. Capture the received data on to a text file with current time stamp.
5. Obtain a GUI for the received values and alert the maintenance personnel with a warning message at hotspot
condition as shown in figure5 and figure 7.
6. Store the received data in the database.
Figure 5: Region of Interest (ROI) Ambient
temperature= 1 to 45 degree
Celsius
Normal temperature
=45 to 65 degree Celsius Rising
temperature= 65 to 85 degree
Celsius Alert= 85 to
95 degree Celsius
Figure 6:Alert message being displayed in GUI
Figure 7:Critical message being displayed in GUI
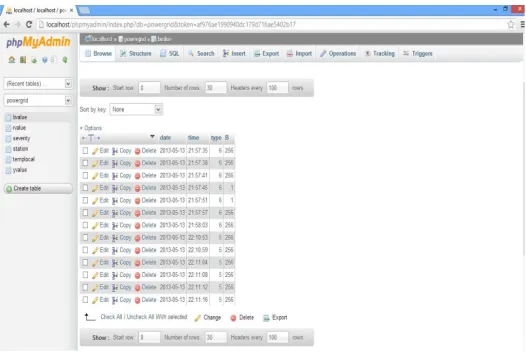
MYSQL database:
The received values are stored in MYSQL database as shown in figure 8.
Figure 9 shows the login webpage to access the database. It contains two fields, namely: Username and password. A set of usernames and passwords are stored in database in a separate table for authentication of the user.
Figure 9: Login page to access the Database
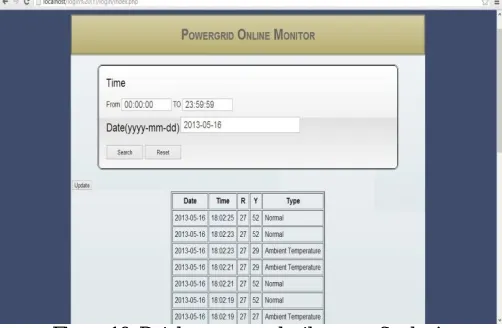
Figure 10 shows the database as seen by the user after logging into the database with authentic username and password. The user can query the database using the search button by specifying the time and date as per the requirement. Reset button is used to refresh the database to the initial conditions. Update is used to manually update the table to any new values added in the database.
Figure 10: Database as seen by the user after login
IV. CONCLUSION AND FUTURE SCOPE
In this paper, we built a prototype of an microcontroller based Thermo-vision scanning for monitoring vital elements in the substation and transmission of real time data using wireless technologybased on easy-to-use Arduino Microcontroller board and Xbee module.We considered atemperature monitoring application such as a real time video of surroundings to demonstrate theproof-of-concept of our system. The collected temperaturedata can be stored into the MySQL Database andretrieved later for analysis.
REFERENCES
[1] Veerasingam, Karodi,Shukla, Yeleti, M.C. “ Design of Wireless Sensor Network Node on ZigBee for Temperature Monitoring,” Advances in Computing, Control, & Telecommunication Technologies, ACT '09. International Conference on, vol., no., pp.20-23, 28-29 Dec. 2009.
[2] K.Sujatha, N.Pappa” Intelligent Sensor for Combustion Quality and Temperature Measurement in Power Station Boilers”, ACS-International Journal on Computational Intelligence, Vol-1, Issue-2 Dec 2010.
[3] Singh, Mishra, “Temperature monitoring in wireless sensor network using Zigbee transceiver module,” Power, Control and Embedded Systems (ICPCES), 2010 International Conference on, vol., no., pp.1-4, Nov. 29 2010-Dec. 1 2010.
[4] Joe Mayo, “A Beginners’ Guide toMicrosoft Visual Studio 2010”, McGraw-Hill Publications, 2010. ISBN: 978-0-07-166896-5.
[5]Mei-Sung Kang; Yu-Lung Ke; He-Yau Kang; , "ZigBee wireless network for transformer load monitoring and temperature sensitivity analysis," Industry Applications Society Annual Meeting (IAS), 2011 IEEE , vol., no., pp.1-12, 9-13 Oct. 2011.
[6]Arduino, http://arduino.cc/.
[7] Prof.S.S.Sarade, Prof.A.C.Joshi, Prof. Sachin S. Patil, Prof.A.N.Shinde,” WirelessTemperature Monitoring System using Wireless Sensor Networks”, International Journal of Advanced Research in Electronics and Communication Engineering (IJARECE) Volume 1, Issue 4, October 2012