A Novel Edge Detection Technique using Gray-Level Spatial Correlation based on
Statistical Parameters
M Seetharama Prasad
Singhania University, (Raj.) India [email protected]
Abstract: In this paper we propose a novel edge detection technique. Edges and noise pixels exhibits similar characteristics, unfortunately most of the existing techniques fails in generating the satisfactory results because they are not satisfying the criterion parameters of qualitative evaluation. There by, we introduce Gray Level Spatial Correlation technique based on a statistical parameter computed as the absolute difference between Global mean of entire image and local mean of a 3X3 map. The resultant similarity values other than 9 evident object edges; hence this technique eliminates most of the noise pixels and highlights the object edges. This approach can be further extended to describe the misclassification region or Region of Interest (ROI) for many supervised segmentation and threshold estimation methods. The results obtained are very promising in comparison with standard existing techniques. This method converges at low time complexities.
Keywords: Edge detection, GLSC, ROI, misclassification.
I. INTRODUCTION
Edge detection is wildly used in computer vision and image processing applications. An edge pixel exhibits a clear separation from their neighborhood due to dissimilarity of their gray level intensity values, such connected pixels forms an edge. Generally edges are associated with misclassification region of an image, extracting the edges without missing the details is always an open problem for researchers. Edges are the boundaries of objects; hence object extraction or identification depends on the edge detection. Many segmentation techniques uses ROI for estimating the threshold value, but fixing of ROI should be done with histogram supervision and this is not suitable for all categories of applications. However the proposed method can fix the ROI with some computational processing, so that the existing supervised segmentation techniques would turn into unsupervised.
Many edge detection algorithms for image enhancement are found in the literature. Sobel, Robert and Prewitt[1-8] operators are based on gradient methods using a filter of size 3X3. Canny proposed an optimal filter to find the edges and is prominently used by many researchers as the bench mark. Xin wang [9] introduced two detectors namely Optimal Edge matching Detectors(OED) and Multi stage Median filter based Detecter(MED) based on laplacian operator. Luhang Diao et al. proposed an edge detection scheme on Fresnel[10]. Marr and Hildreth[11] introduced the theory of edge detection using laplacian of Gaussian of an image. A. Ghostasby and Shou proposed a curve fitting approach for edge detection[12]. Many of the above mentioned methods
are based up on gradient. Here we introduce spatial correlation coefficient to decide the edges of the objects in an image. Gray Level Spatial Correlation (GLSC)[22] matrix represents all the edges by relying on statistical parameters such as the global mean(M) on entire image and local mean(m) of the 3X3 map, Absolute difference between M and m decides the correlation coefficient( ). The next sections of this paper discusses about proposed method in section II, GLSC calculation in section III, section IV presents the results and performance of the proposed method in comparison with existing methods and the section V ends up with conclusions and future scope.
II. PROPOSED METHOD
The results of the above discussed techniques are prominent, however GLSC proposed by Yang Xiao et al.[22] open new avenues to obtain edge pixels from the image. Yang Xiao et al. Considered local properties of the image and stated correlation coefficient ( ) as constant at 4 producing reasonable results for image segmentation along with entropic criterion function. We propose a novel technique for edge detection with GLSC matrix computation, by taking global and local statistical parameters into account. The spatial correlation coefficient is considered as the absolute difference between global and local means as in equation (1).
= | M - m | (1)
2010, IJARCS All Rights Reserved
60
Figure 1 : Different Maps; (a,b,c,d,e,f,g,h,i and j) Center Edge pixel; (k,l)Not Center edge pixel
From the above we conclude non edge and edge pixels with a cumulative correlation value 9 and less than 9 respectively. in order to obtain correlation values correlation coefficient is calculated with equation 1.The proposed GLSC calculation uses correlation coefficient form equation(1) as follows.
Let f(x,y) be the gray level intensity of image at (x,y). F={ f(x,y)|xє[1:Q], y є[1:R]} of size Q x R. The gray level
set {0,1,2,…..255} is considered as G throughout this paper for convenience. The image GLSC matrix is computed by taking image global and local properties into account as follows. Let g(x,y) be the similarity count corresponding to pixel of image I(x,y) in N X N neighborhood, where N is any positive odd number in range [3 : min(Q/2,R/2)]. g(x+1,y+1)=
(2) where
(3)
III. GLSC Matrix With Varying
We construct GLSC matrix with varying similarity coefficient ( ) by taking local and global properties of image to rationalize the process, whereas Yang Xiao et al. suggested a constant value 4. We follow a procedure to calculate for every NXN map, with the help of arithmetic
(a) Camera man
(b) Gray level histogram
(c) GLSC matrix
(d) Resultant Edges noise is suppressed by only taking cumulative correlation value as 9
Figure 2: Cameraman image, its gray level histogram, GLSC matrix mean to measure image global and local properties Mand m
After a thorough investigation for varying we end up with arithmetic mean is the best suitable method to discriminate object and background on the image as a whole and local NXN map, when compared with the variance and standard deviation. The GLSC matrix using the new with equations (1) and (2) is computed. Fig 2.c shows the all edges along with miss classification region pixels. The correlation value 9 in a map, denotes non edge pixels therefore edges are obtained by equation (4)
respectively as in
IV. RESULTS AND DISCUSSION
gray relational correlation and Edge value corresponding to pixel (i,j) respectively. Figure 2.d shows all edges from the input image. Therefore to select ROI we can use GLSC matrix g and image F in some applications like image segmentation and threshold selection.
The judgment of good performance on the obtained results is a matter of concern because there is no appropriate method to judge the quality with 100% confidence [18]. So we evaluate the performance of proposed method with Two different methods, one proposed by Cumani[19] and second proposed by Ruzon et al. [20][21], namely Quantitative and Qualitative Methods have been considered.
A. Quantitative Method of Evaluation
Pratt's[7][21] Figure of Merit (FOM), which is used for comparing two edge detection techniques with equation (5)
(5)
Where N(p), N(g) represents number of edge pixels detected from the proposed method and the ground truth respectively, d(i) is Euclidean distance between the detected
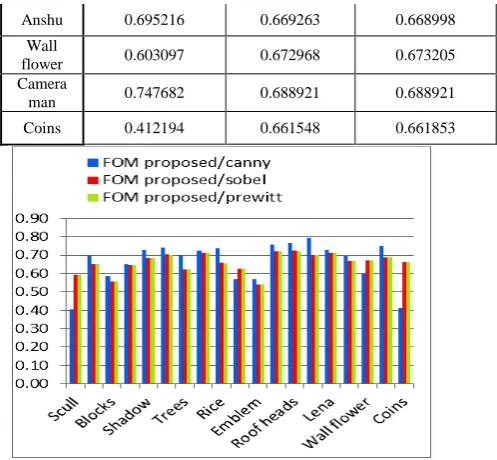
algorithms are exist in literature, among them canny, sobel and prewitt are well accepted methods. So that we assume these edge maps as ground truth edge maps and calculated FOM with the proposed technique. The results are proven that, our method exhibiting 80% FOM in bast case with canny edge map, 41% in worst case with canny and an average FOM as 66% for all methods as shown in Table 1.
Table: FOM comparison of proposed edge map with canny, sobel and prewitt edge maps as ground truths
FOM
proposed/canny
FOM proposed/sobel
FOM proposed/prewitt
Scull 0.406889 0.595428 0.593795
Bird 0.700899 0.652509 0.65222
Blocks 0.584758 0.557923 0.557195
Potatoes 0.649973 0.648234 0.647861
Shadow 0.727596 0.684865 0.684111
Forest 0.742725 0.702747 0.701736
Trees 0.700272 0.6241 0.624043
Blood
cells 0.723761 0.712499 0.712221
Rice 0.736226 0.657775 0.656759
Animal 0.567596 0.625012 0.62479
Emblem 0.56883 0.53972 0.539333
Roof 0.758073 0.720853 0.72019
Roof
heads 0.767011 0.725841 0.72304
Sheet 0.795669 0.701255 0.69987
Lena 0.730285 0.712032 0.71168
Coins 0.412194 0.661548 0.661853
Figure 3: FOM comparison of proposed edge map with canny, sobel and prewitt edge maps as ground truths
B. Qualitative Method of Evaluation
On other hand a qualitative method of evaluation is performed by visual examination [18]. The criterion of selecting a set of parameters for a given image is that the resultant edges should satisfy the following:
a. it should contain most of the prominent edges, b. it should not contain too many spurious edges and c. it should be visibly pleasing.
2010, IJARCS All Rights Reserved
62
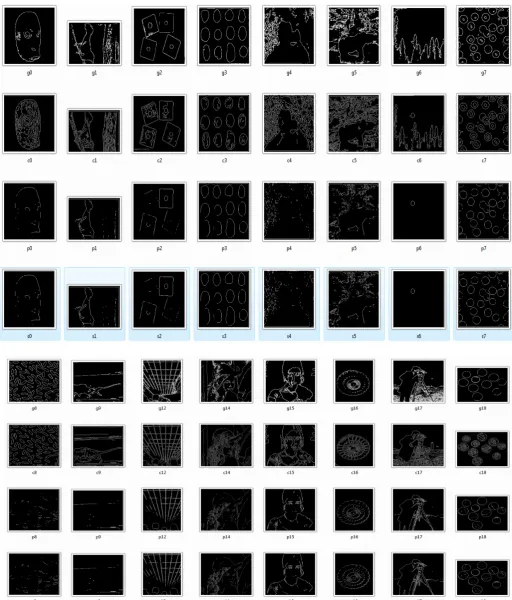
Figure 4: Results of four techniques from top to bottom proposed method, Canny, Prewitt, and Sobel edge maps.V. CONCLUSION
Image edge detection is difficult task in image processing. Probably, we will never find a super algorithm that can be successfully applied to all kinds of images. Therefore, it is appropriate to look for new techniques. Gradient analysis procedures provide us robust tools for developing edge detection techniques. They, however suffer
[1] Canny, J., “A Computational Approach to Edge Detection”, IEEE Trans. Pattern Analysis and Machine
Intelligence, (8)( 6)(1986)679-714,
[2] S. C. Chang, “content based image retrieval using moment preserving edge detection”, Image and Vision computing. 21(9)(2003)809-826
[3] M. Heath, et al. “Comparision of edge detectors: a methodology and initial study”, Computer Vision and Image understanding. 69(1)(1998)38-54
[4] Z. J. Hou,G.W.Wei, “a new approach to edge detection”, Pattern Recognition 35(7)(2002)1559-1570 [5] M. D. Lema, O.R.Mitchell,”Absolute moment block
truncation coding and its application to color images”, IEEE Transactions on communications. 32(10)(1984)1148-1157
[6] X. li, M.T.Orchard ,”Absolute moment block truncation coding and its application to color images ”, IEEE Transactions on Image Processing 10(6)(2001) 813-817 [7] Pratt, W.K., Digital Image Processing, 4 th ed.,
Hoboken, New Jersey, John Wiley & Sons, Inc, (2007) [8] R. C. Gonzalez, R. E. Woods, Digital Image
Processing, 2nd ed., Upper Saddle River, New Jersey, Prentice-Hall, Inc., (2002)
[9] Xin Wang, “Laplacian Operator-based edge detectors, IEEE Transactions on Pattern Analysis and Machine Intelligence”, 29(5) (2007) 886-890
[10] Luhong Diao , Bin Yu and Hua LI, “ A new edge detector based on Fresnel diffraction ”, Pattern Recognition letters, 28(9) (2007) 859-864
[11] Maar, D., Hildreth E., “Theory of edge detection”, Proceedings Royal Soc. London, vol. 207, 187-217,1980
Recognition, vol. 29, pp. 1335–1346, 1996.
[14]E. Argyle. “Techniques for edge detection,” Proc. IEEE, vol. 59, pp. 285-286,1971.
[15]H.Chidiac, D.Ziou, “Classification of Image Edges”,Vision Interface’99, Troise-Rivieres, Canada, 1999.pp. 17-24.
[16]T. Peli and D. Malah. “A Study of Edge Detection Algorithms”. Computer Graphics and Image Processing, vol. 20, pp. 1-21, 1982.
[17]Sobel, I.E., “Camera Models and Machine Perception,” Ph.D. dissertation, Stanford University, Palo Alto, Calif, 1970.
[18]Sarif Kumar Naik and C. A. Murthy. “Standardization of Edge Magnitude in Color Images”, IEEE Trans. On Image processing ,(15)(9)(2006)2588-2595
[19]M. A. Ruzon and C. Tomasi, .Edge, junction, and corner detection using color distributions,. IEEE Trans. Pattern Anal. Machine Intell., vol. 23, no. 11, pp. 1281.1295, Nov. 2001.
[20]A. Cumani, .Edge detection in multispectral images,. CVGIP: GraphicalModels and Image Processing, vol. 53, no. 1, pp. 40-51, Jan. 1991.
[21] Abou I.E. and Pratt W.K. “Quantitative design and evaluation of enhancement/thresholding edge detectors", Proc. of the IEEE, (1979),vol. 67, pp. 756-763.