Evaluation of a Containment Failure Frequency Considering Mitigation
Accident Managements for a Japanese PWR Plant *
Osamu KAWABATA, Mitsuhiro KAJIMOTO, and Nobuo TANAKA
NUPEC/Institute of Nuclear Safety
Fujita Kanko Toranomon Bldg. 7F
17-1, 3-Chome, Toranomon, Minato-ku, Tokyo, 105-0001, JAPAN
Phone: +81-3-3435-3420, Fax: +81-3-3435-3430
E-mail: [email protected]
Keyword: PSA, PWR Plant, Severe Accident, Containment Failure
ABSTRACT
Institute of Nuclear Safety of NUPEC is carrying out a program of developing methodology of Probabilistic Safety
Assessment (PSA) and severe accident analysis. For a Japanese 4-loop PWR plant with a pre-stressed concrete
containment, containment failure frequency evaluation methods by point-estimate and uncertainty estimate were
established for internal initiating events during full power operation assuming mitigation accident management.
In the point-estimate evaluation, core damage sequences were categorized for every plant damage state (PDS) using the
results of Level 1 PSA that evaluated core damage frequencies. Sequences both without and with mitigation AM
countermeasures were analyzed with the MELCOR code: (1) the natural convection cooling by containment cooling units
for normal operation, (2) fire water injection into the containment, (3) the forced depressurization of primary system by
pressurizer PORVs, (4) the restoration of containment spray system, and (5) water injection into the primary system by
charging pumps. A containment event tree including the AM measures was made, and the simplified reliability evaluation
on equipment failure and human factor at AM operation was executed. Severe accident sequence representing each PDS
was analyzed with MELCOR code in order to quantify the branch probability of a containment event tree. The
quantification of containment event tree was done for each plant damage state. Consequently, in the case of AMs included,
the total containment failure frequency was obtained to be 1.1×10⁻⁷ / reactor year comparing 2.2×10⁻⁷ / reactor year with without AMs. A dominant sequence of containment failure when the AM plan is implemented is an interface system
LOCA sequence that a pipe of the residual heat removal system breaks loaded primary system pressure.
I. INTRODUCTION
The severe accident analysis method at NUPEC/INS has been furbished in according with the PSA methodology in
order to provide the deterministic safety review with the supplemental information. With a primary objective of estimating
*
The present study was performed under the sponsorship of the Agency of Natural Resources and Energy (ANRE) of the Ministry of Economy Trade and Industry (METI).
SMiRT 16, Washington DC, August 2001 Paper # 1751
containment performance, the level 2 PSA 1 by point-estimate and uncertainty estimate was executed for a typical Japanese 1,100 MWe PWR plant ; the procedures were consisted of plant familiarization, accident sequence grouping and definition
of PDSs, construction of CETs, accident progression analysis with the MELCOR code 2, and quantification of CETs for obtaining the level 2 PSA results, reflecting the core damage frequency results obtained from the level 1 PSA activities for
the same plant that had been done previously.
II. CONTAINMENT FAILURE FREQUENCY EVALUATION BY POINT ESTIMATE
METHOD
The AM mitigation 3 measures were considered (1) the natural convection cooling by containment cooling units for normal operation, (2) fire water injection into the containment, (3) the forced depressurization of primary system by
pressurizer PORVs, (4) the restoration of containment spray system, and (5) water injection into the primary system by
charging pumps. In addition to those countermeasures 3, cooling down and re-circulation as the SGTR measurement was considered in the present study. These AMs are shown in Figure 1.
A. Natural Convection cooling by Containment Cooling Units
The heat removal from containment atmosphere can be achieved through natural convection by supplying water to the
chillier of containment cooling system in the case of the failure of emergency containment cooling system, etc. The
analysis of the failure of emergency containment cooling system in the event of large LOCA, that causes most severe
effects, shows that the increase in containment pressure is suppressed by starting the cooling water supply to the chiller, and
the pressure is gradually reduced.
B. Fire Water Injection into the Containment
This measure injects the water from raw water tank, etc. into the reactor cavity in case the water injection to the core is
not sufficient and the core melt and subsequent vessel bottom melt-through should occur. Submergence of the melted core
in the reactor cavity region with water mitigates the erosion of concrete while preventing the overheating of containment
penetration by keeping the containment atmosphere at saturated condition.
C. Forced Depressurization of Primary System
In case of the simultaneous failure of high pressure injection system and heat removal function via secondary loop, the
integrity of core is threatened while a high reactor vessel pressure. The dispersion of melted debris can be suppressed by
reducing the reactor pressure through the opening of pressurizer relief valves, in case the melt-through of reactor vessel
should occur. This measure prevents the direct heating of containment atmosphere and the direct contact of the melted
debris to the containment vessel. Additionally, the measure provides the chance to utilize low pressure injection system,
which increases the possibility of suppressing and/or delaying the core degradation and the reactor vessel melt-through.
D. Cooling down and Re-circulation
containment vessel when operator failed the leakage isolation at SGTR, etc. First, the reactor core cooling is established via
secondary loops through releasing main steam while keeping water injection to the reactor. Secondly, the reactor pressure is
reduced by opening pressurizer relief valves, etc. to suppress the leakage. Finally, long-term leakage reduction and heat
removal are secured by putting residual heat removal system into service.
III. CONTAINMENT FAILURE FREQUENCY EVALUATION BY POINT ESTIMATE
METHOD
A. Outline of the Reference PWR Plant
The reference plant is a 4-loop PWR plant with 1,100 Mwe which is the typical PWR plant in Japan. The design
characteristics are as follows:
1) two-train safety injection system and three auxiliary feed water pumps,
2) pumps of the containment spray system and the safety injection system take suction from the in-containment,
re-circulation sump, and the water resource is necessary to switch from the refueling water storage pit,
3) pre-stressed concrete containment with design pressure of 439kPa and volume of 73,700 m3.
B. Plant Damage States (PDSs)
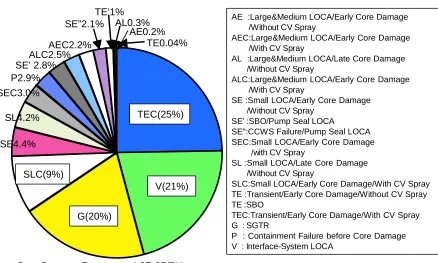
The accident sequences obtained from the level 1 PSA were grouped into thirteen (16) PDSs by considering the
similarities of accident progression, and containment response. Figure 2 shows the ratio of each PDS and the total core
damage frequency with the limited preventive AMs. A fraction of about 48% of total core damage frequency is caused by
the re-circulation failure after a LOCA.
C. Containment Event Trees (CETs) and Quantification
The CETs with the AMs were developed to trace the interdependent physico-chemical processes influencing severe
accident progression in the reactor system and the containment as shown in Figure 3 as an example of late accident phase.
A large CET approach was selected to present accident progression with thirty three (33) top events. The end points of
CETs that were relevant to the integrity and retention capability of the containment were attributed to containment failure
modes. A dominant accident sequences of each PDS were analyzed for obtaining quantify the containment event tree. The
quantification of branching probabilities in the CETs was performed using analytical results of the MELCOR code,
engineering judgment, and unavailability evaluation regarding to AMs.
D. Point-Estimate of Containment Failure Frequency
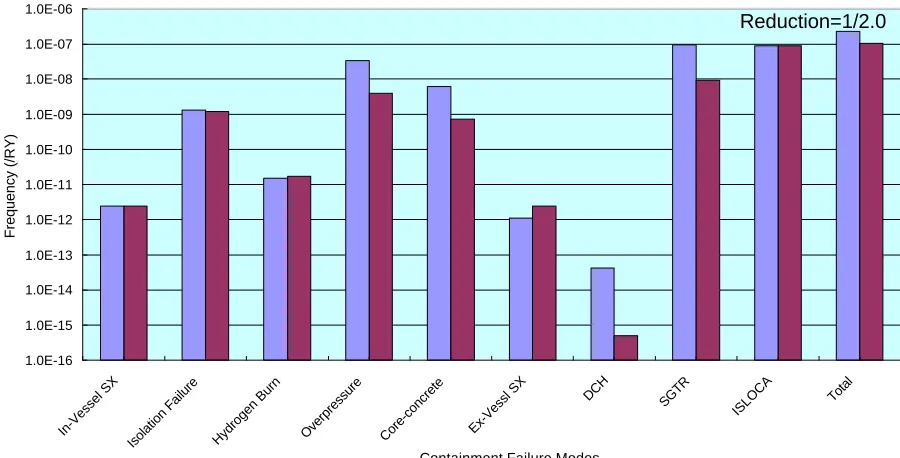
Point-estimate values of the containment failure frequency for each containment failure mode considered with and
1) In the case of AMs included, the total containment failure frequency was estimated to be 1.1×10⁻⁷ / reactor year comparing with that the case without AMs was estimated to be 2.2×10⁻⁷ / reactor year.
2) The containment failure frequencies with overpressure and concrete penetration during core/concrete interaction were
reduced by mitigative AMs. However, the containment failure frequency with ex-vessel steam explosion increased by AMs
such as the fire water injection into the containment.
3) A dominant sequence of containment failure when the AM plan is implemented is an interface system LOCA sequence
that amounts to about 81% of total containment failure frequency.
4) From the viewpoint of large fission product release in the case of AMs included, the containment bypass mode including
core damage accidents resulted from initiating events of interfacing system LOCA and SGTR is the most important.
IV. CONTAINMENT FAILURE FREQUENCY EVALUATION BY UNCERTAINTY
ESTIMATION METHOD
A. Uncertainty Estimation Method
The Latin Hypercube sampling (LHS) sampling method was applied to perform uncertainty analysis with a sample size
of 200 to each probability distribution function related to uncertainty parameters in the CET. The uncertainties in the CETs
were combined and propagated by the PREP/SPOP code 4 in which credit is given for statistically correlated parameters.
B. CET Headings Considered in Uncertainty and Quantification
In the uncertainty evaluation, the uncertainty probability distributions were examined based on level 2 PSA that carried
out for the Zion plant 5 in NUREG-1150 6 . The probability distribution functions that were used in the present study were generated for seven parameters of the severe accident phenomena: (1) over-temperature failure of primary system, (2)
over-temperature failure of steam generator tube, (3) oxidization rate of zirconium in reactor vessel, (4) discharge rate of
melted core debris at reactor vessel failure, (5) failure mode of reactor vessel, (6) pressure increase of containment
atmosphere at reactor vessel failure, and (7) containment failure probability. In addition, the uncertainty probability
distributions of in-vessel steam explosion and debris coolability in the reactor cavity were established in the present study
as shown in Figure 6 and 7 by ROAAM 7 method. These probability distributions were taken into account in the containment event tree, the probabilistic propagation calculation was performed, and the uncertainty of containment failure
frequency was estimated while was not included the uncertainty of level 1PSA.
C. Results of Uncertainty Analysis
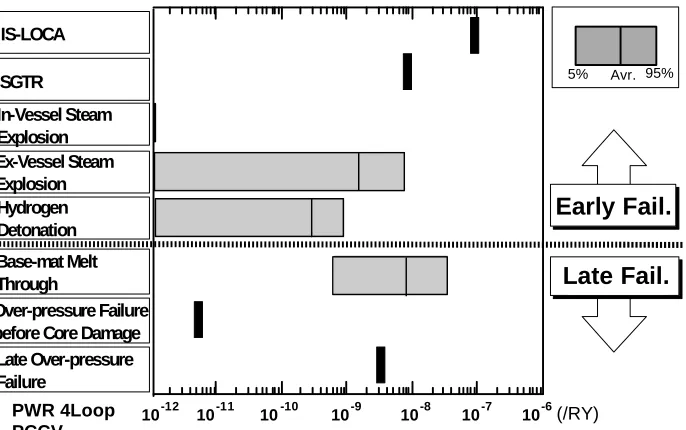
Results of uncertainty analysis including mitigation AMs are shown in Figure 8 with 5%, mean, and 95% values of
containment failure frequencies. Containment failure modes that lead to late containment failure have not large
uncertainties, such as containment bypass, and late over-pressurization excluding base-mat melt-through. Early
uncertainties do not contribute much to the total containment failure frequency. Uncertainty bound of base-mat
melt-through method was estimated to be about one and half digit from 6.E-10/RY to 3.E-08/RY, and mean value of the
bound was denoted to be 8.E-09/RY used ROAAM method.
V. CONCLUSIONS
The present study addressed to establish the containment failure frequency evaluation method by the point-estimate and
uncertainty evaluation method including for internal initiating events during full power operation for a Japanese 4-loop
PWR plant with pre-stressed concrete containment. In the present study, the calculated result showed that containment
failure frequency in the case without AMs was reduced about 50% by implementation of AMs. A dominant sequence that
leads to the containment failure with AMs was interfacing system LOCA sequence that a pipe of the residual heat removal
system breaks loaded primary system pressure. The results of the present study indicated the containment failure frequency
band of base-mat melt through has large uncertainty, but does contribute on a limited total containment failure frequency.
In the current program at NUPEC/INS, the evaluation of containment failure frequencies are being carrying out taking
into account the effectiveness of accident management measures after core damage on containment failure frequencies and
mitigation of accident progression based the operating manual obtained by utilities.
ACKNOWLEDGMENT
The present study was performed under the sponsorship of the Agency of Natural Resources and Energy (ANRE) of
Ministry of Economy, Trade and Industries (METI). Authors would like to express their sincere gratitude to Messrs. S.
Hara of METI ANRE. M.Hirano of NUPEC INS, and K. Nakajima for his support to use the MELCOR code.
REFERENCES
1. INS/NUPEC, “Level 2 PSA for 1100MWe, 4-Loop PWR Plant with a Large Dry Containment,” (in Japanese)
INS/M99-08 (2000)
2. R. M. Summers, et al., “MELCOR Computer Code Manuals,” NUREG/CR-6119, Vol.1 & Vol.2, (1995)
3. M. Sobajima, “Current Status of the Implementation Plan of Accident Management to Nuclear Power Plants,” Journal
of the Atomic Energy Society of Japan. Vol. 37 No. 5, 1995
4. T. Homma and A. Saltelli, “ LISA Package User Guide Part I, PREP(Statistical PRE Processer), Preparation of Input
Sample for Monte Carlo Simulations Program Description and User Guide,” EUR 13922 EN(1992)
5. M. B. Sattison, et al., “Analysis of Core Damage Frequency: Zion, Unit 1 Internal Events,” NUREG/CR-4550, Vol. 7,
Rev. 1 (1990)
6. USNRC, “Severe Accident Risks: An Assessment for Five U. S. Nuclear Power Plants,” NUREG-1150, Final Summary
Report (1990)
7. T. G. Theofanous, et. al., “An Assessment of Steam-Explosion-Induced Containment Failure,” NURG/CR-5030,
6
SE4.4%SL4.2% SEC3.0% P2.9%
SE’ 2.8% ALC2.5%
AEC2.2% SE”2.1%
TE’1% AL0.3%
AE0.2% TE0.04%
Figure 2 Core Damage Frequencies (Non AM) Figure 1 Accident Management Measures
Core Damage Frequency 4.3E-07/RY
CCWS
CV Spray Ring
Cooling down
RHRP
Charging P CV Spray P Fire P Raw
Water Tank
Pressurizer Relief Valve Cooling Coil
Containment cooling by Natural Convection Water Injection into CV
MSRV
Turbine
Containment Vessel
Forced Depressurization of the RCS
SG
RV
Refuelling Water Storage Pit
Recirculation
Charging injection
AE :Large&Medium LOCA/Early Core Damage /Without CV Spray
AEC:Large&Medium LOCA/Early Core Damage /With CV Spray
AL :Large&Medium LOCA/Late Core Damage /Without CV Spray
ALC:Large&Medium LOCA/Early Core Damage /With CV Spray
SE :Small LOCA/Early Core Damage /Without CV Spray
SE' :SBO/Pump Seal LOCA
SE":CCWS Failure/Pump Seal LOCA SEC:Small LOCA/Early Core Damage /with CV Spray
SL :Small LOCA/Late Core Damage /Without CV Spray
SLC:Small LOCA/Early Core Damage/With CV Spray TE :Transient/Early Core Damage/Without CV Spray TE :SBO
TEC:Transient/Early Core Damage/With CV Spray G : SGTR
P : Containment Failure before Core Damage V : Interface-System LOCA
TEC(25%)
V(21%)
7
Figure 4 Containment Failure Frequencies (Point Estimate)
DM1 DM2 D1 D2 D3 D4 D5
Yes Yes Yes No No No Natural Circulation Water Injec. & Spray Recovery Debris Cooling Hydrogen Burning Hydrogen detonation Over-pressure Base-mat melt through Containment failure Modes
Intact No No No No No No No No No No No No No No No No Yes Yes Yes Yes Yes Yes Yes Yes Yes Yes Yes Yes Yes Yes Yes Yes
Base-mat melt through
Overpressure Failure
Hydrogen Detonation Overpressure Failure Overpressure Failure Overpressure Failure
Base-mat melt through Base-mat melt through Base-mat melt through Base-mat melt through Base-mat melt through
Hydrogen detonation Intact Intact Intact Intact Intact Intact Intact
Figure 3 Containment Event Tree for a long term period after the reactor vessel failure
1.0E-16 1.0E-15 1.0E-14 1.0E-13 1.0E-12 1.0E-11 1.0E-10 1.0E-09 1.0E-08 1.0E-07 1.0E-06 In-Vessel SX
Isolation Failure Hydrogen Burn Overpressure Core-concrete Ex-Vessl SX
DCH SGTR
ISLOCA
Total
Containment Failure Modes
Frequency (/RY)
without AM with AM
Figure 5 Containment Failure Fraction (With AM)
SGTR 8% Melt Through 7%
Over-pressure 4%
Interface LOCA 81% Isolation failure 1%
Failure Frequency 1.1E-07/RY
8
Figure 6 Probability Distribution ofIn-Vessel Steam Explosion
Figure 7 Probability Distribution of Debris Cooling (Low Pressure, Sub-cool water & Water injection)
Figure 8 Uncertainty Band of Containment failure frequency (With AM)
10-12 10-11 10-10 10-9 10-8 10-7 10-6 SGTR
PWR 4Loop PCCV
(/RY)
Early Fail.
Late Fail.
5% Avr. 95%
IS-LOCA
Ex-Vessel Steam Explosion Hydrogen Detonation Base-mat Melt Through
Over-pressure Failure before Core Damage
Late Over-pressure Failure
In-Vessel Steam Explosion
0 0.2 0.4 0.6 0.8 1
0 0.2 0.4 0.6 0.8 1
P robability
Cumulative Probability
0 0.2 0.4 0.6 0.8 1
10-9 10-8 10-7 10-6 10-5 10-4 10-3
Cumulative Probability