ABSTRACT
JAMES, KRISTEN. The Development of US Ammonia Emission Factors for Use in Process Based Modeling. (Under the direction of Viney P. Aneja.)
An increase in agricultural production to sustain a growing population across the world has resulted in more ammonia (NH3) to be released into the atmosphere. Effects of gaseous ammonia on human health and the environment include aerosol formation, soil acidification, eutrophication, loss of biodiversity, and the neutralization of acids produced by sulfur and nitrogen oxides.
In the United States (US), agricultural production (crop + animal) accounts for ~81% of total ammonia emissions. Emissions from animal activities have been the focus of many recent studies as commercial operations continue to grow, dramatically increasing the number of animals in concentrated areas. Animal production facilities include dairy, beef, swine, poultry, sheep, goat, and horse operations. Past US ammonia emission factors for these animals are largely based on European studies and expressed as
composite values. This study is in response to the need of an updated a mmonia emission factor database for animal activities in the United States.
cattle and swine are lower than those found in previous studies while the emission factor for beef cattle is significantly higher than previous estimates. Poultry emission factors were similar to those previously developed. In much of the literature information relating to these factors (i.e. average animal weight, minimum and maximum emissions,
emissions from storage and land application) is inadequate or missing altogether. In order to develop a comprehensive emission factor database, more information (i.e. facility type, housing type, manure management system, average animal weight) should be presented in present and future observational studies.
Due to the need for more observational studies in order to properly develop emission factor databases, this thesis includes continuous ammonia emissions collected at a swine finishing facility in Eastern North Carolina. Emissions, production, and meteorological data were collected for approximately one week in each season (i.e. summer 2007, fall 2007, winter 2008, and spring 2008) from a mechanically ventilated house and on-site storage lagoon in an effort to assess diurnal and seasonal variability in emissions. Barn emissions were calculated using measured gas concentrations and the sum of fan flow rates to be 2604.63±660.71 g NH3-N day-1, 1761.24±1087.26 g NH3-N day-1,
The Development of US Ammonia Emission Factors for Use in Process Based Modeling
by Kristen James
A thesis submitted to the Graduate Faculty of North Carolina State University
in partial fulfillment of the requirements for the Degree of
Master of Science
Marine, Earth, and Atmospheric Sciences
Raleigh, North Carolina 2008
APPROVED BY:
S. Pal Arya
Viney P. Aneja
Chair of Advisory Committee
ii
BIOGRAPHY
Kristen Marie James was born on June 25, 1984 in Fairfax, Virginia to the parents of Reed and Helen James. Kristen has one older sister Laura Ruth Crowell and a younger brother Michael Edward James. Kristen greatly values family, health, and education and her life so far is a reflection of this. Growing up Kristen enjoyed playing many sports including basketball, t-ball, soccer, and tennis. In high school she focused her academic career largely on math and science and her athletic career on tennis. Upon graduation from Centreville High School in May, 2002 Kristen chose to attend the University of Virginia where she studied Environmental Science and played varsity tennis on a full athletic scholarship. In May, 2006, Kristen graduated cum laude from the University of Virginia with a B.A. in Environmental Sciences.
iii
ACKNOWLEDGEMENTS
I would like to first thank Dr. Viney P. Aneja for accepting me into the Air Quality Research group at North Carolina State University in August, 2006. His guidance, support, and encouragement were invaluable through my graduate work process. I’d also like to thank my committee members Dr. Pal Arya and Dr. Daniel Tong for all their efforts and time.
In addition to my committee members I would like to thank many other people who together made this experience possible. Thank you to all my professors who put their research aside for a few hours each week to teach me and others the various aspects of atmospheric science and air pollution. Thank you to the entire Marine, Earth, and Atmospheric Science staff, faculty, and students for organizing various learning, social, and networking opportunities. Specific people aiding my research include Brian Baldelli who provided us with excellent service delivering and collecting cylinders at the field site for each season. Mr. Moore and the Farmers Association were very generous in allowing us to use their commercial farm for our scientific experiment. The North Carolina
Division of Water Quality unselfishly provided their services to analyze our lagoon samples. Finally, my partner Ian Rumsey is to thank for helping me get through the long days and often nights of weeks at the farm, data analysis, and so much more.
iv
myself in laughter and joy even during the most stressful times. I am truly grateful to everyone along the way who has inspired and encouraged my dreams. Friends, family, and mentors have all shaped me into the person I am today and to you I am forever indebted.
v
TABLE OF CONTENTS
Page
LIST OF TABLES ... vii
LIST OF FIGURES ... viii
CHAPTER I.INTRODUCTION AND BACKGROUND ... 1
1.1 Ammonia Production from Animal Waste ... 3
1.2 Ammonia Volatilization ... 4
1.3 Ammonia Chemistry ... 4
1.4 Ammonia Emission Factor Development from Animal Activities in the United States ... 6
1.5 Objectives ... 7
1.6 References ... 8
CHAPTER II.THE DEVELOPMENT OF A USAMMONIA EMISSION FACTOR INVENTORY ... 16
Abstract ... 16
2.1 Introduction ... 17
2.1.1 Agricultural Production ... 17
2.1.2 Animal Production Facilities and Manure Management... 17
2.2 Ammonia Emission Factor Development... 20
2.3 Results and Discussion ... 23
2.3.1 Review of Emission Measurement from Different Stages of Animal Production ... 23
2.3.1.1 Buildings ... 24
2.3.1.2 Storage and Treatment Practices ... 30
2.3.1.3 Land Application ... 32
2.3.2 Ammonia Policy ... 33
2.4 Summary ... 38
2.5 References ... 40
CHAPTER III.CHARACTERIZING AMMONIA EMISSIONS FROM AMECHANICALLY VENTILATED SWINE FINISHING FACILITY AND AN ANAEROBIC WASTE LAGOON IN NORTH CAROLINA ... 65
Abstract ... 65
3.1 Introduction ... 67
3.2 Methods and Materials... 68
3.2.1 Farm Location and Characteristics ... 68
vi
3.2.3 Instrumentation ... 69
3.2.4 Barn Measurements and Emission Rate Calculations ... 74
3.2.5 Ammonia Flux Measurements ... 76
3.3 Results and Discussion ... 80
3.3.1 Barn Emissions ... 80
3.3.1.1 NH3-N Emissions ... 81
3.3.1.2 NH3-N Normalized Emission Rates and Emission Factors ... 83
3.3.2 Lagoon Emissions ... 84
3.3.2.1 NH3-N Flux ... 85
3.3.2.2 Lagoon Temperature and Ammonia Flux ... 86
3.3.2.3 Lagoon pH and Ammonia Flux ... 88
3.3.2.4 TAN, TKN, and NH3-N Flux ... 89
3.3.2.5 Meteorological Parameters and Ammonia Flux ... 90
3.3.2 Surface Layer Turbulence and Ammonia Flux ... 90
3.4 Conclusions ... 93
3.5 References ... 95
CHAPTER IV. SUMMARY AND CONCLUSIONS ... 128
APPENDICES... 131
1 Hourly averaged barn emission rates and meteorological parameters for all seasons ... 132
2 Hourly averaged lagoon emission rates and meteorological parameters in all seasons ... 143
3 Abstract from 2007 Annual A&WMA Conference & Exhibition ... 153
4 Abstract from 2007 International Conference on ammonia in agriculture ... 154
vii
LIST OF TABLES
CHAPTER I. ... Page
Table 1.1 Ammonia emissions estimates in the United States for the year 2002 ... 10
Table 1.2 US and European air pollutant emission estimates ... 11
CHAPTER II. Table 2.1 Ammonia emissions factors from agriculture in the US ... 48
Table 2.2 Ammonia emissions from dairy cattle barns and feedlots... 49
Table 2.3 Ammonia emissions from beef housing and feedlots ... 51
Table 2.4 Ammonia emissions from swine housing in the United States ... 52
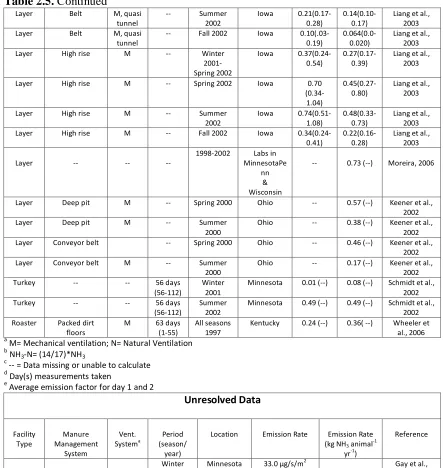
Table 2.5 Ammonia emissions from poultry houses in the United States ... 55
Table 2.6 US ammonia emission factor summary for animal housing ... 58
Table 2.7 Ammonia emissions from storage and treatment structures in the United States ... 59
Table 2.8 Ammonia emissions from storage structures presented by Gay et al., 2003 ... 63
Table 2.9 US ammonia emission factor summary for storage and treatment structures ... 64
CHAPTER III. Table 3.1 Sampling dates and production data for housing emissions in each season... .. 100
Table 3.2 Average barn measurement statistics collected during all seasons ... ... 101
Table 3.3 Statistical summary of total NH3-N emissions, normalized emission rates, and emission factors for each season ... 102
Table 3.4 Average lagoon flux and parameter statistics measured during each season... 103
viii
LIST OF FIGURES
CHAPTER I. ... Page
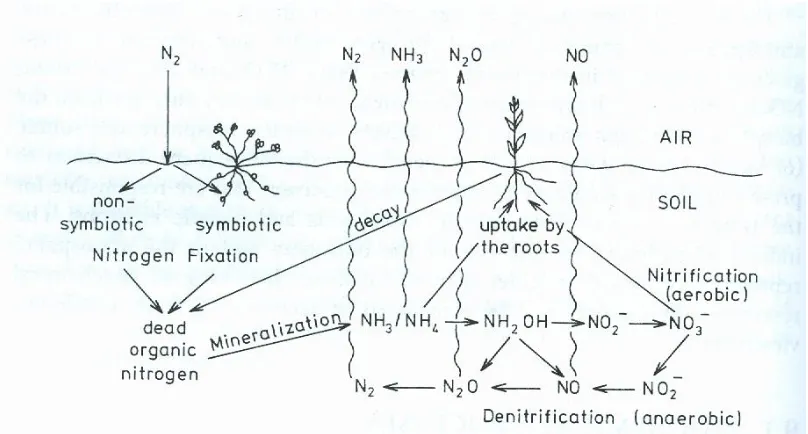
Figure 1.1 The biological nitrogen cycle in the atmosphere-soil system... 12
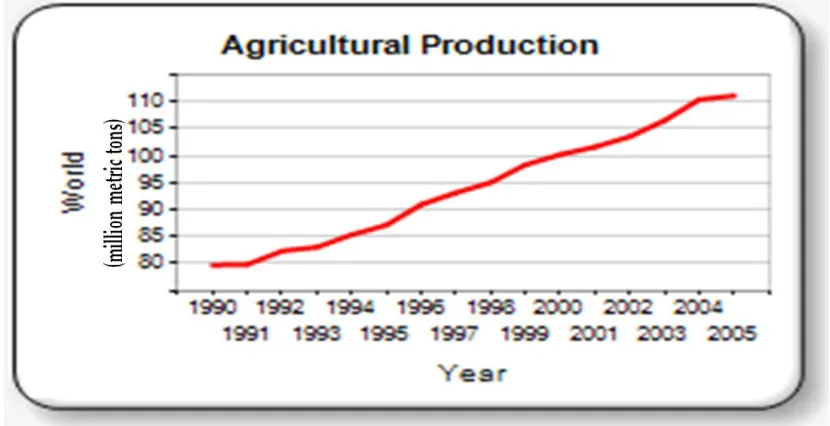
Figure 1.2 Global agricultural production trends between 1990 and 2005... 13
Figure 1.3 Total agricultural NH3 emissions trends in the United States (US) and 15 European Union (EU) member states since 1990... 14
Figure 1.4 Primary sources of NH3 emissions from animal agriculture by region in the United States ... 15
CHAPTER III. Figure 3.1 Location of Moore Farm in Jones County and Horticultural Crops Research Station in Sampson County, North Carolina ... 105
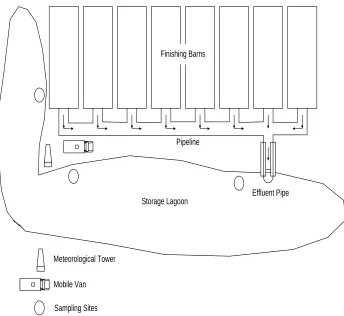
Figure 3.2 Schematic of Moore Farm a conventional lagoon and spray technology facility ... 106
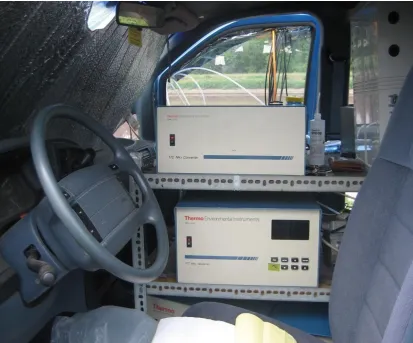
Figure 3.3 A Model 17c chemiluminescence ammonia analyzer made by Thermo Environmental Instruments (TEI) ... 107
Figure 3.4 The on-site 10 meter meteorological tower used to measure air temperature, relative humidity, solar radiation, wind speed, and wind direction ... 108
Figure 3.5 Picture and schematic of a mechanically ventilated swine house on Moore Farm ... 109
Figure 3.6 A picture and schematic of the dynamic flow-through chamber system used to measure ammonia flux off the surface of the lagoon ... 110
Figure 3.7 Seasonally averaged diurnal variations of NH3-N emissions ... 111
Figure 3.8 Seasonally averaged diurnal variations of total ventilation rates ... 112
Figure 3.9 Seasonally averaged diurnal variations of ambient temperature ... 113
Figure 3.10 Seasonally averaged diurnal variations of barn temperature ... 114
Figure 3.11 Barn temperature plotted against ambient temperature ... 115
Figure 3.12 Barn temperature plotted against total ventilation rates ... 116
Figure 3.13 Seasonally averaged diurnal variations of NH3-N flux off the surface of the lagoon ... 117
Figure 3.14 Log10 NH3-N flux plotted against lagoon temperature ... 118
Figure 3.15 Log10 NH3-N flux plotted against pH ... 119
Figure 3.16 Log10 NH3-N flux plotted against aqueous NH3 ... 120
Figure 3.17 Diurnal variation of NH3-N flux ... 121
Figure 3.18 Diurnal variation of the gradient Richardson number ... 122
Figure 3.19 Diurnal variation of dimensionless wind shear and dimensionless temperature gradient ... 123
Figure 3.20 Diurnal variation of Obukhov length ... 124
Figure 3.21 Diurnal variation of wind speed and friction velocity ... 125
ix
1
CHAPTER I. INTRODUCTION AND BACKGROUND
Contemporary changes in the nitrogen cycle shown in Figure 1.1 are largely attributed to an increase in population and energy demands worldwide. The need for food and energy to sustain a growing number of people has resulted in a 2.2% annual increase in global agricultural production since 1990 (Figure 1.2) (FAOSTAT, 2007). Greater animal and crop production has caused an increase in nitrogen compound emissions. Ammonia (NH3) is a nitrogen compound of particular interest due to its abundance in the atmosphere and its effects on human and environmental health.
Ammonia (NH3) is the primary gaseous base in the atmosphere. Global sources of NH3 include coal combustion, automobiles, biomass burning, domestic animals, wild animals, human excrements, soil and plant emissions, oceans, and fertilizers.
Agricultural emissions from livestock production and soils are the source of over half of the total global ammonia budget (Bouwman et al., 2002). In the United States, agricultural production accounts for over 80% of total ammonia emissions (Table 1.1). Gaseous ammonia emissions affect human health and the environment in a number of ways. Impacts include secondary aerosol formation, soil acidification, eutrophication, loss of biodiversity, and the neutralization of acids produced by sulfur and nitrogen oxides (Warneck, 2000).
2
health concern because inhaled particles can accumulate in the respiratory system. In fact, many studies suggest that PM2.5 emissions cause more adverse health effects than coarse particles (PM10) (Woodruff et al., 1997; WHO, 2003; Schwartz and Neas, 2000). When ammonia is deposited to soils, it can be oxidized by soil microbes to produce the nitrate ion. Thus soil acidification occurs when ammonia deposits on soils with low buffering capacity often causing sensitive crops to be damaged by over-fertilization. Deposition of ammonia also causes eutrophication or an increase in chemical nutrients which can support harmful algal growth leading to the decline of aquatic species. Finally, volatized ammonia can travel hundreds of miles from its source affecting local and regional biodiversity far from its origin (Gay, 2005).
Many countries are beginning to recognize the role and importance of ammonia in the formation of PM2.5 and are seeking ways to reduce this precursor. For example, in their effort to reduce ammonia emissions in accordance with 1999 Gothenburg
3
emission factor for each animal type. Current inventories divide animal populations into different types of farms and use multiple emission factors (US EPA, 2005). A better representation of trends in the United States is seen in Table 1.2 which compares primary pollutant and ammonia estimates in the United States and Europe in 1970 and 2005. NH3 emission estimates in the US have increased by almost 30% since 1970 while European estimates have decreased by over 20% from levels reported in 1970. Emissions of all other pollutants in the US have decreased since 1970, suggesting that proper regulation and management of ammonia emissions could result in lower nationwide concentrations.
1.1 Ammonia Production from Animal Waste
The conversion of dietary nitrogen (N) to products in animal diets is an inefficient process resulting in a large percentage of consumed N to be excreted (Flesch et al., 2007; Keener et al., 2002). Ammonia is a by-product of the microbial decomposition of organic N substrates. In manure, nitrogen is in the form of unabsorbed nutrients in feces and urea for mammals or uric acid for poultry. Soon after excretion ammonia is formed with the hydrolysis of urea and uric acid and continues in both aerobic and anaerobic conditions through microbial breakdown in manure. The degradation processes of urea, uric acid, and undigested proteins are complex but can be simplified as seen below (Koerkamp et al., 1998):
4
Mineralization- Undigested proteins→ NH3 (3)
Because NH3 is very soluble, it accumulates in manures managed as liquids or slurries and quickly volatilizes from solid manures (US EPA, 2001).
1.2 Ammonia Volatilization
Ammonia volatilization is highly variable and is influenced by the amount of total ammoniacal nitrogen (TAN), temperature, wind speed, pH, chemical and
microbiological activities, diffusive and convective transport in the manure, and gas phase resistance in the boundary layer above the source (Arogo et al., 2006). For example, greater TAN concentrations, wind speeds, temperatures, and pH levels increase ammonia volatilization. NH3 emissions increase linearly with TAN
concentration. Higher temperatures increase NH3 volatilization rates due to decreased solubility, in turn, affecting NH3/ NH4+ equilibrium which follows Henry’s law for dilute systems:
NH3(l)↔ NH3(g) (4)
NH3(g,manure)↔ NH3(g,air) (5)
Ammonia-ammonium equilibrium [NH4+(l)↔NH3(l) + H+]is affected by temperature influencing the dissociation constant Ka [Ka= (NH3)(H3O+)/(NH4+)] and pH. Levels of pH greater than 7.0 allow NH3 to undergo volatilization. Otherwise, NH3 is in the form of NH4+ and therefore cannot be volatized (Koerkamp et al., 1998).
5
Ammonia has a short chemical lifetime on the order of 1-5 days (Warneck, 2000). In the atmosphere, NH3 first reacts with sulfuric acid (H2SO4) to form ammonium sulfate aerosols [(NH4)2SO4, (NH4)3H(SO4)2, NH4HSO4] and then reacts with nitric acid (HNO3) to form ammonium nitrate (NH4NO3) in the presence of excess NH3 (Gilliland et al., 2003). Therefore, there are two regimes of interest, ammonia-poor and ammonia-rich. In ammonia-poor conditions low NH3 partial pressures cause
ammonium nitrate levels to be close to zero. In ammonia-rich conditions there is excess ammonia available to neutralize the aerosol phase and react with nitrate. At low ammonia concentrations, sulfuric acid and bisulfate constitute aerosol composition while ammonium nitrate becomes the significant aerosol constituent at higher ammonia concentrations (Seinfeld and Pandis, 2006). NH3 can undergo additional reactions to form ammonium chloride (NH4Cl) or it can be directly deposited onto the Earth’s surface through wet and dry deposition processes (Aneja et al., 2000). Approximately 10% of NH3 in the atmosphere reacts with the hydroxyl radical (OH) (Finlayson-Pitts and Pitts, 2000). A summary of the above reactions directly involving ammonia follows:
NH3(g) + H2SO4(l)→ NH4SO4(l) (6)
NH3(g) + HNO3(g) ↔ NH4NO3(s, aq) (7)
NH3(g) +HCl(g) ↔ NH4Cl(s) (8)
NH3(g) + H2O(l)→ NH4+ + OH- (9)
6
1.4 Ammonia Emission Factor Development from Animal Activities in the United States
In order to reduce ammonia emissions in the United States it is important to identify sources of emissions which are very different across the nation. Figure 1.4 shows the primary sources of ammonia emissions from animal agriculture by region in the United States. Ammonia is largely emitted from housing, manure storage, and land application at animal production facilities. The US government has recently recommended a process based modeling approach involving the analysis of farm systems through their component parts using emission factors measured in various studies.
An emission factor is defined as the mass per unit activity over a period of time. It represents the sum of mean NH3 emission rates from housing, manure storage, and land application. Past ammonia emission factor estimates from animal agriculture in the United States have been largely based on European studies and expressed as composite values (Battye et al., 1994). European and US animal production facilities and manure management systems are often very different and composite values fail to distinguish between the many factors affecting emissions (i.e. animal weight, location of facility).
7
concentrations, and other relevant meteorological data should be presented in all
present and future studies. Data and understanding of the current state of science would allow for the proper development of control strategies and best management practices.
1.5 Objectives
The objectives of this study include:
1) Organizing all US observational ammonia emissions data from animal activities presented in peer reviewed papers, conference papers, and reports since 1998
2) Calculating emission factors in units of (g NH3-N kg-1 day-1) and (kg NH3 animal-1 yr-1) as recommended by the USDA and US EPA respectively 3) Comparing and contrasting emission factors during different stages of
production at dairy, cattle, swine, and poultry operations throughout the United States
4) Measure and determine the amount of ammonia emitted from a
mechanically ventilated housing structure and an anaerobic storage waste lagoon at a swine finishing facility in eastern North Carolina
5) Evaluating diurnal and seasonal profiles of ammonia emissions off the surface of a waste treatment lagoon and finishing house
6) Assessing the influence of meteorological factors on ammonia emissions in various seasons
8
1.6 References
Aneja, V.P., J.P. Chauhan, and J.T. Walker (2000), Characterization of atmospheric ammonia emissions from swine waste storage and treatment lagoons, J. Geophys. Res., 105(D9), 11535-11545.
Arogo, J., P.W. Westerman, A.J. Heber, W.P. Robarge, and J.J. Classen (2006), Ammonia emissions from animal feeding operations, in Animal Agriculture and Environment: National Center for Manure & Animal Waste Management While Papers, edited by J.M. Rice et al., pp. 41-88, ASABE, St. Joseph, Michigan.
Battye, R., W. Battye, C. Overcash, and S. Fudge (1994), Development and selection of ammonia emission factors. Report #68-D3-0034, US Environmental Protection
Agency, Washington, D.C.
Bouwman, A. F., L. J. M. Boumans, and N. H. Batjes (2002), Estimation of global NH3 volatilization loss from synthetic fertilizers and animal manure applied to arable lands and grasslands, Global Biogeochem. Cycles, 16(2), 1024, doi:10.1029/2000GB001389. Erisman, J. W., A. Bleeker, A. Hensen, and A. Vermeulen (2006), Agricultural air quality in Europe and the future perspectives, paper presented at Workshop on Agricultural Air Quality: State of the Science, Potomac, Maryland, 5 -8 June.
EMEP (2007), http://webdab.emep.int/scaled.html, Expert Emissions Used in EMEP Models.
FAOSTAT (2007), http://faostat.fao.org/site/339/default.aspx, Food and Agriculture Organization of the United Nations.
Finlayson-Pitts, B.J. and J.N. Pitts (2000), Chemistry of the Upper and Lower Atmosphere: Theory, Experiments, and Applications, Academic Press, San Diego, California.
Flesch, T.K., J.D. Wilson, L.A. Harper, R.W. Todd, and N.A. Cole (2007), Determining ammonia emissions from a cattle feedlot with an inverse dispersion technique, Agr. Forest Meteorol., 144(1-2), 139-155.
Gay, S.W., (2005), http://www.ext.vt.edu/pubs/bse/442-110/442-110.html, Ammonia emissions and animal agriculture, Publication #442-110, Blacksburg, Virginia. Gilliland, A.B., R.L. Dennis, S.J. Roselle, and T.E. Pierce (2003), Seasonal NH3 emission estimates for the eastern United States based on ammonium wet
9
Keener, H.M., D.L. Elwell, and D. Grande (2002), NH3 emissions and N-balance for a 1.6 million caged layer facility: manure belt/composting vs. deep pit operation, T. ASABE, 45(6), 1977-1984.
Koerkamp, P.W.G., J.H.M. Metz, G.H. Uenk, V.R. Phillips, M.R. Holden, R.W. Sneath, J.L. Short, R.P. White, J. Hartung, J. Seedorf, K.H. Linkert, S. Pedersen, H. Takai, J.O. Johnsen, and C.M. Wathes (1998), Concentrations and emissions of ammonia in livestock buildings in Northern Europe, J. agric. Engng. Res., 70, 79-95. Schwartz, J. and L.M. Neas (2000), Fine particles are more strongly associated than coarse particles with acute respiratory health effects in schoolchildren, Epidemiology
11, 6-10.
Seinfeld, J.H. and S.N. Pandis (2006), Atmospheric Chemistry and Physics: From Air Pollution to Climate Change, 2nd ed.,John Wiley & Sons, Inc., Hoboken, New Jersey. US EPA (2005), National Emissions Inventory,
http://www.epa.gov/ttn/chief/net/2002inventory.html, United States Environmental Protection Agency, Washington D.C.
US EPA (2001), Emissions from Animal Feeding Operations: Draft,
http://www.epa.gov/ttn/chief/ap42/ch09/draft/draftanimalfeed.pdf, United States Environmental Protection Agency, Washington D.C.
Warneck, P. (2000), Chemistry of the Natural Atmosphere, 2nd ed., Academic Press, San Diego, California.
WHO (2003), Health Aspects of Air Pollution with Particulate Matter, Ozone, and Nitrogen Dioxide, World Health Organization, Regional Office for Europe, Copenhagen.
Woodruff, T., J. Grillo, and K. Schoendorf (1997), The relationship between selected causes of posneonatal infant mortality and particulate air pollution in the United States.
10
Table 1.1. Ammonia emission estimates in the United States for the year 2002. (Source: US EPA, 2005)
Source Ammonia Emissions
(tons/yr) % of Total Emissions
Animal
Dairy(dairy cows and dairy heifers)
558,094 12.71
Beef(beef cattle, bulls, and calves)
656,648 14.95
Poultry(chickens and turkeys)
664,238 15.12
Swine(breeding and marketing pigs)
429,468 9.78
Sheep 24,835 0.57
Goats(milking and Angora goats)
14,028 0.32
Horses 71,285 1.62
Total Animal 2,418,595 55.07
Fertilizer 1,140,396 25.97
TOTAL AGRICULTURE 3,558,991 81.03
Other
Chemical and Applied Product MFG
23,123 0.53
Fuel Comb. Elec. Util. 30,256 0.69
Fuel Comb. Industrial 15,959 0.36
Miscellaneous 282,166 6.42
Fuel Comb. Other 17,602 0.40
Mobile Sources 289,871 6.60
Waste Disposal and Recycling
25,770 0.59
Other Industrial Processes 148,288 3.38
Total Other 833,035 18.97
11
Table 1.2. US and European air pollutant emission estimates (million tons/yr). (Source: US EPA, 2005 http://www.epa.gov/airtrends/)
CO NOx PM
2.5 PM10 SO2 VOC Pb NH3
1970 197.3 26.9 2.3
(1990)
12.2 31.2 33.7 0.221 1.9
2005 89 19 2 2 15 16 0.003 2.6
Percent Change
(US)
-55% -29% -13% -84% -52% -53% -99% +27%
Percent Change (Europe)
12
13
14 0
500 1000 1500 2000 2500 3000 3500 4000 4500 5000
1990 1991 1992 1993 1994 1995 1996 1997 1998 1999 2000 2001 2002 2003 2004
Tot
al
E
m
issi
on
s
(G
g
N
y
r
-1)
Year
Total Agricultural NH3Emissions
EU15
US -10.8%
3413 3045
Figure 1.3. Total agricultural NH3 emissions trends in the United States (US) and 15 European Union (EU) member states since 1990.
15
16
CHAPTER II.THE DEVELOPMENT OF A USAMMONIA EMISSION FACTOR DATABASE
Abstract
Food and energy demands to sustain growing numbers of people all across the world have resulted in increased emissions of nitrogen compounds. Ammonia is a nitrogen compound of particular interest because its emissions contribute to elevated levels of fine particulate matter (PM2.5), which causes visibility degradation and adverse health effects. Together, crop and animal production contribute over 80% of total ammonia emissions in the United States (US). Animal production facilities
17
2.1 Introduction
2.1.1 Agricultural Production
Agricultural net production worldwide has increased by 2.2% annually in the past 15 years. Crop gross production and animal gross production account for 63% and 37% of total production respectively (FAOSTAT, 2007). Although crop production dominates global production, forecasted 2007 US agricultural revenues suggest that livestock and crops contribute equally large amounts to the nation’s economy at approximately $140 billion per year (USDA ERS, 2007).
In the United States, the number of farms has been steadily declining since 1935 while productivity has risen. Specifically, the fraction of farms raising livestock or poultry has consistently decreased since 1910 (NRC, 2003). Livestock agriculture includes maintaining livestock to produce meat, milk, eggs, and wool. Between 1982 and 1997 livestock production increased by 10 percent even as the number of animal feeding operations decreased by over 50 percent (NRC, 2003).
2.1.2 Animal Production Facilities and Manure Management
18
Dairy Cattle
Dairy cattle are considered housed or grazing. Barns are either free or tie stall housing systems and may be enclosed or open sided. Manure management practices in the United States include solid floors (i.e. concrete) with flushed pits or mechanical scrapper systems, dry lots, bedded packs, and slatted floors with storage below. Mechanical scrapers are often used on small farms where flush systems are more common on large farms. Dry lots or bedded packs are seen in drier climates where manure is occasionally removed with a tractor. Depending on the manure management system, dairy cattle manure is either stored on concrete or earthen pads in dry piles, in a lined lagoon or storage tank, or in covered or uncovered lagoons mixed with flush water.
Calves, heifers, and dry cows are housed separately from lactating cows. In the United States, the majority of dairy farmers sell their bull calves and raise heifers. Mature cows calve every 12-14 months and typically produce an equal number of male and female calves. Lactating cows produce milk daily increasing in weight for about 10 weeks before decreasing for the rest of the lactation period which lasts anywhere from 10-12 months (NRC, 2003).
Beef Cattle
19
involves routinely scraped earthen floor pens or solids compiled into mounds within the pen. Total confinement barns use bedding on solid floors or slatted floor confinement designs with flush systems for manure management. Confined beef housing is rare in the US.
Swine
US swine production facilities include both open and confined systems. Most pigs are raised in total confinement in either pens or stalls. Manure management practices in the US involve partially or fully slatted concrete floors with shallow or deep pits below for storage and gutters. Manure is removed from swine buildings through flushing, scraping, pit recharge, or pull plug systems. Manure is stored in slurry manure
handling systems which include the collected manure, spilled water and feed, and wash water in concrete pits or gutters below the ground. Swine manure is also stored in anaerobic lagoons and deep pits. Solid manure management systems include deep bedding, high rise facilities, hoop houses, scraped, and open buildings with lots. Solid manure is usually stored in stacks or covered until it can be used as fertilizer.
20
systems include farrowing and nursery pigs, and wean-to-finish operations include nursery and finishing phases (NRC, 2003). Gestation, breeding, and farrowing facilities comprise US sow farms. Each week approximately 1/20th of a sow herd is bred,
farrow, or wean pigs. The rotation is in accordance with the gestation cycle of pigs providing a continual flux of pigs from the operation (NRC, 2003).
Poultry
Broilers and turkeys in the United States are almost entirely raised in houses with floors packed with new or built-up litter. Layers are raised in caged or high rise facilities where manure is collected either on a conveyor belt or stored in deep pits below the cages.
Some broiler flocks are marketed at 6 weeks of age or less depending on the demand. Others are grown for 7-8 weeks to heavier weights for further processing or sale as roasters. Turkey hens are usually marketed after 12-14 weeks weighing 12-16 pounds or further processed for 18-20 weeks at 18-22 pounds. Broilers and turkeys are typically raised on an “all-in, all-out” basis where a flock of birds is raised from birth to
market weight (NRC, 2003).
2.2 Ammonia Emission Factor Development
21
based on studies conducted in Northern Europe (Asman, 1992). US animal production facilities and manure management systems are often very different from those in Europe and therefore the use of emission factors from these studies is not a good
representation of US emissions. A composite value is a weighted average of all animal types, sizes, and production activity. Expressing an emission factor as a composite value is an issue because it does not distinguish between the many factors affecting emissions (i.e. different sizes of the animals, location of facility, conditions in which they are being raised, manure management system).
Emission factors for domestic animals are sometimes expressed in terms of ammonia emissions per head of livestock and sometimes in terms of emissions per animal unit, where an animal unit is a standardized weight. The USDA defines an animal unit as 1000 pounds of live weight. In accordance with their most recent findings, the USDA has recommended expressing emission factors from animals in units of mass of NH3-N kg-1 day-1 to be used in process based modeling where estimates of individual N species components are in the context of total N losses.
Use of Emission Factors in Process Based Modeling
22
Current composite emission factors for NH3 generally suffer from the lack of information available to determine seasonal variations on a regional scale and
uncertainties of US emission factors (Gilliland et al., 2003). This causes emission factor estimates based on modeling to be highly varied. For example, Pinder et al., 2004 suggests an emission factor for dairy cows of 23.9 kg NH3 cow-1 yr-1 where Rumburg et al., 2007a suggests an emission factor of 40 kg NH3 cow-1 yr-1. In addition, models often fail to properly account for larger production facilities in more concentrated areas. For example, ammonia emissions from swine facilities have increased approximately 400% in North Carolina since 1990 (Walker et al., 2005). Within the state, localized areas including Duplin and Sampson County have the largest number of swine operations and therefore produce the greatest amount of ambient ammonium concentrations (Deerhake et al., 2006).
In order to account for different meteorological and climatological conditions in the United States, the US EPA and the Lake Michigan Air Directors Consortium (LADCO) have recently developed a CONCEPT Process Based Ammonia Model. A 2005 report documents the development of a process based ammonia emissions model for
23
(Wang et al., 2005). Each level generally suffers from a lack of observational data needed for model input.
2.3 Results and Discussion
2.3.1 Review of Emission Measurements from Different Stages of Animal Production
24
considered winter emission factors, March-May is spring, June-August is summer, and September-November is fall.
2.3.1.1 Buildings
Ammonia emission from buildings is dependent on a number of factors including N content in food, efficiency of N conversion, animal weight, housing type and manure management system, and environmental conditions inside the building. The emission rate from a building is calculated by summing net NH3 mass flows from all outlets. Most studies compute ammonia emissions from mechanically ventilated buildings by multiplying ventilation rates by the corresponding NH3 concentration data (Lacey et al., 2003; Wheeler et al., 2006; Blunden et al., 2007; Harper et al., 2004). NH3 emission rates are generally estimated from naturally ventilated buildings through the use of passive flux samplers or tracer gas methods (Cassel et al., 2005a; Jacobson et al., 2003; Schmidt et al., 2002).
US ammonia emission factors for animal activity are expressed in numerous ways throughout the literature including as mass per unit time per animal, mass per unit time per animal unit (1 animal unit=500 kg live mass), mass per time per animal place, and mass per unit time per unit area. Reporting emission factors in such a diverse manner often makes it difficult to collapse information necessary for emission factor
development and the lack of information in various studies (i.e. average animal weight) prevents the calculation of emission factors during different stages of animal
25
emission factors to be calculated (2) unresolved data where information necessary to express an emission factor in terms of mass per unit time per animal was unavailable. All available factors from the different stages of animal production are collapsed in Table 2.6 providing a composite value for comparison with those seen in Table 2.1.
Dairy Housing and Feedlots
Dairy cattle are often housed in freestall or tiestall barns or allowed to graze in open lots. A small number of dairy farms in the United States involve a combination of these different housing options (Cassel et al., 2005b; Gay et al., 2003). Housing systems for dairy cattle vary in terms of flooring and manure storage. Some barns have concrete floors with flush, scraper, or pull plug systems to remove manure. Others facilities have slatted floors where manure is stored in shallow or deep pits below the slats. Finally, many dairy cattle roam in open lots. Emission factors presented in Table 2.2 are highly varied ranging from 2.8-46.4 kg NH3 animal-1 yr-1. The results suggest that emissions are greater during the warmer seasons likely caused by higher indoor temperatures and greater airflow ventilation (Mukhtar et al., 2006; Cassel et al., 2005b; Schmidt et al., 2002). It is difficult to determine the advantages and disadvantages of the different manure management systems due to the incomplete data.
Beef Cattle Housing and Feedlots
Beef cattle are generally raised on pastures or in open feedlots. Manure
26
summer. A similar study in Texas by Todd et al., 2007 suggests an annual emission factor of 19.3 kg NH3 animal-1 year-1 based on spring, summer, and winter
measurements. The inclusion of winter emission rates and the type of cattle at the facility studied by Todd et al., 2007 may be the reason for the difference in emission factor estimates. Table 2.3 summarizes beef cattle emission factors from studies in the US.
Swine Housing
27
Facility type is an important characteristic to consider when developing ammonia emission factors for swine because larger pigs require greater feed intake and water resulting in higher emissions. Manure management systems vary throughout the United States due to different climate conditions and the need for fertilizer use at the site. In colder regions such as the Midwest, deep pit manure management is common whereas flushing is more widely used in warmer areas such as Southern and Central states. Emission factors from housed swine operations are shown in Table 2.4.
Average emission factors on finishing farms range from 0.011 to 0.34 g NH3-N kg-1 day-1. Blunden et al., 2007 found ammonia emissions were the greatest in the winter averaging 0.067 g NH3-N kg-1 day-1 and lowest in the fall at 0.024 g NH3-N kg-1 day-1 for a facility with a shallow pit recharge system. Observations at farms with deep pit, deep bedded, or pull plug manure management systems are generally higher than emissions from shallow pit and daily flush type operations. For example, a calculated average for the spring, summer, and fall season by Heber et al., 2000 suggests an emission factor from deep pit finishing facilities to be 0.16 g NH3-N kg-1 day-1. Jacobson et al., 2003 found that ammonia emissions from a deep bedded hoop operation were high in the both the winter and summer- 0.34 and 0.29 g NH3-N kg-1 day-1 respectively.
28
These emission factors are lower than 0.072 g NH3-N kg-1 day-1 which was estimated in the fall of 2004 at a site in Iowa (Powers et al., 2006).
Emissions for farrowing pigs in the United States are presented from facilities in the Midwest where deep pit or deep bedded manure management systems are common. Jacobson et al., 2004 found emissions from deep bedded systems to be 85% higher than emissions from operations with deep pits under slated floors -0.089 and 0.048 g NH3-N kg-1 day-1 respectively. A later study by Jacobson et al., 2006 estimates an emission factor of 0.020 g NH3-N kg-1 day-1 at a site with pull plugs.
Poultry Housing
Ammonia emission studies from poultry housing in the United States are largely focused on broiler, turkey, and layer facilities. Broilers and turkeys are raised in houses with concrete, shale, packed dirt, or wood shaving floors where litter usually builds up for a period of time before it is removed. Wheeler et al., 2003 & 2006 show
significantly lower ammonia emissions at facilities with new litter and concrete flooring. Layers are generally reared in cages where manure is either collected on a conveyor belt or dropped into a storage pit below at high rise facilities. A study by Liang et al., 2003 suggests ammonia emission factors for operations with high rise manure management systems are significantly higher during all four seasons than houses with belt systems. A summary of all available data in the United States is presented in Table 2.5.
29
Collapsing all the information presented in Tables 2.2-2.5 yields a housing emission factor for each animal. The type of animal, emission factor, range, and number of studies used to develop an ammonia emission factor are presented in Table 2.6.
The housing emission factor for dairy cattle presented in Table 2.6 is 24.5 kg NH3 animal-1 yr-1. The most recent emission factor of 38.1 kg NH3 animal-1 yr-1 developed by the US EPA is a sum of housing, storage, and land application emissions. Studies to determine ammonia emissions from manure storage and land application at dairy farms is needed to fully compare past and present results.
Previous studies have found total beef cattle emission factors to be much lower than our calculated housing emission factor of 42.9 kg NH3 animal-1yr-1. An estimate by Battye et al., 2003 of 10.2 kg NH3 animal-1yr-1 even falls outside the range in this study (19.2-55.1 kg NH3 animal-1yr-1). Values of 54.4 and 55.1 kg NH3 animal-1yr-1 found by Flesh et al., 2007 during the warm spring and summer seasons are much greater than an emission factor of 19.3 kg NH3 animal-1yr-1 found by Todd et al., 2007 which measured emissions over the course of a few years. The housing emission factor for beef cows presented in this study might be biased slightly high. Despite the bias, sum emission factors presented in the past appear too low.
Emission factors for swine were calculated to be 4.00, 0.37, and 1.28 kg NH3 animal-1yr-1 for finishing pigs, sows, and farrow-to-finish pigs respectively. The estimated housing emission factors for finishing pigs and sows are lower than the sum emission factors presented in previous studies. Battye et al., 1994 suggested an
30
that found by Battye et al., 2003 of 6.4 kg NH3 animal-1yr-1which used updated US EPA emission estimation methods to develop emission factors. An emission factor of 4.00 kg NH3 animal-1yr-1 from housing alone appears consistent with past findings. An emission factor of 0.37 kg NH3 animal-1yr-1 seen in this study is significantly different than the approximated 16 kg NH3 animal-1yr-1 found by Battye et al., 1994 and Battye et al., 2003. The housing emission factor of 0.37 kg NH3 animal-1yr-1 is only based on measurements made by Harper et al., 2004 in the summer of 1998. More field
measurements are needed to better assess an appropriate housing and total emission factor for sows to use in process based modeling. Finally, a housing emission factor of 1.28 kg NH3 animal-1yr-1 is suggested for pigs that are raised in farrow-to-finish facilities.
Poultry emission factors presented in Battye et al., 1994 and Battye et al., 2003 for broilers and layers are very similar to those found in this study- 0.21 and 0.24 kg NH3 animal-1yr-1 respectively. Emission factors for broilers and layers range from
approximately 0-0.73 kg NH3 animal-1yr-1 becoming greater as the birds get older. Additionally, this paper presents an emission factor of 0.29 kg NH3 animal-1yr-1 for turkeys and 0.36 kg NH3 animal-1yr-1 for roasters.
2.3.1.2 Storage and Treatment Practices
Manure storage practices in the United States include shallow and deep pits, storage tanks, stockpiles, and earthen basins. Common treatment facilities in the United States involve lagoons and digesters (aerobic and anaerobic). Many factors including
31
affect NH3 volatilization from manure storage. Higher temperatures, larger surface areas, and longer storage periods all increase ammonia emissions from liquid and solid manure stored outdoors. Covered tanks and lagoons emit significantly less ammonia into the air than open tanks and lagoons.
Anaerobic lagoons are a common manure storage strategy in the southern United States. In theory, lagoons should have lower nitrogen concentrations due to the settling of solids, volatilization of N-based gases, and dilution. Most studies however suggest that ammonia emissions off the surface of the lagoon are not only significant, they are alarmingly high (Table 2.7). Chamber and micrometeorology (MM) measurement methods are commonly used in the United States to measure ammonia emissions off the surface of the lagoon and produce highly varied results. Emission factors for finishing farms using the chamber method range from 0.53 in the winter to greater than 6.18 g NH3-N m-2 day-1 in the summer. At nearby farrow-to-finish operations Aneja et al., 2000 found that emission factor averages were lower in each season ranging from 0.44 to 5.78 g NH3-N m-2 day-1. Fall measurements in North Carolina using the chamber method averaged out to only 0.08 g NH3-N m-1 day-1 in a 1998 study (Aneja et al., 2001). Micrometeorology methods are more common in the Midwest where a study by Zahn et al., 2001 found emissions to be quite similar in the summer and fall season.
32
µg/s/m2 respectively. Results are similar for manure storage from finishing pigs with manure pack storage units emitting the largest amount of NH3 at 551.0 µg/s/m2. Results for gestating, farrowing, and nursery pig farms are more varied where nursery-to-finishing pig facilities with earthen basin storage units emit an average of 230.0 µg/s/m2.
An emission factor summary for storage and treatment structures in the United States is given in Table 2.9. Swine is the only animal for which an databases could be developed due to a lack of data on storage emissions at dairy, cattle, and poultry farms. Results of this study show that storage facilities at finishing farms emit over 2.82 g NH3-N m-2 day-1, farrow-to-finish farms emit 1.36 g NH3-N m-2 day-1, and farrowing farms emit 2.85 g NH3-N m-2 day-1. An emission factor of approximately 2.13 g NH3 -N m-2 day-1 for all pigs is suggested for estimating ammonia emissions from storage structures.
2.3.1.3 Land Application
Land application is the third key variable used to describe manure management practices for large scale animal operations in models. In Europe, land application of manure accounts for 30-40% of total ammonia emissions into the atmosphere
33
assuming that an emission factor found in Georgia is representative of a farm located in North Carolina. Emission estimates from sprinkler application of manure are tricky because initial emissions from the field are often much higher than emissions hours after application. For example, during the first half hour of sprinkler application of dairy waste, NH3 emissions were measured at 4.06 g NH3-N m2 day-1 and decreased to 1.47 g NH3-N m2 day-1 four hours later averaging 2.59 g NH3-N m2 day-1 over the entire time (Rumburg et al., 2006). Developing an appropriate emissions database for the United States suffers from the lack of studies using meteorological factors, manure characteristics, application techniques, and soil parameters to determine the amount of ammonia lost from land applied manure. Future studies should report the number of times manure is applied to the land each year and express emissions in units of mass NH3-N m-2 day-1 for use in process based modeling.
2.3.2 Ammonia Policy
34
States in the US play a major role in regulating air pollution from stationary sources. In accordance with the CAA, each state has the “primary responsibility for assuring air quality within the entire geographic area comprising such State by submitting an implementation plan for such State which will specify the manner in which national primary and secondary ambient air quality standards will be achieved and maintained” (NRC, 2003). The CAA outlines the basic content of state
implementation plans (SIP) which must assure the “implementation, maintenance, and enforcement” of primary NAAQS standards.
The major environmental law concerning confined animal feeding operations (CAFOs) and animal feeding operations (AFOs) is the Clean Water Act. The Clean Water Act covers AFOs through the National Pollutant Discharge Elimination System (NPDES) program. Facilities that directly discharge to water resources through a discrete ditch or pipe require NPDES permits which specify a level of treatment for each source. NPDES permits for CAFOs involve technology-based effluent limit guidelines for production areas and land receiving manure. The EPA requires states to develop best management practice (BMP) guidelines for CAFOs and the use of
35
lagoons, walled storage facilities, and covered storage tanks. BMPs for application of manure to crop lands and grasslands include incorporation of manure into the soil after spreading, solid-liquid manure separating systems, composting of manure, and injection of manure using sweeps or knives. For nitrogen fertilizer usage BMPs such as
reduction in nitrogen fertilizer, maintaining optimal soil pH, injection of fertilizer into the soil, and crop rotation have been identified (Battye, 2008). Additional legislation allowing federal authorities to react to releases of hazardous substances that endanger public health is addressed in the Comprehensive Environmental Response,
Compensation and Liability Act (CERCLA) enacted in 1980. CERCLA is currently focused on hazardous wastes from industrial plants but ammonia and hydrogen sulfide emissions may soon become subject to notification provisions (US EPA, 2007).
36
management, livestock feeding strategies, reduced emissions from housing systems, reduced emissions during storage, reduced emissions during and after spreading, and reduced emissions from mineral nitrogen fertilizers. Three categories were developed to assess the knowledge and effectiveness of different abatement strategies (1) well researched, considered to be practical, and quantitative data on abatement efficiency on the experimental scale (2) promising but inadequate research data or difficulty in
quantifying abatement efficiency and (3) ineffective or impractical (Webb et al., 2005). In accordance with this protocol, 15 European Union nations including Austria,
Belgium, Denmark, Finland, Former Federal Republic of Germany, Former German Democratic Republic, France, Greece, Ireland, Italy, Luxembourg, Netherlands,
Portugal, Spain, Sweden, and the United Kingdom have reduced agricultural emissions of NH3 by 10.8% from 3413 Gg N yr-1 in 1990 to 3045 Gg N yr-1 in 2005 (EMEP, 2007).
37
animal per day decreased by 62.4% when dietary crude protein was reduced from 220 to 130 g kg-1. Another simple solution includes the addition of certain chemicals to slurry to lessen the volatilization of ammonia. Delaune et al., 2004 observed a 44% reduction in NH3 volatilization when poultry litter was treated with phosphoric acid and a decrease of 62% when alum was added to manure. Alum added to dairy slurry also decreased ammonia volatilization in an experiment conducted by Lefcourt and
38
2.4 Summary
39
Recommendations
Observational data on emissions from animal activities during all aspects of
production is still needed and should be monitored on a continuous annual basis. Data is especially needed concerning emissions from
Dairy and cattle housing
Retention ponds and manure storage
Land application
Information including average temperature (ambient, indoor, outdoor),
facility type, housing type, manure management system, date of study, location, ventilation type, whether the experiment was continuous or not, emission rate, average weight of animal, grow out period, size of the storage structure, TAN concentrations, and other relevant meteorological data should be presented in every future study in order to develop a comprehensive database
The EPA should give guidance on how animal units should be characterized
for the purpose of estimating emissions
Data is needed on the impacts of control strategies and best management
40
2.5 References
Aneja V.P., S.P. Arya, I.C. Rumsey, D-S. Kim, K.S. Bajwa, and C.M. Williams (2008a), Characterizing ammonia emissions from swine farms in eastern North Carolina: Reduction of emissions from water-structures at two candidate superior technologies for waste treatment. Atmos. Environ., 42, 3291-3300.
Aneja, V.P., W.H. Schlesinger, and J.W. Erisman (2008b), Farming pollution. Nature Geosci., 1, 409-411.
Aneja, V.P., S.P. Arya, D.S. Kim, I.C. Rumsey, D. Dickey, L.S. Stefanski, L. Todd, K. Mottus, H.L. Arkinson, H. Semunegus, K. Bajwa, W.P. Robarge, and C.M. Williams (2007), Characterizing ammonia emissions from swine farms in Earth North Carolina -Part I. Conventional lagoon and spray technology for waste treatment. J. Air Waste Manage. Assoc., In Press.
Aneja, V.P., D. Nelson, P. Roelle, and J. Walker (2003), Agricultural ammonia emissions and ammonium concentrations associated with aerosols and precipitation in the southeast United States. J. Geophys. Res., 105, 4152.
Aneja, V.P., B. Bunton, J.T. Walker, and B.P. Malik (2001), Measurement and analysis of atmospheric ammonia emission from anaerobic lagoons, Atmos. Environ., 35, 1949-1958.
Aneja, V.P., J.P. Chauhan, and J.T. Walker (2000), Characterization of atmospheric ammonia emissions from swine waste storage and treatment lagoons, J. Geophys. Res., 105(D9), 11535-11545.
Angel, R., W. Powers, S. Bastyr, W. Wu, and T. Applegate (2006), Dietary
modifications to reduce air emissions from broiler chickens, paper presented at the Workshop on Agricultural Air Quality: State of Science, Potomac, Maryland, 5 -8 June. Arogo, J. P.W. Westerman, A.J. Heber, W.P. Robarge, and J.J. Classen (2006),
Ammonia emissions from animal feeding operations, in Animal Agriculture and Environment: National Center for Manure & Animal Waste Management While Papers, edited by J.M. Rice et al., pp. 41-88, ASABE, St. Joseph, Michigan.
Asman, W.A.H. (1992), Ammonia emissions in Europe: updated emission and emission variations. Report #228471008, National Institute of Public Health and the
Environment. Roskilde, Denmark.
41
and chemical reactions model, and an equilibrium model, Atmos. Environ., 40, S275-S286.
Battye, W. (2008), Personal Communication, Raleigh, North Carolina, March 6, 2008. Battye, W., V.P. Aneja, and P. Roelle (2003), Evaluation and improvement of ammonia emissions inventory, Atmos. Environ., 37, 3873-3883.
Battye, R., W. Battye, C. Overcash, and S. Fudge (1994), Development and selection of ammonia emission factors. Report #68-D3-0034, US Environmental Protection
Agency, Washington, D.C.
Blunden, J. and V.P. Aneja (2007), Characterizing ammonia and hydrogen sulfide emissions from a swine waste treatment lagoon in North Carolina, Atmos. Environ., In Press, doi: 10.1016/j.atmosenv.2007.06.040.
Blunden, J., V.P. Aneja, and P.W. Westerman (2007), Measurement and analysis of ammonia and hydrogen sulfide emissions from a mechanically ventilated swine confinement building in North Carolina, Atmos. Environ., In Press, doi:
10.1016/j.atmosenv.2007.02.026.
Bouwman, A. F., L. J. M. Boumans, and N. H. Batjes (2002), Estimation of global NH3 volatilization loss from synthetic fertilizers and animal manure applied to arable lands and grasslands, Global Biogeochem. Cycles, 16(2), 1024, doi:10.1029/2000GB001389. Burns, R., H. Xin, R. Gates, H. Li, S. Hoff, L. Moody, D. Overhaults, and J. Earnest (2007), Tyson Broiler Ammonia Emission Monitoring Project: Final Report.
Cassel, T., L. Ashbaugh, R. Flocchini, and D. Meyer (2005a), Ammonia flux from open-lot dairies: development of measurement methodology and emission factors, J. Air & Waste Manage. Assoc., 55, 816-825.
Cassel, T., L. Ashbaugh, R. Flocchini, and D. Meyer (2005b), Ammonia emission factors for open-lot dairies: direct measurements and estimation by nitrogen intake, J. Air & Waste Manage. Assoc., 55, 826-833.
42
Delaune, P.B., P.A. Moore Jr., T.C. Daniel, and J.L. Lemunyon (2004), Effect of chemical and microbial amendments on ammonia volatilization from composting poultry litter, J. Environ. Qual., 33, 728-734.
Doorn, M.R.J., D.F. Natschke, S.A. Thorneloe, and J. Southerland (2002),
Development of an emission factor for ammonia emissions from US swine farms based on field tests and application of a mass balance method, Atmos. Environ., 36(36-37), 5619-5625.
EMEP (2007), http://webdab.emep.int/scaled.html.Expert Emissions Used in EMEP Models.
FAOSTAT (2007), http://faostat.fao.org/site/339/default.aspx, Food and Agriculture Organization of the United Nations.
Flesch, T.K., J.D. Wilson, L.A. Harper, R.W. Todd, and N.A. Cole (2007), Determining ammonia emissions from a cattle feedlot with an inverse dispersion technique, Agr. Forest Meteorol., 144(1-2), 139-155.
Gay, S.W., (2005), http://www.ext.vt.edu/pubs/bse/442-110/442-110.html, Ammonia emissions and animal agriculture, Publication #442-110, Blacksburg, Virginia. Gay, S.W., D.R. Schmidt, C.J. Clanton, K.A. Janni, L.D. Jacobson, and S. Weisberg (2003),
Odor, total reduced sulfur, and ammonia emissions from animal housing facilities and manure storage units in Minnesota, App. Eng. Agric., 19(3), 347-360.
Gilliland, A.B., R.L. Dennis, S.J. Roselle, and T.E. Pierce (2003), Seasonal NH3 emission estimates for the eastern United States based on ammonium wet
concentrations and an inverse modeling method, J. Geophys. Res., 108(D15), 4477, doi:10.1029/2002JD003063.
Harper, L.A., R.R. Sharpe, and J.D. Simmons (2004), Ammonia Emissions from swine houses in the Southeastern United States, J. Environ. Qual., 33, 449-457.
Harris, D.B., R.C. Shores, and L.G. Jones (2001), Ammonia emission factors from swine finishing operations, Environmental Protection Agency Office of Research and Development, Research Triangle Park, North Carolina.
43
Hayes, E.T., A.B.G. Leek, T.P. Curran, V.A. Dodd, O.T. Carton, V.E. Baettie, and J.V. O’Doherty (2004), The influence of diet crude protein level on odour and ammonia emissions from finishing pig houses, Bioresource Technol., 91, 309-315.
Heber, A.J., J.Q. Ni, T.T. Lim, C.A. Diehl, A.L. Sutton, R.K. Duggirala, B.L. Haymore, D.T. Kelly, V.I. Adamchuk (2000), Effect of a manure additive on ammonia emission from swine finishing buildings, T. ASABE, 43(6), 1895-1902.
Jacobson, L.D., A.J. Heber, S.J. Hoff, Y. Zhang, D.B. Beasley, J.A. Koziel, and B.P. Hetchler (2006), Aerial pollutants emissions from confined animal buildings, paper presented at the Workshop on Agricultural Air Quality: State of Science, Potomac, Maryland, 5-8 June.
Jacobson, L.D., B.P. Hetchler, L.J. Johnston, and V.J. Johnson (2004), Gas and PM emissions from deep-bedded and slatted floor farrowing buildings, paper presented at ASAE/CSAE Annual International Meeting, Ontario, Canada, 1-4 August.
Jacobson, L.D., D.R. Schmidt, J.K. Lake, and V.J. Johnson (2003), Ammonia,
hydrogen sulfide, odor, and PM10 emissions from deep-bedded hoop and curtain-sided pig finishing barns in Minnesota, paper presented Air Pollution from Agricultural Operations III Conference, Research Triangle Park, North Carolina, October.
Keener, H.M., D.L. Elwell, and D. Grande (2002), NH3 emissions and N-balance for a 1.6 million caged layer facility: manure belt/composting vs. deep pit operation, T. ASABE, 45(6), 1977-1984.
Koerkamp, P.W.G., J.H.M. Metz, G.H. Uenk, V.R. Phillips, M.R. Holden, R.W. Sneath, J.L. Short, R.P. White, J. Hartung, J. Seedorf, K.H. Linkert, S. Pedersen, H. Takai, J.O. Johnsen, and C.M. Wathes (1998), Concentrations and emissions of ammonia in livestock buildings in Northern Europe, J. agric. Engng. Res., 70, 79-95. Lacey, R.E., J.S. Redwine, and C.B. Parnell Jr. (2003), Particulate matter and ammonia emission factors for tunnel-ventilated broiler production houses in the southern U.S., T. ASABE, 46(4), 1203-1214.
Lefcourt, A.M. and J.J. Meisinger (2001). Effect of adding alum or zeolite to dairy slurry on ammonia volatilization and chemical composition. J. Dairy Sci., 84, 1814-1821.
44
on Air Pollution from Agricultural Operations, Research Triangle Park, North Carolina, 12-15 October.
Lim, T.T., A.J. Heber, J.Q. Ni, D.C. Kendell, and B.T. Richert (2004), Effects of manure removal strategies on odor and gas emissions from swine finishing, T. ASABE,
47(6), 2041-2050.
Lim, T.T., A.J. Heber, J.Q. Ni, A.L. Sutton, and P. Shao (2003), Odor and gas release from anaerobic treatment lagoons for swine manure, J. Environ. Qual., 32(2), 406-416. Misselbrook, T.H., T.J. van der Weerden, B.F. Pain, S.C. Jarvis, B.J. Chambers, K.A. Smith, V.R. Phillips, and T.G.M. Demmers (2000), Ammonia emission factors for UK agriculture, Atmos. Environ., 34, 871-880.
Moreira, V.R. (2006), Estimating nitrogen loss from livestock and poultry manure using nitrogen to phosphorus ratio, paper presented at the Workshop on Agricultural Air Quality: State of Science, Potomac, Maryland, 5-8 June.
Mukhtar, S., A. Mutlu, S. Capareda, R. Lacey, B. Shaw, and C. Parnell (2006),
Seasonal and spatial variations of ammonia emissions from an open-lot dairy operation, paper presented at the Workshop on Agricultural Air Quality: State of Science,
Potomac, Maryland, 5-8 June.
NRC (2003), Air Emissions from Animal Feeding Operations: Current Knowledge, Future Needs, The National Academies Press, Washington, D.C.
Parbst, K.E., K.M. Keener, A.J. Heber, and J.Q. Ni (2000), Comparison between low-end discrete high-low-end continuous measurements of air quality in swine buildings, App. Eng. Agric., 16(6), 693-699.
Pinder, R.W., R. Strader, C.I. Davidson, and P.J. Adams (2004), A temporally and spatially resolved ammonia emission inventory for dairy cows in the United States,
Atmos. Environ., 38(23), 3747-3756.
Portegoie, S., J.Y. Dourmad, J. Martinez, and Y. Lebreton (2004), Effect of lowering dietary crude protein on nitrogen excretion, manure composition and ammonia emission from fattening pigs, Livest. Prod. Sci., 91, 45-55.
45
Rumburg, B., G.H. Mount, J. Filipy, B. Lamb, H. Westberg, D. Yonge, R. Kincaid, and K. Johnson (2007a), Measurement and modeling of atmospheric flux of ammonia from dairy milking cow housing, Atmos. Environ., In press,
doi:10.1016/j.atmosenv.2007.05.042.
Rumburg, B., G.H. Mount, D. Yonge, B. Lamb, H. Westberg, M. Neger, J. Filipy, R. Kincaid, and K. Johnson (2007b), Measurements and modeling of atmospheric flux of ammonia from an anaerobic dairy waste lagoon, Atmos. Environ., In press,
doi:10.1016/j.atmosenv.2007.02.046.
Rumburg, B., G.H. Mount, D. Yonge, B. Lamb, H. Westberg, J. Filipy, J. Bays, R. Kincaid, and
K. Johnson (2006), Atmospheric flux of ammonia from sprinkler application of dairy waste, Atmos. Environ., 40, 7246-7258.
Schmidt, D.R., L.D. Jacobson, and K.A. Janni (2002), Continuous monitoring of ammonia, hydrogen sulfide and dust emissions from swine, dairy and poultry barns, paper presented at ASAE Annual International Meeting/CIGR World Congress, Chicago, Illinois, 28-31 July.
Siefert, R.L. and J.R. Scudlark (2006), A comparison of ammonia emission rates between a tunnel and sidewall ventilated broiler house, paper presented at the
Workshop on Agricultural Air Quality: State of Science, Potomac, Maryland, 5 -8 June. Siefert, R.L., J.R. Scudlark, A.G. Potter, K.A. Simonsen, and K.B. Savidge (2004), Characterization of atmospheric ammonia emissions from a commercial chicken house on the Delmarva Peninsula, Environ. Sci. Technol., 38, 2769-2778.
Stowell, R.R., H. Keener, P.R. Goodrich, and S. Foster (2002), Gas and odor emissions from high-rise and deep-pit swine finishing facilities, paper presented at ASAE Annual International Meeting/ CIGR World Congress, Chicago, Illinois, 28-31 July.
Todd, R.W., N.A. Cole, and R.N. Clark (2007), Ammonia emissions from open lot beef cattle feedyards on the Southern High Plains, paper presented at The 16th Annual International Emission Inventory Conference- Emissions Inventories, Raleigh, North Carolina, 14-17 May.
46
UNECE (2007), Protocol to Abate Acidification, Eutrophication, and Ground Level Ozone, http://www.unece.org/env/lrtap/multi_h1.htm, UN Economic Commission for Europe, Switzerland.
USDA ERS (2007), Farm Income and Costs: Farm Sector Income Forecast, http://www.ers.usda.gov/briefing/farmincome/data/cr_t3.htm, United States Department of Agriculture Economic Research Service, Washington D.C.
US EPA (2007), Clean Air Act, http://www.epa.gov/air/oaq_caa.html/, United States Environmental Protection Agency, Washington D.C.
US EPA (2005), National Emissions Inventory,
http://www.epa.gov/ttn/chief/net/2002inventory.html, United States Environmental Protection Agency, Washington D.C.
US EPA (2001), Emissions from Animal Feeding Operations: Draft,
http://www.epa.gov/ttn/chief/ap42/ch09/draft/draftanimalfeed.pdf, United States Environmental Protection Agency, Washington D.C.
Walker, J.T., W.P. Robarge, A. Shendrikar, and H. Kimball (2005), Inorganic PM2.5 at a U.S. agricultural site, Environ. Pollut., 139, 258-271.
Wang, Z., R. Zhang, J. Fadel, T. Rumsey, J. Arogo, H. Xin, Y. Liang, G. Mansell, S. Shepard (2005), http://www.conceptmodel.org/nh3/nh3_index.html, Development of an improved process based ammonia emission model for agricultural sources, Process based ammonia farm model data documentation, Lake Michigan Air Directors Consortium, Des Plaines, Illinois.
Warneck, P. (2000), Chemistry of the Natural Atmosphere, 2nd ed., Academic Press, San Diego, California.
Webb, J., H. Menzi, B.F. Pain, T.H. Misselbrook, U. Dammgen, H. Hendriks, and H. Dohler (2005), Managing ammonia emissions from livestock production in Europe,
Environ. Pollut., 135, 399-406.
Wheeler, E.F., K.D. Casey, R.S. Gates, H. Xin, J.L. Zajaczkowski, P.A. Topper, Y. Liang, A.J. Pescatore (2006), Ammonia emissions from twelve U.S. broiler chicken houses, T. ASABE, 49(5), 1495-1512.
47
Yang, P., J.C. Lorimor, and H. Xin (2000), Nitrogen losses from laying hen manure in commercial high-rise layer facilities, T. ASABE, 43(6), 1771-1780.
Zhan, J., A.E. Tung, B.A. Roberts, and J.A. Hatfield (2001), Abatement of ammonia and hydrogen sulfide emissions from a swine lagoon using a polymer biocover, J. Air & Waste Manage. Assoc., 51, 562-573.
48
Table 2.1. Ammonia emission factors from agriculture in the US. Animal Agriculture Emission factor (kg NH3 animal
-1
yr-1)
Animal US EPA, 2005 Battye et al., 2003 Battye et al., 1994
Dairy cow 38.1 28 40
Beef cow 10.2 27 (steers)
On feed 20.8
Grazing 4.3
Pigs 6.5
Sow 16.4 16
Finishing pig
6.4 7
Poultry .27
Laying hen 0.31 0.31
Broiler 0.28 0.17
Sheep 3.4 1.34 3.4
Horses 12 8.0 12
Crop Agriculture Emission factor (kg NH3/Mg N)
Fertilizer Aneja et al., 2003 US EPA
Battye et al., 1994
N-P-K 48 48
Nitrogen solutions
30 30
Ammonium phosphates
48 48
Anhydrous NH3
12 12
Urea 182 182
Ammonium nitrate
25 25
Other straight nitrogen
30 30
Ammonium sulfate
97 97
Aqua NH3 12 12
Ammonium thiosulfate