University of Windsor University of Windsor
Scholarship at UWindsor
Scholarship at UWindsor
Electronic Theses and Dissertations Theses, Dissertations, and Major Papers
2014
Investigation of Laser Clad Bead Geometry to Process Parameter
Investigation of Laser Clad Bead Geometry to Process Parameter
Settings for Effective Parameter Selection, Simulation, and
Settings for Effective Parameter Selection, Simulation, and
Optimization
Optimization
Kush Aggarwal University of Windsor
Follow this and additional works at: https://scholar.uwindsor.ca/etd
Recommended Citation Recommended Citation
Aggarwal, Kush, "Investigation of Laser Clad Bead Geometry to Process Parameter Settings for Effective Parameter Selection, Simulation, and Optimization" (2014). Electronic Theses and Dissertations. 5223. https://scholar.uwindsor.ca/etd/5223
This online database contains the full-text of PhD dissertations and Masters’ theses of University of Windsor students from 1954 forward. These documents are made available for personal study and research purposes only, in accordance with the Canadian Copyright Act and the Creative Commons license—CC BY-NC-ND (Attribution, Non-Commercial, No Derivative Works). Under this license, works must always be attributed to the copyright holder (original author), cannot be used for any commercial purposes, and may not be altered. Any other use would require the permission of the copyright holder. Students may inquire about withdrawing their dissertation and/or thesis from this database. For additional inquiries, please contact the repository administrator via email
Investigation of Laser Clad Bead Geometry to Process Parameter Settings for Effective Parameter Selection, Simulation, and Optimization
By
Kush Aggarwal
A Thesis
Submitted to the Faculty of Graduate Studies
through the Department of Mechanical, Automotive and Materials Engineering in Partial Fulfillment of the Requirements for
the Degree of Master of Applier Science at the University of Windsor
Windsor, Ontario, Canada
2014
Investigation of Laser Clad Bead Geometry to Process Parameter Settings for Effective Parameter Selection, Simulation, and Optimization
By
Kush Aggarwal
APPROVED BY:
______________________________________________ Dr. Z. Pasek
Industrial and Manufacturing Systems Engineering
______________________________________________ Dr. B. Minaker
Mechanical, Automotive and Materials Engineering
______________________________________________ Dr. R. J. Urbanic, Advisor
Mechanical, Automotive and Materials Engineering
iii
DECLARATION OF ORIGINALITY
I. Co-Authorship Declaration
I hereby declare that this thesis incorporates material that is result of joint research, as follows:
This thesis incorporates the outcome of a joint research undertaken in collaboration with Kush Aggarwal, Luv Aggarwal and Syed Saqib under the supervision of Professor, Dr. Ruth Jill Urbanic. The collaboration with Luv Aggarwal and Dr. Ruth Jill Urbanic is covered under partial sections of Chapter 4 & 5; the collaboration with Syed Saqib and Dr. Jill Ruth Urbanic is covered under partial sections of Chapter 5 and Chapter 6. In all cases, the key ideas, primary contributions, experimental designs, data analysis and interpretation, were performed by the author. The contribution of co-authors was primarily through the provision of comments, suggestions and recommendations.
I am aware of the University of Windsor Senate Policy on Authorship and I certify that I have properly acknowledged the contribution of other researchers to my thesis and have obtained written permission from each of the co-author(s) to include the above material(s) in my thesis.
I certify that with the above qualification, this thesis, and the research to which it refers is the product of my own work.
II. Declaration of Previous Publication
This thesis includes excerpts, citations and partial sections from the papers that have been previously published/submitted for publication in peer reviewed journals, as follows:
Thesis Chapter Publication title/full citation Publication status
Chapter 6 Aggarwal, K., Urbanic, R., and Aggarwal, L., "A Methodology for Investigating and Modelling Laser Clad Bead Geometry and Process Parameter Relationships," SAE Int. J. Mater. Manf. 7(2):2014, doi: 10.4271/2014-01-0737.
iv
Chapter 6 & 7 Saqib, S., Urbanic, R. J., & Aggarwal, K. (2014). Analysis of layer morphology in additive manufacturing process to develop functional parts by using laser cladding method. The 47th CIRP Conference on Manufacturing Systems. Windsor: Elsevier Ltd.
Published
Chapter 5, 6 & 7 Aggarwal, K., Urbanic, R. J., & Saqib, S. (2014). Analysis of laser cladding bead morphology for developing additive manufacturing travel paths. Rapid Prototyping Journal. Emerald Group Publishing Limited.
Accepted for publication
Chapter 7 Aggarwal, K., Aggarwal, L., & Urbanic, R. J. (2014). Identifying relative importance of input parameter(s) in developing predictive models for laser cladding process. International Mechanical Engineering Congress & Exposition. Montreal, Canada: American Society of Mechanical Engineers (ASME).
Accepted for publication
I certify that I have obtained a written permission from the copyright owner(s) to include the above published material(s) in my thesis in appendix A. I certify that the above material describes work completed during my registration as a graduate student at the University of Windsor.
I declare that, to the best of my knowledge, my thesis does not infringe upon anyone’s copyright nor violate any proprietary rights. Any ideas, techniques, quotations, or any other material from the work of other people included in my thesis, published or otherwise, are fully acknowledged in accordance with the standard referencing practices. Furthermore, to the extent that I have included copyrighted material that surpasses the bounds of fair dealing within the meaning of the Canada Copyright Act, I certify that I have obtained a written permission from the copyright owner(s) to include such material(s) in my thesis.
v
ABSTRACT
Laser cladding is an additive manufacturing technique involving deposition of
powdered clad metal in successive 2D layers onto a substrate thereby creating
surface coatings with enhanced material properties. Process and shape parameters
contribute in defining the geometry of the clad bead; however, due to the highly
coupled nature of the process, it is difficult to determine the relationship between
parameters. This research predicts such parameters through development of a
cognitive artificial intelligence system using artificial neural networks. A robust
experimentation design process applying response surface methodology technique
is adopted to collect the bead geometry data for various process configurations.
Furthermore, the research identifies the extent of contribution of each factor and the
impact of their interactions on the model output through ANOVA and sensitivity
analysis. Lastly, a K-mean clustering algorithm is incorporated to identify optimal
number of clusters present in the collected dataset on the basis of bead shape
vi
DEDICATION
To my parents,
for their unconditional love, endless support, and encouragement.
“A happy family is but an earlier heaven”
vii
ACKNOWLEDGEMENTS
Foremost, I would like to acknowledge my gratitude and render my warmest appreciations to my advisor and mentor Dr. Ruth Jill Urbanic. A special recognition for her patient guidance, encouragement, enthusiasm, motivation and immense knowledge that she has provided me throughout the years.
I would like to thank the thesis committee members, Dr. Bruce Minaker and Dr. Zbignew Pasek for giving me the honor of being a part of my research committee and allocating valuable time towards my research. Their expert advice, guidance and support during the course of my time as a university scholar contributed a huge encouragement towards this project.
I owe a debt of gratitude to Dr. Jennifer Johrendt for teaching the fundamentals of developing a cognitive artificial intelligence system with use of neural networks. Also, her invaluable assistance and expert knowledge provided a treasured contribution to this research.
I would like to thank Ontario Center of Excellence (OCE) for financially supporting this research project through the Collaborative Research funding program. I would also like to thank the Industry partner for the time and resources endeavored towards this research project.
I would like to thank the University of Windsor for my exceptional education in the field of engineering and providing me with a wonderful platform to shine and showcase my achievements. Also, I would like to acknowledge all my friends who provided me a form of much needed escape from my studies; to keep things in prospective. A special acknowledgement to Avneet Sekhon for helping me edit my thesis work and providing me with constant encouragement to reach my goals.
viii
TABLE OF CONTENTS
DECLARATION OF ORIGINALITY ... iii
ABSTRACT ... v
DEDICATION... vi
ACKNOWLEDGEMENTS ... vii
LIST OF TABLES ... xi
LIST OF FIGURES ... xiii
LIST OF APPENDICES ... xviii
LIST OF ABBREVIATIONS/SYMBOLS ... xix
CHAPTER 1 INTRODUCTION TO ADDITIVE MANUFACTURING ... 1
1.1 Background ... 1
1.1.1 Comparison between Additive and Subtractive Manufacturing ... 2
1.1.2 Additive Manufacturing Process ... 3
1.1.3 Additive Manufacturing Applications and Divisions ... 4
1.1.4 Types of Additive Manufacturing Processes ... 6
1.1.5 Advantages of Additive Manufacturing ... 7
1.2 Motivation, Objectives, and Limitations ... 9
1.2.1 Motivation ... 9
1.2.2 Thesis Objective ... 11
1.2.3 Limitations ... 13
CHAPTER 2 LITERATURE REVIEW ... 15
2.1 Experimentation ... 15
2.2 Artificial Intelligence system(s) ... 18
2.3 Quadratic Model and Optimization ... 21
2.4 Classification ... 23
ix
3.1 Background ... 25
3.2 Essential Elements of the Laser Cladding Process ... 26
3.2.1 Process Types ... 26
3.2.2 Powder Feeder Types and Principles ... 27
3.2.3 Types of Dispensing Nozzles ... 28
3.2.4 Types of Lasers Systems ... 29
3.3 Laser Cladding Apparatus ... 34
3.4 Laser Cladding Process ... 37
3.5 Geometric Properties ... 41
3.5.1 Physical Shape Properties for Single Pass and Overlaps ... 41
3.5.2 Dilution ... 44
CHAPTER 4 RESEARCH METHODOLOGY ... 47
4.1 Proposed Research Methodology ... 47
4.2 Proposed Predictive Model Methodology ... 50
CHAPTER 5 DESIGN OF EXPERIMENTS ... 52
5.1 Response Surface Methodology ... 52
5.2 Design Properties for Selecting a Design Strategy ... 54
5.3 Proposed Experimental Designs ... 56
5.3.1 Full- Factorial Design ... 56
5.3.2 Central Composite Design ... 58
5.4 Design Matrix- Setup ... 61
5.5 Assumptions and Equipment Requirements ... 67
CHAPTER 6 A COGNITIVE ARTIFICIAL INTELLIGENCE SYSTEM ... 69
6.1 Background ... 69
6.1.1 Capability- Neural Network ... 70
6.2 Network Essentials ... 74
6.2.1 Epoch ... 74
6.2.2 Training methods ... 74
6.2.3 Degrees of Freedom ... 77
6.2.4 Activation Functions ... 77
x
6.2.6 Network Layers ... 80
6.3 Normalization ... 82
6.4 Network Training ... 84
6.4.1 Division of Data Points ... 85
6.5 Network Architecture for Single Pass 420 Steel ... 86
6.5.1 Fitness and Accuracy ... 87
6.5.2 Simulation and Verification ... 96
6.5.3 Results ... 97
6.5.4 Case Study ... 98
6.6 Network Architecture for Overlap Configurations 420 Steel ... 101
6.6.1 Results ... 104
6.6.2 Case Study ... 107
6.7 Summary ... 109
CHAPTER 7 SIGNIFICANCE OF MANUFACTURING PARAMETERS 111 7.1 Analytical Model Development ... 111
7.2 Significant Factor Assessment Techniques ... 114
7.2.1 Sensitivity Analysis ... 115
7.2.2 Analysis of Variance ... 119
7.2.3 Validation of ANOVA ... 127
7.3 Contour and Surface Plots ... 129
7.4 Single and Multi Variable Optimization ... 134
CHAPTER 8 CLASSIFICATION OF THE LASER CLADDING DATASET ... 140
8.1 K- Mean Clustering... 141
8.2 Optimal K Clusters ... 147
CHAPTER 9 DISCUSSION... 155
CHAPTER 10 CONCLUSIONS ... 157
CHAPTER 11 FUTURE WORK ... 159
REFERENCES/BIBLIOGRAPHY ... 161
xi
LIST OF TABLES
Table 1: Types of layered manufacturing technologies with raw materials ... 7
Table 2: Composition of the 420 steel clad powder ... 14
Table 3: Various Properties for a clad bead ... 40
Table 4: Comparison between full factorial and central composite design ... 61
Table 5: Design matrix for the laser cladding process ... 62
Table 6: Experimental configurations for sample collection ... 65
Table 7: Constant factors for the laser cladding process ... 67
Table 8: Division of data for the single pass 420 steel forward networks ... 86
Table 9: Network results for the single pass 420 steel forward network ... 92
Table 10: Absolute and relative error values for the single pass forward network 95 Table 11: Boundary conditions for the shape parameters ... 96
Table 12: Simulation data for the single pass 420 steel backward network ... 97
Table 13: Error analysis for the single pass 420 steel neural networks ... 97
Table 14: Case study-1 results ... 100
Table 15: Case study-2 results ... 101
Table 16: Error analysis for the overlap passes for forward networks ... 105
Table 17: Error analysis for the overlap passes for backward networks ... 106
Table 18: Case study-3 results ... 108
Table 19: Case study-4 results ... 109
Table 20: Most significant linear factors - sensitivity vs ANOVA ... 114
Table 21: Sensitivity ratios for clamping technique and sensitivity index ... 116
Table 22: Analysis of variance for the bead width ... 121
Table 23: Analysis of variance for the bead reinforcement height ... 123
Table 24: Analysis of variance for the bead penetration ... 124
Table 25: Analysis of variance for the bead percentage dilution ... 125
Table 26: Summary of significant factors through ANOVA analysis ... 127
Table 27: Statistical summary of ANOVA analysis for model verification ... 128
Table 28: Constant factors for generating contour and surface plots ... 130
Table 29: Legend for contour & surface plots for the percentage dilution ... 132
xii
Table 31: A summary of centroid distances for (k=5) clusters ... 143
Table 32: A summary of intra-cluster distances for (k=5) clusters ... 144
Table 33: Standardization table for shape parameters (K=5) ... 146
Table 34: Statistical summary for (k=10) optimal clusters ... 149
Table 35: A summary of centroid distances for (k=10) optimal clusters ... 149
Table 36: A summary of intra-cluster distances for (k=10) clusters ... 150
Table 37: Standardization table for shape parameters (K=10) ... 154
Table 38: Analysis of variance results for the 40% overlap configurations ... 213
Table 39: Most significant factors for the 40% overlap configurations ... 219
Table 40: Most significant factors for the 50% overlap configurations ... 219
xiii
LIST OF FIGURES
Figure 1: Additive manufacturing prototypes- (A) FDM and (B) laser cladding
operations ... 2
Figure 2: Subtracting manufacturing processes- (A) milling [5] and (B) lathe [6] ... 3
Figure 3: Layered manufacturing division according to sectors adapted from [9] 5 Figure 4: Layered manufacturing division according to application adapted from [10] ... 6
Figure 5: Complex additive manufacturing specimen [11] ... 8
Figure 6: Laser cladding operation- (A) single pass, (B) overlap pass, and (C) 3D part [4] – designer Mr. Syed Saqib... 10
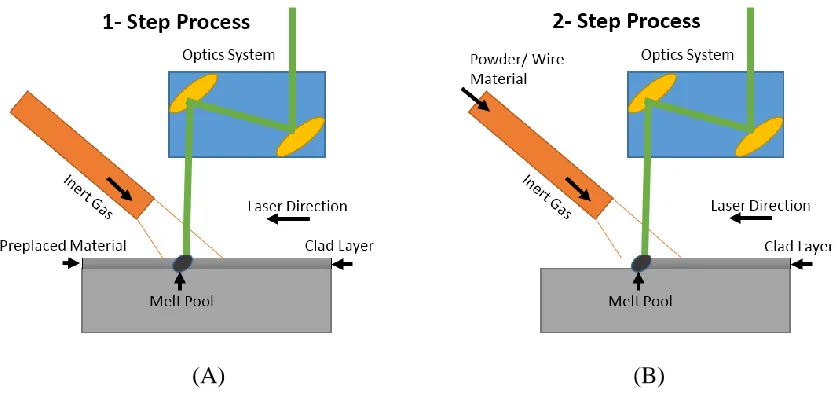
Figure 7: Laser cladding process- (A) 1-step and (B) 2-step ... 27
Figure 8: Powder supply nozzle- (A) co-axial and (B) lateral ... 29
Figure 9: Applications of laser systems- (A) year 2005 and (B) year 2008... 30
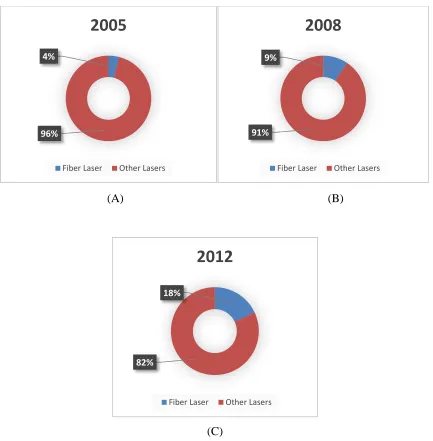
Figure 10: Application of fiber laser- (A) year 2005, (B) year 2008 and (C) year 2012 ... 31
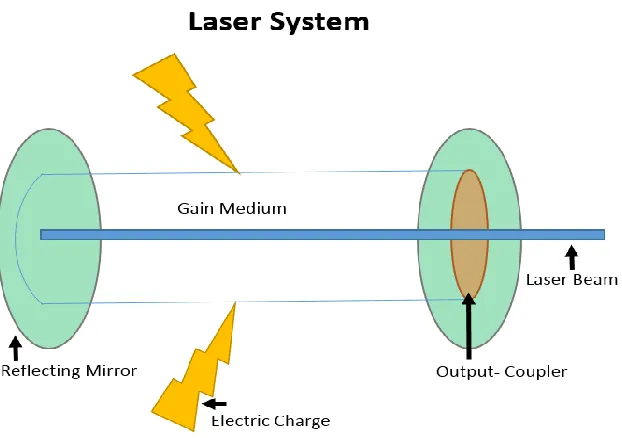
Figure 11: Fiber laser system- schematic diagram ... 32
Figure 12: Semi-conductor laser system- schematic diagram ... 33
Figure 13: Components of a laser system ... 34
Figure 14: Laser cladding apparatus setup – real time [4] ... 36
Figure 15: Laser cladding apparatus- schematic view ... 37
Figure 16: Laser cladding- (A) process and (B) melt pool formation ... 39
Figure 17: Clad bead generation- (A) single pass and (B) overlap pass [4] ... 44
Figure 18: Clad bead geometry ... 45
Figure 19: Percentage dilution calculation method ... 46
Figure 20: Proposed research methodology ... 49
Figure 21: A methodology to development of artificial intelligence system ... 50
Figure 22: Full factorial design with 3 factors and 3 levels ... 57
Figure 23: Fractional factorial orientations ... 58
Figure 24: A central composite design demonstration ... 60
Figure 25: Central composite design specifications ... 65
xiv
Figure 27: Function approximation graph, adapted from [76] ... 71
Figure 28: Classification graphs- (A) data and (B) signal, adapted from [76].... 72
Figure 29: Unsupervised clustering graph, adapted from [76]... 73
Figure 30: Forecasting graph, adapted from [76] ... 73
Figure 31: Example- by- example training, adapted from [76]... 75
Figure 32: Batch training, adapted from [76] ... 76
Figure 33: Graphical representation of tan sigmoid function ... 78
Figure 34: Graphical representation of log sigmoid function ... 78
Figure 35: Graphical representation of linear function ... 79
Figure 36: A schematic diagram of artificial neural network ... 81
Figure 37: Neural network architecture- forward network 420 steel single pass 87 Figure 38: Neural network architecture- backward network 420 steel single pass ... 87
Figure 39: Performance plot for the single pass forward network ... 88
Figure 40: Training state plot for the single pass forward network ... 89
Figure 41: Training progress view for the single pass forward network ... 90
Figure 42: An error histogram for the single pass forward network ... 90
Figure 43: Overall regression plot for the single pass forward network ... 91
Figure 44: Residual error plot for the bead width for a single pass 420 steel forward network ... 93
Figure 45: Residual error plot of the bead reinforcement height for a single pass 420 steel forward Network ... 93
Figure 46: Residual error plot of bead penetration for a single pass 420 steel forward network ... 94
Figure 47: Residual error plot of bead percentage dilution for a single pass 420 steel forward network ... 94
Figure 48: Single pass 420 steel- (A) case study 1 and (B) case study 2 ... 99
Figure 49: 40% forward overlap configuration neural network ... 101
Figure 50: 50% forward overlap configuration neural network ... 102
Figure 51: 60% forward overlap configuration neural network ... 102
Figure 52: 40% backward overlap configuration neural network ... 102
xv
Figure 54: 60% backward overlap configuration neural network ... 103
Figure 55: Residual errors for 40% forward overlap configuration network .... 104
Figure 56: Single pass 420 steel- (A) case study 3 and (B) case study 4 ... 107
Figure 57: Summary of artificial intelligence system developed in MATLAB 110 Figure 58: Sensitivity analysis comparison for the feed rate ... 117
Figure 59: Sensitivity analysis comparison for the power ... 117
Figure 60: Sensitivity analysis comparison for the laser speed ... 118
Figure 61: Sensitivity analysis comparison for the focal Length of the lens .... 118
Figure 62: Sensitivity analysis comparison for the contact tip to work-piece distance ... 119
Figure 63: Contour plots for the percentage dilution objective function ... 132
Figure 64: Surface plots for the percentage dilution objective function ... 134
Figure 65: Single objective optimization to minimize percentage dilution ... 136
Figure 66: Single objective optimization to maximize width ... 136
Figure 67: Single objective optimization to minimize penetration ... 137
Figure 68: Single objective optimization to maximize reinforcement height ... 138
Figure 69: Multiple objective optimization representation ... 139
Figure 70: K-mean clustering approach- schematic diagram... 141
Figure 71: Silhouette plot for (k=5) clusters ... 144
Figure 72: Dendrogram plot for (k=5) clusters ... 146
Figure 73: Calinski- Harbasz Scree Plot ... 148
Figure 74: Graphical representation of the optimal (k=10) clusters ... 152
Figure 75: Silhouette plot for (k=10) optimal clusters ... 153
Figure 76: Dendrogram plot for (k=10) optimal clusters ... 153
Figure 77: A 3-dimensional part generation by laser cladding operation [4] ... 160
Figure 78: Training results for the single pass forward network ... 176
Figure 79: Training output vs network output plots for the single pass 420 steel forward network ... 177
Figure 80: Test output vs predicted output plots for the single pass forward network ... 178
xvi
Figure 82: Training output vs network output plots for the single pass 420 steel backward network ... 181
Figure 83: Test output vs predicted output plots for the single pass backward network ... 182
Figure 84: Training results for the 40% overlap pass forward network... 184
Figure 85: Training output vs network output plots for the 40% overlap pass forward network ... 186
Figure 86: Test output vs predicted output plots for the 40% overlap pass
forward network ... 188
Figure 87: Training results for the 50% overlap pass forward network... 190
Figure 88: Training output vs network output plots for the 50% overlap pass forward network ... 192
Figure 89: Test output vs predicted output plots for the 50% overlap pass
forward network ... 194
Figure 90: Training results for the 60% overlap pass forward network... 196
Figure 91: Training output vs network output plots for the 60% overlap pass forward network ... 198
Figure 92: Test output vs predicted output plots for the 60% overlap pass
forward network ... 200
Figure 93: Training results for the 40% overlap pass backward network ... 202
Figure 94: Training output vs network output plots for the 40% overlap pass backward network ... 203
Figure 95: Test output vs predicted output plots for the 40% overlap pass
backward network ... 204
Figure 96: Training results for the 50% overlap pass backward network ... 206
Figure 97: Training output vs network output plots for the 50% overlap pass backward network ... 207
Figure 98: Test output vs predicted output plots for the 50% overlap pass
backward network ... 208
Figure 99: Training results for the 60% overlap pass backward network ... 210
Figure 100: Training output vs network output plots for the 60% overlap pass backward network ... 211
xvii
Figure 102: Contour plots: percentage dilution for 40% overlap pass ... 221
Figure 103: Surface plots: percentage dilution for 40% overlap pass... 223
Figure 104: Multiple-objective optimization plot for 40% overlap pass ... 224
Figure 105: Bead shapes (A-E) for k=5 clusters ... 225
xviii
LIST OF APPENDICES
Appendix A: Published papers- acceptance letters ... 170
Appendix B: Single pass forward network results ... 175
Appendix C: Single pass backward network results ... 179
Appendix D: 40% overlap configuration forward network results ... 183
Appendix E: 50% overlap configuration forward network results ... 189
Appendix F: 60% overlap configuration forward network results ... 195
Appendix G: 40% overlap configuration backward network results ... 201
Appendix H: 50% overlap configuration backward network results ... 205
Appendix I: 60% overlap configuration backward network results ... 209
Appendix J: Significant factors overlap configuration ... 213
Appendix K: Surface, contour & optimization results: overlap configuration . 221 Appendix L: Cluster (K=5) - shape analysis ... 225
xix
LIST OF ABBREVIATIONS/SYMBOLS
Abbreviations
%D Percentage dilution
2D Two dimensional
3D Three dimensional
3DP Three dimensional printing
4D Four dimensional
abs Absolute value
AM Additive manufacturing
ANFIS Adaptive network based fuzzy interface system
ANN Artificial neural network
ANOVA Analysis of variance
ART Adaptive resonance theory
ARTMAP Adaptive response theory of mapping
BP Backpropagation technique
CAD Computer-aided design
CAM Computer-aided manufacturing
CCC Central composited circumscribed
CCD Central composite design
CCD Camera Charged coupled device
CCF Central face centered
CCI Central composite inscribed
CFD Computational fluid dynamics
CH Calinski Harbasz value
CNC Computerized numeric control
CT Clamping technique
CTWD Contact tip to work-piece distance
xx
D Matrix design point
DOE Design of experiments
DOF Degrees of freedom
FAMNN Fuzzy ARTMAP neural network
FDM Fused deposition modelling
FEA Finite element analysis
FL Focal length of the lens
FR Feed rate
GA Genetic algorithm
GMAW Gas metal arc welding
GPC Generalized predictive controller
GTAW Gas tungsten arc welding
GUI Graphic user interface
H Hypothesis condition
HAZ Heat affected zone
IPG Semiconductor laser
LC Laser cladding
LED Light emitting diode
LM Layered manufacturing
LM technique Levenberg Marquardt technique
LOM Laminate object manufacturing
LS Laser speed
MIG Metal inert gas welding
MIMO Multi-input multi-output
MLP Multi-layer perceptron
MSE Mean square error
MSEREG Regularized mean square error value
MSW Mean sum of squares of network weights and bias values
OVAT One variable at a time
P Penetration
xxi
PSO Particle swarm optimization
PW Power
R Regression value
R&D Research and development
RBFNN Radial base function neural network
RH Reinforcement height
RH12 Reinforcement height between bead 1 and 2
RH23 Reinforcement height between bead 2 and 3
RP Rapid prototyping
RSM Response surface methodology
SI Sensitivity index
SLA Stereo lithography
SLS Selective laser sintering
SM Subtractive manufacturing
Sqrt Square root value
Std Dev Standard deviation
STL Stereo lithography digital file format
T Total bead height
T OUTPUT Network target values
TIG Tungsten inert gas welding
UDF User defined function
W Bead width
X Matrix orientation
X INPUT Network input values
X-Y-Z Cartesian co-ordinates
Symbols for Laser Cladding Process
A Area of the positive bead
xxii
E Efficiency of the process
I Current
Q Heat input
S Welding speed
V Voltage
Symbols for Design of Experiments
I (t) Current supplied
M Levels
n Number of experiments
N Number of design variables
ƞ Response surface
n x k Design matrix
nc Center points
P(t) Instantaneous power
V(t) Potential difference in voltage
Xi Experimental value
y Objective function
α Axial distance from the center point to axial point β Co-efficient to linear, square and quadratic terms
Є Noise factor
Symbols for Artificial Neural Networks
a Lower boundary condition [-1]
b Bias value
c Upper boundary condition [+1]
xxiii
dm First derivative of error
dsm Second derivative of error
e Natural logarithmic function
g Improved performance ratio
L(u) Linear Activation Function
Log(u) Log sigmoid function
m Epoch run
N Number of training cases
t Targets
Tanh(u) Hyperbolic tan sigmoid function
wi Weight of input(s)
wm Input weight
xi Inputs to the Network
Xi' Normalized value
z Network outputs
λ Damping factor
σ Non-linear function
Symbols for Significance of Parameters
µ Average of response variable
A/B/C/D/E Manufacturing parameters
C.V. Co-efficient of variation
H0 Null hypothesis
MSPure Error Experimental error
n Number of terms
V Variation
X Overall mean
Xi Mean of the groups
xxiv
β Co-efficient to linear, square and quadratic terms
δx Incremental change in inputs
δy Incremental change in outputs
Symbols for Classification
C Co-relation value
ci Defined cluster
d Euclidean distance
d(x,y) Pythagoras co-ordinates
E Sum of Square Errors
k Optimal clusters
m Mean of clusters
mi Centroid of each cluster
p Given element
SSB Overall between cluster variance
SSW Overall within cluster variance
1
CHAPTER 1
INTRODUCTION TO ADDITIVE MANUFACTURING
1.1 Background
The term “manufacturing”, refers to a method that converts raw materials into
finished products using manual labor or machines, especially on a large scale [1].
Manufacturing is derived from the Latin word “Martus Factus”, which means “made by
hand” [2].
In general, manufacturing can be categorized according to the technique or the
methodology adapted to attain a desired finished product, as follows:
1) Casting process- this is one of the oldest methods of manufacturing. Sand casting
is one of the most common examples of the casting process. Here, the molten metal
is poured into the metal cavity and it is allowed to solidify to produce the final
product. Other examples of the casting process include: investment casting,
permanent mould casting, die casting, centrifugal casting etc.
2) Forming process- this is a process that aids in the modifying the shape of a
preheated metal. Drop forging is one the most common examples of the forming
process. Here, the preheated metal (billet) is placed in the die and a hammer is used
to strike the billet. This allows the shape of the die cavity to be obtained. Other
examples of the forming process include: press forging, upset forging, wire
drawing, rolling etc.
3) Welding process- this process involves joining two or more metallic pieces by
applying heat and pressure. Gas welding is one of the most common examples of
the welding process in which molten metal wire (with heat and pressure) is used as
an adhesive to join metal plates. Other examples of the welding process are: electric
arc welding, resistance welding, etc. Soldering, brazing are complementary
processes, but the base material is not melted.
4) Subtractive manufacturing (SM) process or material removal process- this is a
process that aids in removing the unwanted material from the work piece. Drilling
is one of the most common examples of the material removal process in which the
2
piece. Other examples of the material removal process include: milling, grinding,
broaching, turning etc.
The casting process and the welding process are a few types of the additive
manufacturing (AM) processes. On the Contrary, the forming process is a supplemental
process to the AM operations that helps generate new parts with no addition to material
(parts generated through deformation process). AM is demarcated by the addition of the
raw materials to a substrate or a base material. However, SM is demarcated by the removal
of the material during a manufacturing/ machining process.
AM defines the future of the manufacturing sector and helps revolutionize the
industry as it currently stands. AM techniques not only infuse the idea of “on demand
manufacturing”, but also have various advantages over conventional methods (SM
techniques). This thesis work incorporates an AM approach (laser cladding), which is a
budding practice in manufacturing industry today.
1.1.1 Comparison between Additive and Subtractive Manufacturing
Additive Manufacturing (AM) is a modern manufacturing technique to addition or
stacking of various successive two-dimensional (2D) layers to form a desired
three-dimensional part [3]. Figure 1, displays two additive manufacturing prototypes (figure1 B,
source: industry sponsor [4]).
(A) (B)
3
On the other hand, subtractive manufacturing (SM) is a traditional manufacturing
approach that refers to the process of material removal using various machines such as
computer-numeric control (CNC), horizontal/ vertical mills, lathe etc. to achieve a desired
finished end product. Again, “subtractive”, as the name suggests, refers to loss of material
while crafting a desired shape from a basic geometrical shape (such as a cube, a cylinder
etc.) [3]. Figure 2, displays a few subtractive manufacturing processes (figure2 (A) source:
Gosiger [5]; figure2 (B) source: Florian Schott [6] ).
(A) (B)
Figure 2: Subtracting manufacturing processes- (A) milling [5] and (B) lathe [6]
Additive manufacturing (AM) marks a new paradigm shift for the manufacturing
field of engineering over various traditional approaches. The industrial revolution was
driven by various subtractive manufacturing approaches which led to vast
accomplishments in the manufacturing sector. These accomplishments had a major impact
on the manufacturing industry but had various limitations in regards to manufacturing
capabilities. AM overcomes various manufacturing limitations set by traditional practices
and provides better quality and long lasting products [7].
1.1.2 Additive Manufacturing Process
Independent of the process adopted for additive manufacturing, the three
4
1) The generation of a computer aided design model (CAD model),
2) The fabrication of a physical layered model, and
3) Post processing of the layered model
These additive manufacturing steps can further be decomposed to six simple procedural
step(s): [8]
a) Drafting a 2D/ 3D model utilizing a computer aided design software (CAD)
b) Conversion of a proprietary CAD file to a suitable prototyping file, generally in most cases a ‘.STL’ (stereo lithography) format file.
c) Slicing the generated model/file into 2D cross sectional surfaces
d) Generation of a tool path to create the model in the additive manufacturing machine
e) Creation of the model in real life (physical form)
f) Finishing and post processing operations, for example, removing support materials,
cleaning, etching etc.
1.1.3 Additive Manufacturing Applications and Divisions
The systems that manufacture products using principles of additive manufacturing
are also known as layered manufacturing (LM) Systems. The prototypes generated by these
systems are helpful from the concept visualization phase to the functional and analysis
phase of the desired product. These layered manufacturing systems (LM) fabricate
components that have applications in diverse fields ranging from manufacturing sector to
biomedicine.
The selection of an additive manufacturing process is generally made based on the
end use of manufactured prototypes/ products. As seen in figure 3 (adapted from [9]), the
maximum (major) share of market for additive prototypes/ products is most prevalent in
the consumer products and the automotive industry (approx. 25% each), the second largest
share is prevalent in the aerospace industry, business machines and medical industry and
the third largest share is prevalent in sectors such as the military/government and various
5
Figure 3: Layered manufacturing division according to sectors adapted from [9]
It can be noted from figure 4 (adapted from [10]) that the primary application of
additive manufacturing includes generating functional models, a visual aid tool for
engineers, patterns for prototype tooling, and for fit/assembly testing. The secondary
application includes building patterns for cast metals, visual aids for toolmakers, and
directing tooling inserts. The tertiary applications include using AM prototypes for
proposals, ergonomic studies, quoting applications, and others. [10]
25%
24%
10% 10%
9% 8%
7% 7%
LAYERED MANUFACTURING DIVISION ACCORDING TO
SECTORS
Consumer Products
Automotive
Business Machines
Medical Uses
Other(s)
Aerospace
Government/Millitary
6
Figure 4: Layered manufacturing division according to application adapted from [10]
1.1.4 Types of Additive Manufacturing Processes
Some of the main AM technologies that exist in today’s market/industry and
academia are stereo lithography (SLA), selective laser sintering (SLS), fused deposition
modelling (FDM), 3D printing (3DP), laminate object manufacturing (LOM) and laser
cladding (LC). [8]
These technologies have their unique advantages and disadvantages but are much
similar in their overall manufacturing processes, i.e., AM processes consist of six basic
fundamental steps to manufacture a component (seen in subsection 1.1.2). Table 1 shows
the various layered manufacturing technologies subjected to the raw material utilized for
production purposes. [8]
18%
16%
16% 13%
9% 7%
6% 5%
4% 4% 3%
LAYERED MANUFACTURING DIVISION ACCORDING
TO APPLICATION
Visual aid for engineering
Functional Model
Fit/assembly
Patterns for prototype tooling
Patterns for cast metal
Visual aid for tool makers
Proposals
Direct tooling inserts
Ergonomic studies
Other(s)
7
Table 1: Types of layered manufacturing technologies with raw materials
S. No. Layered Manufacturing technology Raw Material
1. Stereo lithography (SLA) Photopolymer
2. Selective laser sintering (SLS) Metal powder, thermoplastics
3. Fused deposition modelling (FDM) Thermoplastics/ eutectic metals
(ex. silver-gold alloys that
transform directly from solid to
liquid state or vice-versa).
4. 3D Printing (3DP) Powder(s)
5. Laminate object manufacturing (LOM) Paper (primary raw material),
plastics and ceramics
6. Laser cladding (LC) Powder metal(s)
The focus of this thesis work is on the laser cladding technology. This technology
is discussed more in detail in chapters 3-6.
1.1.5 Advantages of Additive Manufacturing
Additive manufacturing has various advantages over conventional machining
processes, including:
1) Ability to effectively manage increased part complexity without increased process
planning time - a major benefit of using an additive approach is the ability to create
parts that comprise of complex shapes and are difficult or impossible to
manufacture through conventional subtractive practices. For example- additive
manufacturing can produce various complex structures that in the past had
limitations due to weight or process planning constraints, which are typical
applications for the aerospace and automotive industries. Figure 5 (source: Ziad,
Abou [11]), displays one such application of structure created through FDM (fused
deposition modelling technique), a technique that is extremely challenging to
8 Figure 5: Complex additive manufacturing specimen [11]
2) Digital design and ease of manufacturing- the parts manufactured through the
process of additive manufacturing are generally a bi-product of standardized digital
files (.STL files). The level of operator expertise and human interaction through a
graphic user interface (GUI) required is low as the part is being generated and
validated within the CAD/ CAM software. This practice promotes an unmonitored
manufacturing approach leading to an increase in production volume and a decrease
in lead time. Furthermore, digital manufacturing promotes production through
customization [7].
3) Low production cost due to “free complexity”- in subtractive manufacturing,
production of a part requires various tool changes along with process planning
complications that adds to the complexity of the part. On the other hand, additive
manufacturing is a complexity independent process that promotes manufacturing
using a single tool for any desired geometry. This proactive approach makes the
process complexity free with no additional costs or lead times in manufacturing of
the customized parts [7].
4) Instant global production- the products produced with additive manufacturing are
created initially through a digital .STL file. Due to this digital nature of the part,
these files can be transferred over the web. Once the file is downloaded, it follows
the identical process of manufacturing through a compatible production equipment,
resulting in similar design characteristics of the 3D part manufactured [7].
5) Waste reduction- additive manufacturing is done through addition of successive 2D
9
material removal process leads to bi-products such as material scraps (ex. metal
chips) and other lubrication fluids (ex. coolants and lubrication oils) which are
non-biodegradable. Hence, additive manufacturing also promotes “green manufacturing” [7].
1.2 Motivation, Objectives, and Limitations
1.2.1 Motivation
Laser cladding (LC) is an additive manufacturing process that builds a product from
thin layers of melted powdered metal(s) through a fusion reaction with help of a laser
system. In a particular case of laser cladding, the part’s geometrical properties depends on
the material’s deposition orientation, feed rate of the powder (metal), power of the laser,
focal length of the focusing lens, travel speed of the laser to provide fusion reaction and
the distance of the nozzle to the workpiece. These factors/ parameters control the
meso-structure characteristics of the bead and influence the overall built of clad bead geometry.
The dependence of the material’s geometrical properties and meso- characteristics on the
manufacturing parameters provides the laser cladding (LC) technology an ability to
optimize the overall build performance. This approach is well established for similar
process like metal inert gas (MIG) and tungsten inert gas (TIG) welding technology; but
proves to be a novelty area of research for the laser cladding technology.
There are three main manufacturing strategies for the clad bead structure built or
generated by using laser cladding technology: single pass bead, overlapping layers and
multi- layer orientation (3D part). Each manufacturing strategy has a significantly unique
use in the industry and hence, it is relevant to study these strategies to generate profits.
Single bead orientations are generally used in repair work of mold and die sets, overlapping
layers are generally used to coat a surface of a metal to enhance the metallurgical properties
of a substrate (such as wear, corrosion, thermal etc.) and multi-layer orientations are
complex integrations of various overlapping layers which aid in generating a
three-dimensional structure. Figure 6 (source: industry sponsors [4]; figure 6 (C), designer- Mr.
10
(A) (B)
(C)
Figure 6: Laser cladding operation- (A) single pass, (B) overlap pass, and (C) 3D part [4] – designer Mr. Syed Saqib
The excessive time consumed, financial investments and material wastes are
prominently increased when a part is generated in any of the mentioned (A, B, and C)
manufacturing strategies due to laser cladding being a novel technology in the additive
sector. Research has shown that when various manufacturing parameter configurations are
utilized, dilution levels over a diverse range are generated in bead structures. Also,
overlapping and multilayer structures tend to possess porosity due to imperfections in the
11
production is not desirable since such impurities may lead to instability and various
structural mishaps. Evidently, it is desirable to standardize the laser cladding process to
reduce the manufacturing time and the material wastage. The aforementioned action will
be desirable to characterize and ensure the stability of the structure as well as the
geometrical behavior for which the desired part is produced.
The shape or geometrical properties established in a laser cladding process are thus
governed by the manufacturing parameters. Hence, it is vital to characterize or standardize
a methodology that can show linear or non-linear topological relationships between the
structural (shape) properties with corresponding manufacturing parameters.
1.2.2 Thesis Objective
The key focus of this research is to standardize and optimize a clad bead structure that
relates to a set of manufacturing parameters for the laser cladding additive manufacturing
process. This thesis encompasses the following objectives which are necessary to achieve
the desired goal of standardization.
1) An experimentation approach for data collection: the objective of defining an
experimentation strategy for standardizing the laser cladding technology is to
minimize extensive collection of raw data. This raw data results from generating
combinations of configurations (manufacturing parameters) that are involved in the
LC process varied over five levels. Fabrication of the desired clad bead geometry
for various process configurations is highly expensive, as it involves investment of
raw materials, financial participation and time resources. Thus, a design of
experiments (DOE) technique is hereby applied to this thesis work for data
collection, providing a cost- effective means of solving problems and developing
new processes.
2) A cognitive artificial intelligence system: the purpose of developing an artificial
intelligent cognitive system is to reverse engineer the laser cladding process and to
commercialize the product (software package). Here, a neural network application
12
(designed through DOE), to successfully predict manufacturing parameters from
shape parameters of a generated clad bead and vice-versa. A neural network uses a
supervised learning technique to confidently predict the output variables in the
system based on a Levenberg Marquardt (LM) learning algorithm. This prediction
tool helps reduce experimentation time by generating outputs for various unknown
input datasets for future use.
3) Significant interactions between the manufacturing parameters (feed rate, power,
travel speed, focal length of the lens, and contact tip to workpiece distance) and the
geometrical shape characteristics (height, width, penetration and percentage
dilution): laser cladding is a multi-variable, non-linear behavioral process with
interactions among its parameters. The objective here is to identify the extent of the
contribution of each variable (parameter) and its impact resulting from interactions
on the output. This is essential in developing and manipulating confident predictive
models for desired results. Analysis of variance (ANOVA) and sensitivity analysis
methodologies are studied through this research to determine the most significant
process factors that relate to the various shape parameters for a laser cladding
process configuration.
4) Optimization of clad bead geometry: optimization is a vital component of manufacturing industry in today’s market. This optimization approach is adopted
in this thesis work to generate the clad bead structures that reduce system instability
and structural mishaps. To achieve such goals, production impurities, such as
percentage dilution is minimized as an objective function. The response optimizer
application based of the MINITAB software workspace is utilized to the generated
statistical model. The response optimizer also aids in visualizing single and
multiple objective optimization results that helps optimize single or multiple
parameters at a particular time in space.
5) Clad bead shape classification: classification of clad bead shape geometry is
performed to determine and assign a cluster characteristic to the collected raw data
points. The objective of classifying the raw data points is to determine various
shapes a clad bead possesses with changing levels of percentage dilution. These
13
properties to which a bead structure belongs. A combination of MINITAB
(Euclidean distance) and MATLAB (classification network) packages are used to
classify the collected experimental data.
1.2.3 Limitations
The work presented in this thesis focuses on defining a clad bead shape geometry
with respect to various process configurations i.e. combination of manufacturing
parameters for a laser cladding operation. This thesis work is limited to the interactions
between five manufacturing parameters (power of the laser, feed rate of the powdered
metal, travel speed of the laser, focal length of the focusing lens and contact tip of the
nozzle to workpiece distance) and four mechanical shape parameters (width of the bead,
reinforcement height of the bead, penetration of the bead and percentage dilution).
The thesis work does not incorporate any external mechanical factors (such as heat
affected zone, metallurgical properties, chemical properties of metals etc.) except the five
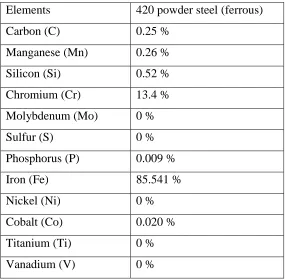
manufacturing parameters and the four shape parameters. This research work uses 420 steel
(low carbon) clad powder for various single pass and overlap configurations. The overlap
configurations are limited to 40%, 50 %, and 60 % overlaps with a three pass bead
formation. The thesis does not contribute any significant in-depth knowledge in 3D part
production. The equipment used to build the clad samples is selected according to the
availability of the machine at the industry sponsor facility. The composition of the 420
steel clad powder used to generate the single pass and the overlap samples is presented in
14 Table 2: Composition of the 420 steel clad powder
Elements 420 powder steel (ferrous)
Carbon (C) 0.25 %
Manganese (Mn) 0.26 %
Silicon (Si) 0.52 %
Chromium (Cr) 13.4 %
Molybdenum (Mo) 0 %
Sulfur (S) 0 %
Phosphorus (P) 0.009 %
Iron (Fe) 85.541 %
Nickel (Ni) 0 %
Cobalt (Co) 0.020 %
Titanium (Ti) 0 %
15
CHAPTER 2
LITERATURE REVIEW
2.1 Experimentation
There are several experimental approaches that have been used in the past by
researchers for sample collection. There is an enormous paradigm shift in the
experimentation process from conventional methods to a formal ‘design of experiments’
approach. Most of the researchers nowadays adopt the design of experiments approach to
gain a maximum amount of information from a single optimized experiment. In adopting
a DOE approach, the researchers limit the amount of material wastage, time spent in
generating a population of samples and long equipment usage hours. These factors directly
have an impact on the financial contribution towards a research and thus, limiting them is
the most favorable condition. This sub-section focuses on various DOE techniques adopted
by researchers in the past to perform a successful sample collection process.
The L9 Taguchi approach is one technique applied by a research team to investigate effects of conducting polymers composite sensor compositions on the response to a
homologous series of alcohol. A 2-4 (2 levels and 4 factors) L9 design is applied to collect
experimental data. As compared to the conventional DOE approaches, the Taguchi
prospective involve creating a robust design rather than focusing on an average result level.
In this research, variation of the raw data is studied and experiments are carried out for
controllable design factors and disturbing signal factors (2 or 3 levels). Also, this approach
helps in choosing factor levels that help minimize sensitivity against disturbances and noise
factors. The Taguchi approach is based on quality loss function by focusing on minimizing
losses in quality through achieving target values. Through quality loss, Taguchi developed
a method of extending each experiment with an outer array (also called orthogonal array).
The outer array helps in simulating the external environment that experiments are exposed
to. By applying this approach, the sensors were characterized with a view to improve
sensitivity [12]. The Taguchi method through other research works’ is also considered
relevant in determining the behavioral changes in the shape parameters of a weld bead with
16
a robust design i.e. concept design, parameter design and tolerance design with main focus
being on the parameter design. [13]
Another approach that has been applied by Buragohain, M. and Mahanta, C. [14] focuses on using a full factorial design technique in DOE. The research team applied a full
factorial design methodology in deciding the size of the input-output data set while
developing an adaptive network based fuzzy interface system (ANFIS) for the modelling
and controlling of uncertain systems. The main objective of using a full factorial approach
is to optimize the number of data points used in the learning process of the network. The
paper uses the simplest design of 2 levels and n factors i.e. 2n factorial design for generating
data points. The data points in such a model lie on the corners of an n-dimensional space.
Hence, in the presented paper the data points lie on the cube points (3 factors making it 8
experimental points). One of the limitations of this highlighted approach is that in a two
dimensional factorial design, it is difficult to distinguish between linear and higher order
interaction effects such as the quadratic and the square interactions between factors. To
overcome such inabilities, the paper discusses a comparison of a 2-level design with a
3-level (1), 3-3-level (2) and a 4-3-level full factorial design. The number of experimental runs
for theses designs are defined as 8, 13, 11, and 18 respectively i.e. by calculating a 2n
experimental run and adding the effect of the factors. [14]
V. K. Gupta and R. S. Parmar [15] have also approached the problem of optimizing
welding bead shape parameters with the help of design of experiments (DOE) [15]. The
paper defines welding processes as a multi- input, multi- output process with various
process and shape parameters. Various methods for optimizing shape parameters have been
defined such as factorial, response surface methodology, general algorithm, artificial neural
network, and Taguchi method. Factorial design in DOE uses a 2n-1 approach with n being
equal to 5 (process parameters). It is seen through this research that the factorial technique
with a 2n-1 approach is highly effective in plotting main effects and interactions between
different welding process parameters. Also, the factorial technique is helpful in generating
mathematical models that can help predict the shape parameters and the high quality weld
17
One of the most effective and widely used DOE approaches is a response surface
methodology (RSM) technique which uses a central composite design (CCD) to define an
experimental dataset [16]. Zhang Z. [16] has shown the importance of central composite
designs in defining a response surface. One paper presents a comparison between the three
CCD’s i.e. central composite circumscribed (CCC), central composite inscribed (CCI), and
central face centered (CFC) designs. The CCD’s are robust designs and overcome the
limitations of a full factorial design by studying the interactions of quadratic and squared
terms along with linear terms. The advantage of a CCD over any other approach is that the
CCD design is rotatable (i.e. axial distances help in the selection of a design region) and
has maximum stability due to generation of center points of a system. It is concluded from
the paper that the three variations of CCD’s have similar efficiency levels in the degree of
model but have dissimilarities in terms of the estimation precision, the stability of variance,
the uniformity in precision, and the robustness of extrapolation. Also, it is concluded that
the central face centered (CCF) design is the simplest variety of CCD as it requires only
three levels of each factor. Therefore, it minimizes the deception in the data set due to the
experimental error in the data setup and collection process [16].
Also, another approach adopted by Khawas A., Banerjee A., and Mukhopadhyay
S. [17] show that D-optimal designs are widely used in a computer generated design of
experiments. Use of such a design technique helps in the construction of a quadratic 2nd
order model more efficiently than any other approach. The objective of this design is to
select the best set of points in an experimental set to maximize the determinant of |𝑋𝑇∗ 𝑋|.
Here, X defines a matrix orientation of the design variables. D-optimal design, therefore,
helps in minimizing the error of the coefficients of a response model (2nd order model).
The advantage of using such a design is the availability of extra design points that can be
incorporated into the system. In papers, this approach has been found to be quite effective
in analog circuit performance optimization [17]. Another area where the D- optimal
technique is used as a DOE approach includes wing design for a high- speed civil transport
18
Hence, through a detailed literature review a CCD design approach is chosen for
the purpose of this thesis and a response surface methodology is carried out to optimize the
input parameters at a later stage.
2.2 Artificial Intelligence system(s)
Use of artificial neural networks (ANN’s) is one of the few approaches to
developing a prediction model that can be termed as an artificial intelligence system. From
one of the research papers, it is noted that this approach was applied in an arc welding
process to control physical processes. Gas tungsten arc welding (GTAW) experimentation
was carried out initially to determine the various shape parameters present in a bead
structure. A neural network architecture was then built and studied using the MATLAB
toolbox which aided in estimating trends in the shape parameters as well as the errors
involved in the GTAW process. Various neural network configurations were built and
tested to reach the best performance configuration (2-by-18 i.e. 2 hidden layers with 18
neurons/ activation functions was the best indicated configuration). The four inputs to the
system are defined as voltage, current, electrode travel speed and wire feed rate; and the
four outputs are defined as the shape parameters (width, penetration, reinforcement height
and bead cross sectional area). [19] [20]
Alternatively, Datta S. and Pratihar D. K. [21] approached the similar problem with
three approaches to establish input- output relationships in metal inert gas (MIG) welding
process. The three defined approaches were different from one another as approach 1 was
based on the genetic algorithm (GA) to optimize the radial base function neural network
(RBFNN); whereas approaches 2 and 3 structure RBFNN according to two different
clustering techniques i.e. the fuzzy c-means algorithm and the entropy based algorithm.
The result shows that poor performance was seen while adapting to approach 1 due to
permutations in genetic algorithms while, approach 3 was the best approach to establish
the input-output relationship due to a combination of one global and one local optimizer
approach. Also, it was seen that the entropy based clustering had better fitting and
19
Determining geometrical dimensions of the clad bead in a laser cladding process
was adopted by a few researchers. Meriaudeau F., Truchetet F., Grevey D.,
Vannespresented A.B. [22] presented a unique low cost system using two charge-coupled
device (CCD) matrix cameras, a standard acquisition card and a personal computer to
gather information on the laser cladding process both in warm-up and actual operational
state. Here, one of the CCD matrix camera was used to gather temperature measurements
through the use of a spectral thermometer and the other CCD matrix camera was used to
gather the shape parameters such as width, length of the tract, power spray distribution etc.
The aim of the research was to control the cladding process in a closed loop. The real time
temperature measurements were performed using algorithms based on statistical
momentum conservation (Wen’s algorithm) and it was seen that the temperature range for
the cladding process lies between 0.7 and 15 micrometers (Max Planck’s equation
derivation). The paper also, envelops different methods of involving CCD sensors for the
sample collection such as Doppler anemometer, discrete Fourier transform, two or three
color imaging velocimerty etc. [22].
Similar research is conducted by Meriaudeau F., Truchetete F., Dumont C., and
Renier E. Bolland P. [23] where two CCD cameras are used to determine shape parameters,
surface temperature readings to detect variations in powder feed rate and powder
distributions. Here, surface temperature is calculated using Beer Lambert’s law. For
temperature measurements, CCD technology (through Max Planck’s Law) interpolates a
linear relation between digitalization of optical radiation signal and black body
temperature. Furthermore, CCD technology used for geometric measurements through
afore displayed curves predicts change of track section (shape) when variations in
parameters are introduced. [23]
Amara E. H., Achab L., Boumiahave O. [24] also developed a dynamic mesh
method to model the laser cladding process. The major concerns of this study relates to the
physical (mechanical) properties of the process i.e. the Marangoni thermocapillary flow,
the powder-melt poll interaction, the mass transfers and diffusion, the laser-powder
interaction, and the laser work- piece interaction. The aim of the study is to predict various
20
to reach the goal where, the heat conditions and the flow dynamic equations relates to the
inner and the outer boundary of the clad bead were established. A finite element analysis
(FEA) approach is then applied to the generated equations for discretization and through
the user defined function (UDF) deformations in the mesh were studied. Hence, these
deformations were related as a result/function of the input parameters of laser, substrate
material and the injected clad material. [24]
Xiong Z., Zhang Y, and Zeng X. [25] conducted specific experiments using 304
stainless steel thin plates (substrate plate) and a co-axial nozzle for the powder feed rate to
demonstrate deformations in the substrate plate through the laser cladding process [25].
Parameters that contributed include the power, the scanning speed, and the line energy on
the bending angle. Initially, it was seen through various experiments that there was a
significant bending in the substrate plate and the bending was directly proportional to the
parameters. It was realized later that the bending rate decreased when parameters reached
their critical values. Also, the value of bending angle is related to yield strength of the heat
affected zone, the temperature gradient in direction of thickness, and the size of plastic
zone. Contrary, it was observed that with too small or too large values of the line energy,
the bending angle was of smaller magnitude, but with a moderate line energy value the
bending angle was of a larger magnitude [25].
Also, Song L. and Mazumder J. [26] presented a control strategy with the input
constraints to stabilize the temperature possessed by a melt pool during the process of laser
cladding while forming various clad layers. The instrument used to monitor the temperature
reading was a dual-color pyrometer. The sub-space method helped device a dynamic model
relating the laser power to the melt pool temperature. A dSPACE real-time controller was
implemented to predict the control algorithm with the input constraints. Adjusting the diode
laser power helped track the melt pool temperature to a reference temperature profile in a
closed loop cladding process. Instead of a PID (proportional integral derivative), controller
a generalized predictive controller (GPC) was used to compensate lack of deposition by
the adjusting laser power during the cladding process. This is because a GPC can deal with
the input constraints systematically and adapt easily to the (multi input- multi output)
![Figure 3: Layered manufacturing division according to sectors adapted from [9]](https://thumb-us.123doks.com/thumbv2/123dok_us/1404199.1173065/30.612.108.538.64.353/figure-layered-manufacturing-division-according-sectors-adapted.webp)
![Figure 4: Layered manufacturing division according to application adapted from [10]](https://thumb-us.123doks.com/thumbv2/123dok_us/1404199.1173065/31.612.109.517.65.353/figure-layered-manufacturing-division-according-application-adapted.webp)
![Figure 5: Complex additive manufacturing specimen [11]](https://thumb-us.123doks.com/thumbv2/123dok_us/1404199.1173065/33.612.252.398.75.226/figure-complex-additive-manufacturing-specimen.webp)
![Figure 6: Laser cladding operation- (A) single pass, (B) overlap pass, and (C) 3D part [4] – designer Mr](https://thumb-us.123doks.com/thumbv2/123dok_us/1404199.1173065/35.612.121.531.101.488/figure-laser-cladding-operation-single-pass-overlap-designer.webp)

![Figure 15 (adapted from Materialgeeza [51]); displays a schematic view of the laser cladding equipment](https://thumb-us.123doks.com/thumbv2/123dok_us/1404199.1173065/62.612.122.537.129.452/figure-adapted-materialgeeza-displays-schematic-laser-cladding-equipment.webp)
