Real Time Analysis in Decentralized Energy
System Using Genetic Algorithm
S. Rajalakshmi 1, 2, S. Niveda 1, 2, Dr. S Subburam3, R. K Kapilavani4
B. E Student, Department of Computer Science & Engineering, Prince Shri Venkateshwara Padmavathy Engineering
College, Chennai, India1,2
Professor, Department of Computer Science & Engineering, Prince Shri Venkateshwara Padmavathy Engineering
College, Chennai, India3
Assistant Professor, Department of Computer Science & Engineering, Prince Shri Venkateshwara Padmavathy
Engineering College, Chennai, India4
ABSTRACT: Decentralized energy trading systems are used to reduce the transmission losses and have been successful in reducing the carbon emissions. Having achieved economically, they can further be extended to use the energy power supply in a more efficient manner. Power cuts occur due to uneven distribution and usage of power supply. To overcome this issue, we have proposed an efficient way of monitoring the power supply generated from the energy system. Using smart grids we can monitor the power supply and we can then arrive at a conclusion regarding the usage of power. Each organization or household will be assigned a minimum usage capacity. If this usage limit is exceeded by the organization then a real time message will be sent to the user instructing them to limit their usage and thus reducing the power supply. To complement this research, we have used a GSM module to collect the incoming messages and then perform analysis on it. Using, genetic algorithm we can plot a graph that indicates the power usage by the user. On a large scale, implementing this can be used to reduce the total power that is suspended from the energy sources.
KEYWORDS: Decentralized systems, Future prediction, GSM module and Genetic algorithm
I. INTRODUCTION
During the early stages of electrical infrastructure a model of centralized and state owned power plants were the major sources of energy. Since most of these plants were physically clustered together it led to bulk electricity needs. Owing to these issues and the increasing security concerns they upgraded to the concept of decentralized energy trading system.
The decentralized energy system majorly relies on distributed power generation and energy storage. The need for using decentralized energy system arose mainly due to the following reasons:
1.1)Rising electricity demand
1.2)Growing concern over the security demands 1.3)Single point of failure
1.4)Higher prices and complexity for metering, billing and tariff
plants improve energy efficiency, they are also part of DG even though they may use fossil fuels in some cases. CHP units are often used by local players such as municipalities, companies or households. Demand Response (DR) is the second key component of a decentralized power system. Though the demand response does not necessarily save energy, it rather shifts energy loads around in time. This is component as can avoid the need to shed excess energy supply during low demand or high supply. The third major component is the energy storage. This will allow storing part of the energy produced by intermittent sources during low-consumption hours and feeding this energy back into the power system when most needed during peak hours.
Once the energy is supplied to each home, the amount of energy used by each home can be calculated and then sent to the user. The main idea behind this technology is the technique of using block chaining. The blockchain eliminates the risk that is associated along with the data. The decentralized blockchains use ad-hoc message passing and distribute networking. Public key cryptography is used in block chain to hash the values from one ledger to another. Each node in the decentralized system contains a copy of the blockchain. To maintain data quality the concept of data replication and computational trust is implemented. They use various time stamping schemes to serialize changes and they are delivered to the destination node on best effort basis.
The amount that the customer has to pay is billed to the user. To facilitate a secure online payment, the concept of but coin technology is implemented. Bitcoin is a digital and decentralized scheme used to exchange value without intermediaries that translates greater control of funds and lower fees. Bitcoin is faster, cheaper and more secure. Bitcoin is less volatile and can be to store a large set of values. They are majorly implemented during the peer to peer payments. Using this, the online transaction can be carried out.
II. CORECOMPONENTS
The core components that work in the background of this system are:
A. DATA COLLECTION
Data collection forms a major part of the proposed system. It is a process of collecting data regarding the usage specifications provided by the user. It refers to process of gathering information and measuring them on variables of interest, in an established systematic fashion that enables relating to stated research questions, and test hypotheses. For this system, the data is collected regarding the usage of a person. The details of customer and his power usage will be collected and stored in the database. This information can then later on be queried and used for other purposes like plotting the graph, data updating, monitoring and so on.
B. GENETIC ALGORITHM
The genetic algorithm (GA) is a method for solving both constrained and unconstrained optimization problems based on a natural selection process. This algorithm repeatedly modifies a population of individual solutions. During each step of the process, the algorithm tends to randomly select individuals from the current population. These collected data are then used as parents to produce the children for the next set of process. Over successive generations, the population "evolves" toward an optimal solution. The genetic algorithm can be used to predict the future load usage of each customer. It gathers all the values and evolves them according to the data limit set to tem. It uses a combination of both data mining and predictive analysis to arrive at the result.
C. MESSAGE STREAM
D. BLOCKCHAINING
The electric meter readings are sent dynamically to the electric board office. But the message travels through various access points before reaching the destination. Hence the block chaining concept comes into play. The Blockchaining is majorly used for bitcoin transaction. The Blockchaining is the technique where a message block forms a chronological chain. The chain is constructed by adding the hash of the previous block to the current block and the hash of this current block will be appended to the next block. Thus by appending the hash value of the previous block to the current block, the chronological chain of messages is formed. So the duplication of message is not possible, because it also requires the change of the hash value of previous block. The Blockchaining provides the proof of work, generating a blockchain involves a lot of complexity and utilizes many resources. But the security provided to the message streams is high. The attacker, who enters the system to duplicate the messages, will have to alter the whole of the network which is tedious and becomes impossible in a large scale field. The Blockchaining concept was first used in bit coin, digital currency system.
III. MODULES
This section mainly focuses on the modules used in the implementation part. The different modules used are Data Controlling, Data usage, Data collection, Data monitoring and Data prediction.
A. DATA CONTROLLER
Data controller is handled by the admin or a higher authority in the back end. The admin controls the entire working system by monitoring each and every activity of all the modules. Each user associated with this system will have a registered account and login details. The verification and authenticity of the user will be controlled by the admin. The admin monitors the database and assigns the power limit based on the scheme specified by the user. This module acts as a platform for all the other modules.
Figure 1: The user will have to enter his username and password
B. DATA USAGE
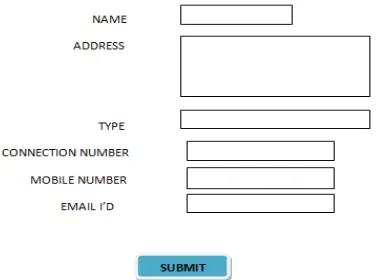
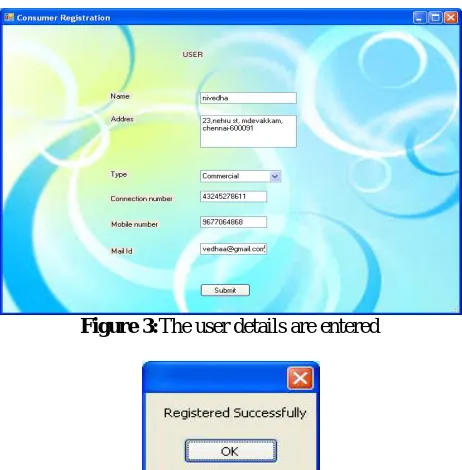
Data usage is the details collected from the authenticated consumer. The user will have a unique ID and a registered password through which he is authorized to use the system. The user further enters the system to feed the details such as: User address, Scheme, Account, Mail ID, Phone number and Connection number. These details once submitted by the user, gets stored in the database.
Figure 3:The user details are entered
Figure 4:Pop up box appears once the user details are verified by the admin
C. DATA COLLECTION
The data collection is handled by the GSM module. Connection number is unique number for every user that represents the link between the user and the GSM module.
The GSM module collects the messages from the user dynamically. The dynamic messages contain the total power utilized by the user. This message contains: Start value of the meter, end value. This reading is fetched to the admin where the total energy consumed by the user for a limited period of
time is calculated as follows
Formulae 1: To find the total power consumed
Figure 5: The readings that are recorded in the electric meter
D. DATA MONITORING
Once the total power consumed is calculated, the amount to be paid by the user can be calculated as follows
Formulae 2:To find the total amount to be paid by the user
The total amount is then paid by the user. The transaction details are automatically stored in the database which is monitored by the admin. Based on the consumption history, the admin will assign a set of rules and regulation that needs to be followed by each user. Based on these conditions each user will be supplied a certain amount of power supply.
E. DATA PREDICTION
This module works based on the Data Mining concept. The input fetched by the admin will contain the details of total power consumed. The collected data will be in an unstructured format. The data must be first categorized based on the attributes and then the decision tree algorithm is used to process it. Clustering technique is used to reduce the size of the data by removing the redundant data. This process is called as sampling. Once the data is processed and brought into a structured format, we can plot a graph to depict the power usage. The number of units consumed will be plotted against the time period. If the number of units consumed exceeds the limit or the condition value then alert message will be sent.
III.SYSTEMARCHITECTURE
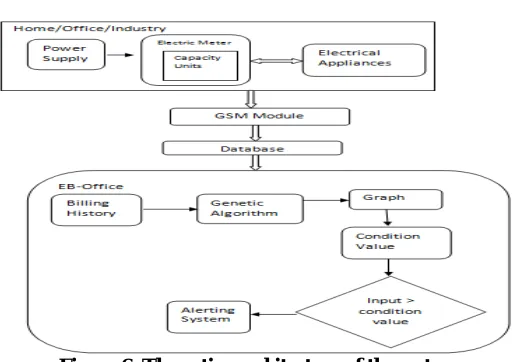
Figure 6: The entire architecture of the system
The system architecture shows the different modules present in the system. The user side is considered as the front end. The EB-office is the back end where the admin monitors the data. The Genetic algorithm and the data processing software are used to generate a graph and a conditional value based on the data collected. This process occurs at the back end of the system. The GSM module acts as the interface to send and receive messages between these two modules. The database is present in the middle is used to interconnect the two modules. Once the data in the database is received by the admin, the software generates a graph by processing the billing history. The genetic algorithm further processes the data over a specific time period and generates an appropriate condition.
V. IMPLEMENTATION
This system can be implemented in large scale and real time basis with the support of the government authorities. To verify our theory we have come out with an experimental setup that covers all the concepts. This setup involves the coordination of five modules that works in a collaborative manner.
A. COMPONENTS
In order to explain this system with an experimental setup, the following components are used: GSM Module, Adapter, and Serial to Parallel convertor and Sim card. The software components include: Database, SQL server, Visual studio, C#, .NET framework.
5.1.1 GSM Module
The major work of the GSM module is to establish connection between the computer and the GSM sim card. The GSM module assembles with a standard communication interface like RS – 232. It is interfaced with a computer or a microcontroller based system. The communication between the computers is done through the connected GSM module.
5.1.2 Adapter
The adapter attached to the GSM modem to activate the power supply present inside it. The board also consists of a set of pins which can be attached to the mic or speaker using the adapter.
5.1.3 Serial to parallel port
The serial to parallel convertor also called as a serial-in/parallel-out shift register is used to convert the data from serial format to parallel format. The pragmatic application of this register involves converting the serial format input onto a parallel format multiple wire output.
5.1.4 Sim card
The sim card will be present in the GSM module to send and receive the messages. The sim card number acts as an identification for the sender. The sim card collects the data and stores it before transmitting it to the system. This data is then fed as an input to the GSM module.
B. EXPERIMENTAL SETUP
The experimental setup focuses on the connection between the components that are used for implementation and simulation. This system uses a working sim card which is inserted in the GSM module. Since the GSM works in a serial manner, a serial to parallel cable is used. This cable connects GSM module and the computer system. The final output is then viewed on the computer.
C. PROCESS
Figure 7: Units consumed during a week
In order to process the collected data and to generate a condition value, we need to categorize the data. Here we can categorize the data based on the scheme or the phase selected by the user. The categorized data can be labelled and thus it forms a definite set of data modules. To implement this concept, the clustering technique is used. Firstly, the data is labelled based on the distinct attributes assigned. The data is valued based on the distinct attributes like the unique meter ID and based on the phase and connection scheme. Secondly, the redundant data is removed using sampling technique. For example, a collection of data which consists of the meter readings of users based on their scheme based, these data can be labelled as A, B, C respectively. The data represented by the label A can have similar data content which is called the redundant data, it can be recognized and removed by Sampling. Once the data is labelled and the sampling is done, the clustering process of data is completed. Thirdly, using decision tress we can assign each node a condition value.
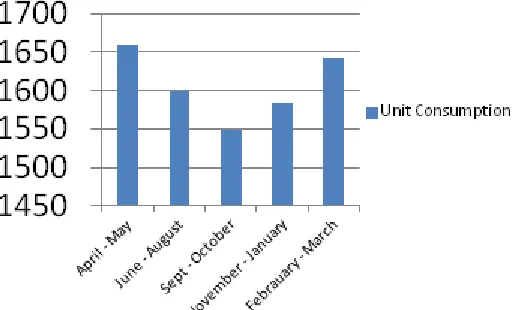
By using genetic algorithm over these collected data, we can generate a conditional value. In our experimental setup, the meter readings are sent as messages from different mobile phones each having a unique number, the messages are received by the GSM module. The GSM module segregates the message and stores the contents in the database. The data from the database is viewed by the admin. The admin then provides the necessary details to run using the genetic algorithm. The genetic algorithm produces a conditional value based on the graph plotted. This graph has the units consumed against the time period. The condition value and the graph are then sent to the admin. If the user utilizes the power above the limit of the conditional value, then the system will generate an alert message which is sent to the user and the electric office. When the user consumes a large amount of units beyond the conditional value, then user is subjected to an extra fair or fine by the admin.
Figure 8: Depicts the total unit consumed during different months of the year
0
10
20
30
Sunday Monday Tuesday Wednesday Thursday Friday Saturday
Thus by processing the power supplied and utilized by the user we can come to a detailed outline of the power requirements of the user. This system can be used for predicting the future load demand. When the amount of power that is been generated is equal to the power utilized then the proportion will be normalized thus the amount of power wastage is reduced.
VI.RELATED WORKS
According to a recent survey conducted, most of the energy consumption issues occur due to uneven usage of power supply. To manage the power supply generated we can efficiently implement a system that employs the above said concepts. In the current scenario, the electric readings are being dynamically transmitted to the electric board by using a programmable chip in the electric meter. This chip is programmed to authenticate the messages before transmitting it to the neighbouring access point. Thus, the secure transmission of messages is achieved by this technique. The power supply from the electric remains the same throughout the year. But the user requirements differ depending upon the season and the amount of power used by each appliance. During the winter season high capacity devices are not used more when compared to low capacitance devices like rotating fans and so on. Whereas during summer season there is an increased need for Air Conditioners. But the capacity of power supplied for the electric devices remains the same, which results in energy crisis during the summer season and the voltage drop occurs more often. In order to control this, we can analyse the input power supply and the power utilized to get the detailed model of the power utilized by a particular user.
To implement this on a larger scale, large processing of data is required. A software can be implemented that will dynamically the collect the data and processes the data over a specific time period (in order to know the capacity utilized for a particular time). The input from the front end will contain the details of the power supplied and consumed for which the graph is plotted. From the graph, the conditional value can be calculated. This conditional value is set as the major condition for the user and admin. But when the user consumes the power beyond the conditional value, the system sends the alert message to the user and the admin. By implementing this technique, the energy crisis and the voltage drop can be reduced to greater extent. The industries and Babcock can also adopt this technique so the power supply can be used in a brilliant and efficient manner.
VII. CONCLUSION
In this paper, we focused on finding an economical way to efficiently use the power generated from the transformers. This paper uses an experimental set u to understand the working and the future prediction of power supply. By predicting the future load we can not only reduce the amount of power used in the longer run we can also have a control over the amount of power that is manufactured. The proposed system uses genetic algorithm to predict the amount of power used in each household. By this method we can form a sketch on how much each household uses and consequently a plan can be made to reduce the total power that is generated.
Genetic algorithms are used over the other algorithms because these algorithms have a greater optimization and use a comprehensive search methodology when compared to other algorithms. For the implementation purposes, we have combined genetic and data mining algorithms to extract the value from the database. This enables the admin to put constrains over the data usage of each user. It mines the value from the collected database and then puts n possible constrictions over the data.
A user will be sent intimation if he exceeds the conditional values assigned to the user.
We simulated the proposed method using a GSM module connected to the system. We employed a set of values which was given as an input to the module through Sim cards and then stored them in the database. Combining data mining and genetic algorithm, we were able to add restrictions on the collected data the user’s power usage capacity. The experimental set up plots graph to show the varying amount of power usage in each home. The input values used for the implementation purposes were collected by a survey conducted on nearly 20 households by the team.
present day scenario, we tend to ignore the growing power usage and its effects. The need of the hour is to manage the needs of the present as well as keeping in mind the needs of the future also. By, employing a strategy to monitor the power usage we can control the power that needs to be generated.
REFERENCES
[1] A. Molina-Markham, P. Shenoy, K. Fu, E. Cecchet, and D. Irwin, “Private memoirs of a smart meter,” in Proceedings of the 2nd ACM workshop on embedded sensing systems for energy-efficiency in building. ACM, 2010, pp. 61–66.
[2] M. Jawurek, M. Johns, and F. Kerschbaum, “Plug-in privacy for smart metering billing,” in Privacy Enhancing Technologies. Springer, 2011, pp. 192–210.
[3] E. Al Kawasmi, E. Arnautovic, and D. Svetinovic, “Bitcoin-based decentralized carbon emissions trading infrastructure model,” Systems Engineering, vol. 18, no. 2, pp. 115–130, 2015.
[4] C. Efthymiou and G. Kalogridis, “Smart grid privacy via anonymization of smart metering data,” in Smart Grid Communications (SmartGridComm), 2010 First IEEE International Conference on. IEEE, 2010
[5] N. Chawla, G. Karakoulas, Journal of Artificial Intelligence Research “Learning from labelled and unlabeled data: an Empirical study across Techniques and domains” , 2005
[6] S. Nakamoto, “Bitcoin: A peer-to-peer electronic cash system,” 2008 [7] Ranno Aggarwal “Genetic Algorithm in Data Mining”, 2015
[8] N. S. Grid, “Introduction to nistir 7628 guidelines for smart grid cyber security,” Guideline, Sep, 2010. [9] A. Moise and J. Brodkin, “Ansi c12. 22, IEEE 1703, and mc12. 22 transport over ip,” 2011.