Analysis, Numerical Solutions, and Experiments. (Under the direction of Michael Shearer and Karen E. Daniels).
Granular materials segregate by particle size when subject to shear, as in avalanches. Particles roll and slide across one another, and other particles fall into the voids that form, with smaller particles more likely to fit than larger particles. Small particles segregate to the bottom of the sample, and larger particles are levered upward. These processes are known as kinetic sieving and squeeze expulsion. The evolution of the volume fraction of small particles (ratio of the volume of small particles to the total volume of the system) corresponds to the evolution of segregation in a binary mixture of particles and can be modeled by a nonlinear first order partial differential equation, provided the velocity or shear is a known function of position. In an avalanche, shear is approximately uniform in depth, however, in boundary driven shear, the velocity is nonlinear and a shear band forms adjacent to the boundary.
We explore size segregation with a laboratory experiment and by analyzing a model. We classify solutions to a fundamental initial boundary value problem for avalanche flow in two space dimensions akin to a two dimensional Riemann problem. We describe three solution types; the initial condition determines which solution occurs. We also modify the partial differential equation to model segregation in a system experiencing nonuniform shear.
by
Lindsay Bard Hilbert May
A dissertation submitted to the Graduate Faculty of North Carolina State University
in partial fullfillment of the requirements for the Degree of
Doctor of Philosophy
Applied Mathematics
Raleigh, North Carolina
2009
APPROVED BY:
Dr. Pierre A. Gremaud Dr. Mansoor A. Haider
Dr. Michael Shearer Dr. Karen E. Daniels
DEDICATION
BIOGRAPHY
Lindsay was born September 6, 1982, in Philadelphia, Pennsylvania, to Tim and Deb Hilbert. From a young age, she liked to climb and has been aiming high ever since. As a student at Upper Dublin High School, Lindsay was very studious and and participated in many different sports and activities. After graduation, she attended Franklin & Marshall College, where she continued earnest learning, played soccer, and was involved in a wide variety of other activities.
She intended to be a chemical engineer, and chemistry and math were on her fist semester schedule, but, thanks to AP credit, she placed out of first semester chemistry. Lindsay intended to return to chemistry in her second semester, but it wasn’t to be. First semester chemistry was replaced by a German class, and Lindsay ended up with a double major: Mathematics and German. The math major wasn’t a surprise; she had always enjoyed math. Lindsay wasn’t quite sure how she would use her mathematics major until her senior year, when she completed an independent study project under the direction of Annalisa Crannell. With Annalisa’s encouragement, Lindsay applied to graduate school and subsequently enrolled at NC State.
Lindsay was unsure whether she would pursue a degree in pure or applied mathe-matics, but, after taking classes from both curricula, she decided that she wanted to be an applied mathematician. In Spring 2006, Lindsay began an RA with Michael Shearer. She was once again able to combine her love of math and science, as her thesis work took her into the lab of Karen Daniels, who subsequently became her co-advisor.
ACKNOWLEDGMENTS I would like to thank
⋆ My advisors, Michael Shearer and Karen Daniels, without whom this work would not have been possible. Thank you for your guidance and patience and for sharing your knowledge.
⋆ My committee members, Pierre Gremaud and Mansoor Haider, for their encourage-ment and helpful suggestions.
⋆ The excellent professors at NC State. I learned so much from you. ⋆ The members of AMGSS for helping me improve my presentations.
⋆ The members of the Daniels Lab group, especially Laura and Kasey for their help with the experimental aspect of this work.
⋆ This research was supported by the National Science Foundation under grants DMS-0604047 and DMS-0636590.
⋆ The wonderful staff members, who have, on occasion, worked paperwork miracles. ⋆ Those who shaped my mathematical background before I arrived at NC State,
includ-ing the Franklin & Marshall mathematics department and Mr. Spatz.
⋆ My fantastic friends, here and elsewhere, for keeping me sane and making sure I didn’t work too hard.
⋆ The members of the soccer, volleyball, football, etc. teams – we always had fun... ⋆ The most important people in my life: my loving and supportive family. Thanks for
your continued encouragement.
TABLE OF CONTENTS
LIST OF FIGURES . . . vii
1 Introduction . . . 1
1.1 The Gray & Thornton Model . . . 2
1.2 Extensions of the Gray & Thornton Model . . . 4
1.2.1 The Two-Dimensional Classification Problem . . . 5
1.2.2 The Model Adapted to the Annular Couette Cell Geometry . . . . 6
1.3 The Couette Experiment . . . 8
1.4 Summary of the Thesis Chapters . . . 9
2 Introduction to Segregation in Granular Materials . . . 11
2.1 Overview of Granular Materials . . . 12
2.1.1 Description of Granular Materials . . . 12
2.1.2 The Early History of the Study of Granular Materials . . . 13
2.2 Introduction to Granular Segregation . . . 14
2.2.1 Granular Segregation Mechanisms . . . 15
2.2.2 Segregation in Industrial Processes . . . 16
2.3 Granular Segregation Research . . . 18
2.3.1 Experiments . . . 18
2.3.2 Computer simulations . . . 19
2.3.3 Modeling Static and Flowing Granular Materials . . . 20
2.4 Shear-Induced Segregation . . . 22
2.4.1 Segregation in Shear Cells . . . 23
2.4.2 Segregation in Experimental Flows, Avalanches, and Debris Flows . 24 2.4.3 Segregation in the Filling and Emptying of Silos and Hoppers . . . . 26
2.4.4 Segregation in Rotating Tumblers . . . 27
2.5 Velocity Profiles in Shear Flows . . . 31
2.6 Modeling Segregation in Granular Materials . . . 31
2.6.1 Segregation Models Based on Kinetic Theory . . . 31
2.6.2 Segregation Models Based on Hydrodynamics . . . 32
3 Two-dimensional Classification Problem . . . 35
3.1 Mathematical Preliminaries . . . 38
3.1.1 The Method of Characteristics . . . 38
3.1.2 Numerical Solutions to (3.0.3) . . . 42
3.2 Previous Investigations of Special Cases of Equation (3.0.3) . . . 43
3.3 Equations for Farfield Structures . . . 44
3.3.1 Shock OB : The Steady Shock Between ϕ=γ and ϕ= 1 . . . 45
3.3.3 Shock AC : The Moving Shock Between ϕ=β and ϕ=γ when γ < β 46 3.3.4 Rarefaction R : the Smooth Connection Between ϕ= γ and ϕ= β
When γ > β . . . 47
3.4 Nearfield Connections from the Farfield in Case I:γ < β . . . 48
3.4.1 The Point A . . . 49
3.4.2 Curve AB . . . 49
3.4.3 The Point B . . . 50
3.5 Nearfield Connections from the Farfield in Case II:β < γ . . . 51
3.5.1 The Point A . . . 52
3.5.2 Curve JA . . . 52
3.5.3 Case IIA: 0≤β < γ ≤(β−1)/e+ 1<1 . . . 54
3.5.4 Case IIB: γ >(β−1)/e+ 1 . . . 58
4 The Couette Experiment . . . 63
4.1 Experimental Setup . . . 64
4.2 Data Collection . . . 66
4.3 Data Processing . . . 70
4.3.1 Computing Considerations . . . 70
4.3.2 Determining the Locations of the Particles . . . 71
4.3.3 Tracks . . . 72
4.3.4 Challenges in Creating Particle Tracks . . . 72
4.3.5 From Particle Tracks to a Velocity Profile . . . 79
4.4 Determining the Shear Rate Profiles . . . 85
4.5 Long Time Behavior . . . 89
5 Modeling and Analysis of Segregation in the Couette Geometry . . . 92
5.1 A Model for Segregation in the Couette Geometry . . . 92
5.2 Characteristics and Shocks . . . 95
5.3 Model Analysis . . . 97
5.3.1 Case 1: Piecewise Linear Shear Rate . . . 98
5.3.2 Case 2: Smooth Shear Rate . . . 108
5.4 Existence of a Solution . . . 114
5.5 Differences Between Cases 1 and 2 . . . 114
6 Comparison Between Model Solution and Experimental Data . . . 116
6.1 The Proxy Height Formula . . . 117
6.1.1 The Packing Density . . . 118
6.2 Comparing the Model Solution to the Experimental Data . . . 121
7 Conclusions. . . 125
7.0.1 Future Directions . . . 126
LIST OF FIGURES
Figure 1.1 Schematic diagram of experiment. . . 7
Figure 3.1 Initial and boundary conditions. . . 37
Figure 3.2 Farfield solutions.. . . 38
Figure 3.3 Case I. . . 51
Figure 3.4 Breaking wave. . . 60
Figure 3.5 Case IIA. . . 61
Figure 3.6 Case IIB. . . 62
Figure 4.1 Experimental apparatus and schematic . . . 65
Figure 4.2 Digital images of the particles. . . 66
Figure 4.3 Height of granular material. . . 68
Figure 4.4 Plate height for run used to calculate velocity profile. . . 71
Figure 4.5 Before and after cleaning the data. . . 73
Figure 4.6 Remove nonphysical small particles. . . 75
Figure 4.7 Remove multiple particle identifications of a single particle. . . 77
Figure 4.8 Small particle trajectories. . . 78
Figure 4.9 Six velocity profiles. . . 79
Figure 4.10 Choosing ∆t(j) . . . 81
Figure 4.11 Velocity distributions. . . 83
Figure 4.12 Temporal inhomogeneity. . . 84
Figure 4.14 Ranges for experimentally determined parameters. . . 88
Figure 4.15 Time series of height of system for a long time run . . . 90
Figure 4.16 Visualization of the secondary instability. . . 91
Figure 5.1 Two flux functions. . . 97
Figure 5.2 Solutions of the initial boundary value problem. . . 98
Figure 5.3 Swallowtail surface . . . 104
Figure 5.4 Swallowtail cross-sections. . . 105
Figure 5.5 Projection of swallowtail surface. . . 106
Figure 5.6 Flux functions and characteristics fork0 < k1.. . . 108
Figure 5.7 zvs. ϕ(z, t) for several values oft.. . . 109
Figure 5.8 Characteristics and phase portrait. . . 110
Figure 6.1 Packing density function. . . 119
Figure 6.2 Exploration of the parameter space. . . 122
Chapter 1
Introduction
In 2005, the 125th anniversary issue ofScience[1] listed finding a general theory of the dynamics of granular materials among 125 important open questions in science. Gran-ular materials are collections of discrete macroscopic solid particles. Common examples include sand, soil, coal, rocks, glass beads, tapioca, rice, and poppy seeds [22]. We consider the individual grains to be the microscopic scale of the system and observe phenomena in-cluding flow, mixing, and segregation on the macroscopic scale. Granular matter is therefore classified as a multiscale complex system [120]. It is not yet understood how the microscopic interactions can be scaled up to provide a theory for the macroscopic behaviors. In fact, there are many open theoretical questions, and all aspects of granular materials are subject to continuing research.
1.1
The Gray & Thornton Model
In 2005, Gray and Thornton [61] formulated a partial differential equation model for size segregation using binary mixture theory, which assumes that small and large par-ticles occupy every point in the system simultaneously (see [123] for detailed description of mixture theory in other contexts). The variable of interest in the model is the volume fraction of small particles (the ratio of the volume of small particles to the total volume of the system),ϕ,which is a function of space, x= (x, y, z),and time,t.The volume fraction of large particles is then given by 1−ϕ. The Gray-Thornton model is developed within the framework of an avalanche, with the coordinate system imposed on a chute inclined at angle ζ with the horizontal. Thex-axis points down the chute, the y-axis is in the cross-slope direction, and thez-axis is normal to the slope. The bulk velocities in thex-,y-, and z-directions are u, v, andw, respectively.
An important modeling assumption is that segregation occurs only in the direction normal to the base of the avalanche, and, therefore, the velocity in the normal direction has two components: the bulk velocity and the segregation velocity. The equations for the normal constituent velocities are derived by satisfying the conservation of momentum equation for each constituent:
ρνDνu
ν
Dt =−∇p
ν+ρνg+βν, ν=s, l, (1.1.1)
wheresandlindicate small and large particles,u= (u, v, w),andDν/Dt=∂/∂t+uν· ∇is
the material derivative. Also,ρν,uν, andpν are the overlapping partial densities, velocities,
and pressures, respectively, ρνg is the gravitational force, and βν is the interaction force, that is, the force exerted by the other constituent on phaseν.In standard mixture theory, variables are either intrinsic or partial. An intrinsic variable is independent of the volume fraction of small or large particles, while partial variables are related to intrinsic variables via a linear volume fraction scaling. The velocity field is an exception and is identical in the partial and intrinsic cases. The bulk density and pressure are related to the constituent quantities by p =ps+pl =ϕsp+ϕlp and ρ =ρs+ρl =ϕsρ+ϕlρ. The forces βs and βl are equal in magnitude but in opposite directions. In this model, the intrinsic densities are equivalent and constant and therefore equivalent to the bulk density.
not shared in proportion to the local volume fraction of each constituent. When the small particles percolate through the large particles, they support less than their share of the overburden pressure and the large particles must carry a larger proportion of the load [164, 180]. The proportion of the hydrostatic load carried by large and small particles is governed by the equations fs = ϕs −Bϕs(1−ϕs) and fl = (1−ϕs) +Bϕs(1−ϕs),
respectively, where B is a nondimensional factor governing the magnitude of the pressure perturbation away from hydrostatic. In deriving the model, Gray and Thornton assume that the interaction force βν, has a form motivated by Darcy’s law for the percolation of fluids through a porous medium, and involves the coefficient of interparticle drag, c, and the deviation of the corresponding constituent velocity from the bulk velocity. Using these relationships and (1.1.1), the equations for the constituent normal velocities are
ϕνwν =ϕνw+ (fν −ϕν)(g/c) cosζ, ν =s, l. (1.1.2) The pressure scalingfν governs the motion of the particles relative to the bulk normal flow: if fν > ϕν, the particles will rise, if fν < ϕν, the particles will fall, and if fν =ϕν, there will be no motion of the particles relative to the bulk.
Substitutingfs and fl into (1.1.2) yields
wl−w= +qϕs, ws−w=−qϕl,
where the mean segregation velocity q is given byq = (B/c)gcosζ. These equations imply that the large particles move upward at a velocity proportional to the volume fraction of small particles, the small particles move downward at a velocity proportional to the volume fraction of large particles, and segregation stops when ϕs = 0 or ϕs = 1. The constituent
down- and cross-slope velocities are assumed to be equal to the bulk down- and cross-slope velocities.
Both the large and small particles must also satisfy the conservation of mass equa-tion:
∂ρν
∂t +∇ ·(ρ
νuν) = 0, ν =s, l. (1.1.3)
Using (1.1.3) for small particles along with the constituent scalings and the formulae for the constituent velocities, the partial differential equation model for the volume fraction of small particlesϕs is given by
∂ϕs ∂t +
∂ ∂x(ϕ
su) + ∂
∂y(ϕ
sv) + ∂
∂z(ϕ
sw)− ∂
∂z(qϕ
Further, let ϕs = ϕ, so that ϕl = 1−ϕ. Gray and Thornton assume that the flow is incompressible (∇ ·u = 0), the hydrostatic pressure is distributed evenly through the depth, and the density is uniform and constant. Then (1.1.4) becomes
∂ϕ ∂t +u
∂ϕ ∂x +v
∂ϕ ∂y +w
∂ϕ ∂z −
∂
∂z(qϕ(1−ϕ)) = 0. (1.1.5) For consistency with avalanche models, the variables are nondimensionalized by standard avalanche scalings:
∂ϕ ∂t +u
∂ϕ ∂x +v
∂ϕ ∂y +w
∂ϕ ∂z +Sr
∂
∂z (ϕ(ϕ−1)) = 0, (1.1.6)
where Sr is the constant nondimensional segregation number that depends on the mean
segregation velocity, the magnitude of the a typical downslope velocity, and the typical length and height of the avalanche. Thus the mean segregation velocity is constant in the avalanche model.
1.2
Extensions of the Gray & Thornton Model
1.2.1 The Two-Dimensional Classification Problem
Here we formulate fundamental problems akin to two-dimensional Riemann prob-lems (see, for example, [101, 181]) for the Gray & Thornton model. We describe three types of solutions, and the parameter values for the initial and inflow conditions determine which of the three solutions will occur. We consider a shear cell with parallel upper and lower boundaries filled with granular material and impose linear bulk velocity, parallel to the upper and lower boundaries, by shearing the upper boundary. The bulk horizontal velocity depends on the distance from the lower boundary. There is no bulk velocity in the direction normal to the parallel plates, and segregation occurs only in the normal direction. Further, scaling x andt bySr,which effectively setsSr= 1,equation (1.1.6) reduces to
∂ϕ
∂t +u(z) ∂ϕ
∂x + (2ϕ−1) ∂ϕ
∂z = 0. (1.2.1)
We take
u(z) =α+ 2(1−α)z, (1.2.2)
where 0≤α≤1 and the parameter α controls the amount of shear.
1.2.2 The Model Adapted to the Annular Couette Cell Geometry
We modify the Gray-Thornton model to captue size segregation under nonuniform shear. We conduct a corresponding experiment in the Couette cell geometry, which is described in Section 1.3. In the Couette cell, we make the following designations: the x-direction is the azimuthal x-direction, they-direction is across the width of the sample in the shear cell, and the z-direction is normal to the bottom moving boundary that drives the bulk motion of the sample in thex-direction, as shown in Figure 1.1. We again assume that segregation occurs only in the z-direction. Further, we assume that the sample is uniform in the x- and y-directions, so that the volume fraction of small particles depends on z and t only. The experiment was designed to study the effect of a nonconstant shear rate. The simplifying assumptions allow us to focus on the effect of a nonconstant shear rate and calculate explicit solutions to the model for certain choices of q and the form of the shear rate. In addition to our simplifying assumptions, we allow that the bulk velocity u(z) is a nonlinear function of the distance from the bottom plate, and the mean segregation velocity is proportional to the shear rate. In the general case, we consider the segregation term in (1.1.5) to have the form∂z∂ (sa(z)f(ϕ)),wheres >0 is the segregation rate parameter, which sets the time scale for the evolution ofϕ. Further,a(z) =|u′(z)
|is a smooth monotonically decreasing function of z and f(ϕ) : [0,1] → R is the convex flux function, which satisfies f(0) =f(1) = 0, a condition corresponding to the physical limits of the dependent variable ϕ. Based on these assumptions, (1.1.5) becomes
∂ϕ
∂t +u(z) ∂ϕ ∂x +
∂
∂z(sa(z)f(ϕ)) = 0. (1.2.3)
The second term in the above equation disappears when we assume that ϕ is uniform in x. We focus on an initial condition that corresponds to the one-dimensional experimental configuration, as shown in Figure 1.1,
ϕ(z,0) =ϕo(z) =
0, 0< z < z0,
1, z0 < z <1,
(1.2.4)
that is, a layer of large particles below a layer of small particles. The boundary conditions, namely ϕ(0, t) = 1 and ϕ(1, t) = 0,again guarantee no flux at the boundaries.
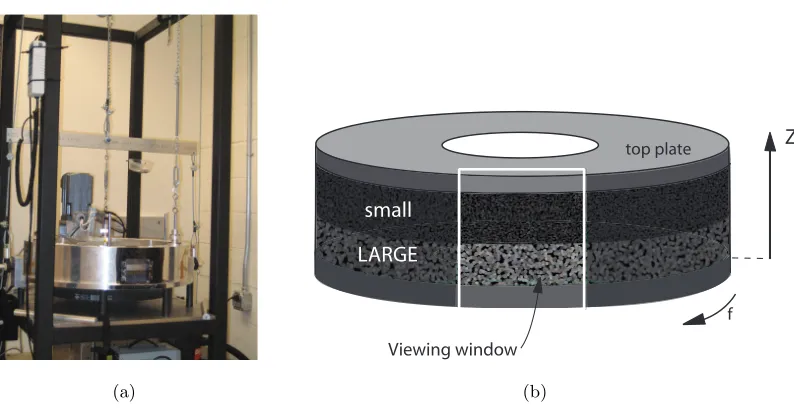
Top plate sits on top of the sample
Figure 1.1: Schematic diagram of the experimental setup and axes for the model in (1.1.5).
solution to the initial boundary value problem as far as possible. For the explicit analysis, we choose f(ϕ) =ϕ(ϕ−1),as in the Gray-Thornton model and our first modification. We consider two cases for a(z) :
Case 1: Piecewise Constant Shear Rate
a(z) =
k0, 0< z < zc,
k1, zc < z <1,
(1.2.5)
withk0> k1 >0.
Case 2: Smooth Shear Rate
a(z) =a0e−z/λ, 0< z <1. (1.2.6)
[63] form for the shear rate in an annular Couette cell. In both cases, the solution consists of a rarefaction fan and reflected shocks. We contribute to the theory of conservation laws by using the method of characteristics in nonstandard ways. In Case 1, a discontinuity in the shear rate occurs atz=zc,the material interface. The material interface behaves as a
stationary shock through which the characteristics in the rarefaction fan are transmitted as a simple wave; the characteristics speed up as they cross the interface. When the reflected shock reaches the material interface, it is transmitted through the interface and meets the other reflected shock. In Case 2, the quantity a(z)f(ϕ) is conserved along characteristics, which are not straight.
1.3
The Couette Experiment
The experiment takes place in an annular Couette cell. This geometry is con-venient for studying size segregation in granular materials because we can study the long time behavior of the system. The Gray-Thornton model was developed for the avalanche geometry, in which shear is imparted by gravity, which is a body force. In this experiment, the shear rate is non-constant because it is induced by a moving boundary and transmitted by interparticle contacts only. The shear drops off dramatically a few layers above the bottom plate. We can test whether the extension of this model to the Couette geometry is reasonable by comparing the solution to the initial boundary value problem for the partial differential equation to the experimental data.
the continuum model. Using the velocity profile, we calculate the shear rates for Cases 1 and 2.
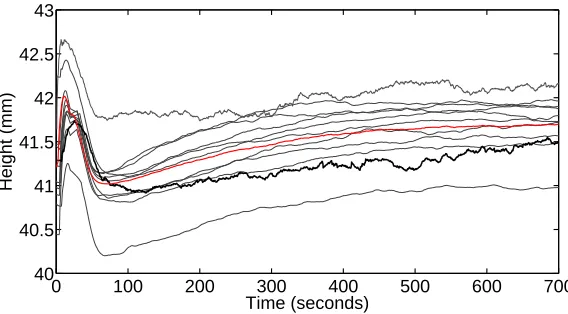
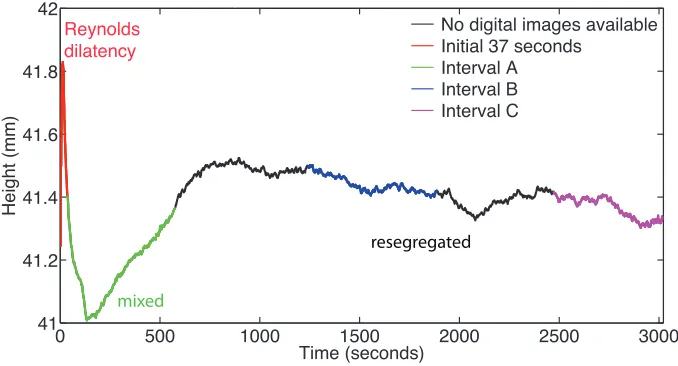
When the bottom plate begins to rotate, the sample must dilate (Reynolds dila-tency) to accommodate particle motion. As rotation continues, the particles next to the bottom plate move faster than those further up in the sample. As the large particles slide and roll over one another, spaces open between the large particles and the small particles can fall into the gaps, thus leading to mixing. This process is known as kinetic sieving. As the small particles move downward, the large particles are levered upward in a process called squeeze expulsion. This leads to a layer of large particles above a layer of small particles, and the sample is resegregated.
We cannot directly measure the volume fraction of small particles in the experi-ment, but the model solution gives us the volume fraction of small particles, ϕ.We convert the volume fraction of small particles to a proxy height, which we compare to the height of the top plate. We observe that the model captures the mixing and resegregation phe-nomena, but does not capture the initial dilatency. There are other differences between the model prediction and experimental data that are not captured with the simple model. One notable difference between the model and the experiment is that the model predicts com-plete resegregation in finite time, while the experiment never reaches a fully resegregated state.
1.4
Summary of the Thesis Chapters
In this thesis, we investigate particle size segregation by analyzing a partial differ-ential equation using both explicit solutions and numerical methods, conducting an experi-ment in an annular Couette cell, and validating the model by comparing the model solution to experimental data.
yet lead to a unified theory for the dynamics of granular materials.
In Chapter 3, we explore basic constructions for conservation laws by considering the first modification to the Gray-Thornton model, as described in Section 1.2.1. We use the method of characteristics to describe the shocks and rarefactions that form the farfield solution to the model equation and then the nearfield connections between the shocks and rarefactions. We contribute to the theory of conservation laws by classifying solutions based on parameter values. We can explicitly solve almost all pieces of all of the cases, leaving only one piece of the construction as an open problem.
Chapters 4, 5, and 6 concern the second modification to the Gray-Thornton model, as described in Section 1.2.2. In Chapter 4, we describe the experimental setup and data collection procedure. Further, we detail the process by which we extract the velocity profile from the digital images and explain how we obtain the shear rate parameters. We use these parameters in Chapter 5 to visualize the solutions to the partial differential equation model for the Couette cell geometry, as described in Section 1.2.2. We develop the model solutions in Cases 1 and 2, where we choose specific functions to describe the segregation velocity. In both cases, we solve an initial value problem with piecewise constant initial conditions, and we explore nonstandard constructions relating to the method of characteristics. In Case 1, we consider a discontinuous shear rate, that is, the partial differential equation has a piecewise constant coefficient, and in Case 2, the characteristics are not straight. Chapter 6 includes an explanation of the function used to convert the volume fraction of small particles calculated in the model solution to a proxy height. We then compare the proxy height and the experimental height data.
Chapter 2
Introduction to Segregation in
Granular Materials
Humans have been aware of granular segregation for centuries, using the phe-nomenon to their advantage in many activities such as the cleaning of grains [41, 93] and gold dust mining [41]. On the other hand, segregation hinders mixing, an objective in many current industrial processes, and, consequently, segregation can have negative economic im-pacts. Granular materials factor prominently into the global economy. In the year 2000, worldwide annual production of granular materials and aggregate solids was ten billion met-ric tons; coal, cement, construction materials, sand, and gravel accounted for more than five billion metric tons. Processing grains and aggregates uses approximately ten percent of the energy consumed worldwide, and only water is more manipulated than granular materials [42]. In fact, particulate-based products and related services account for one trillion dollars paid to companies in the United States [147]. Despite the prominence and economic impact of granular materials, the processing technology has not been optimized. A United States government report (mentioned in [42] but not cited) calls currently employed processing techniques, some of which date to the nineteenth century, obsolete, and calls for advanced understanding of granular materials, flow, and behavior, such as mixing and segregation.
including practical examples of segregation in industrial contexts, and modeling flow and segregation in granular materials. We also provide an overview of experiments and numerical simulations relating to segregation in granular materials under shear.
2.1
Overview of Granular Materials
2.1.1 Description of Granular Materials
Granular materials are defined as collections of discrete macroscopic solid grains large enough that Brownian motion is negligible [9], thus ordinary temperature does not impact granular materials on the macroscopic scale [74]. The only velocity scale is imposed by macroscopic flow [74]. Interactions between grains dissipate energy, owing to friction and inelastic collisions [74]. Further, some authors (see [22], for example) exclude loose materials from the class of granular materials by requiring the solids to be in contact with one another most of the time. A granular material is designated as noncohesive if there are no attractive forces between the particles and thus the shape of the system is determined by the container or external boundaries or by gravity. Describing a granular material as dry implies that interstitial fluid, such as air or water, is ignored when determining static and flow properties of the system [74].
Granular materials have properties similar to all three phases of matter: solids (a pile of sand), liquids (when poured from a hopper), and gasses (when strongly agitated), but are also unlike any state of matter [84]. A pile of sand behaves like a solid if the slope of the pile is less than the angle of repose [74], and granular materials can sustain shear like a solid up to a certain point [81], but macroscopic phenomena can be affected by particle arrangement in the granular solid [74]. Granular materials can also flow like liquids. A granular material in a static pile can be made to flow like a liquid by tilting the pile past a critical angle. In this case, flow is only in the boundary layer, which is different from an ordinary liquid [74]. Flowing granular materials, such as those flowing out of a hopper can jam into a solid-like state. A granular material is similar to dense gas because both are made of discrete particles with negligible cohesion forces, but the collisions in granular materials are inelastic, unlike those in a dense gas [74].
than the increase in thermal energy that results from the energy dissipation. Consequently, without additional energy input, a grain at rest will remain at rest [74]. Further, segregation occurs without entropic or energetic benefit [144], since the system rearranges only when energy is supplied to the system. While solid, liquid, and gas dynamics and interactions are described by well-developed theories, there is no unified theory to describe the variety of phenomena observed in granular materials.
We will make some basic assumptions about granular materials that hold true in the remainder of this thesis unless otherwise noted. First, we assume that the effect of gravity dominates interparticle forces (such as van de Waals, electrostatic, air drag, and capillary forces due to surface tension). This restricts us to particles larger than 500µm, [42]. Also, granular mixtures considered in this thesis are noncohesive and dry and the flow is dense, meaning that particles make simultaneous prolonged contacts with several neighbors. These contacts are noncollisional and result in little momentum transfer [52]. When we say a mixture is binary or bidisperse, it means the mixture consists of two types of particles that differ in one physical property, such as size or denstiy.
2.1.2 The Early History of the Study of Granular Materials
The study of granular materials goes back several centuries.1 The earliest recorded mention of granular flows was made by Lucretius (ca. 98-55 BC), a poet and natural philoso-pher of ancient Rome. He wrote: “One can scoop up poppy seeds with a ladle as easily as if they were water and, when dipping the ladle, the seeds flow in a continuous stream.” The hourglass (sand clock) was one of the first applications of granular flows, and hour-glasses were in common use by the late thirteenth century [152]. L. da Vinci (1452-1519) conceived a simple experiment demonstrating the laws of dry friction, but it wasn’t until the late eighteenth century that C. de Coulomb (1736 - 1806) wrote an important (and still frequently cited) paper, proposing the idea of static friction [74]. His experimental conclusions about the equilibrium of earthen embankments and the stability of stone struc-tures and other edifices, which led to his laws of dry friction between solids, would later be extended to granular materials, providing a foundation for the physics of granular ma-terials. In 1857, W. Rankine (1820-1872) considered the theoretical implications of friction in granular materials. Through these investigations, he developed the principals of passive
and active states, which remain valid today. In the late nineteenth and early twentieth centuries, I. Roberts, H. Janssen, and J. Strutt (Lord Rayleigh) individually investigated the equilibrium distribution of forces in a granular medium stored in a silo. O. Reynolds (1842-1912) contributed to the theory of granular materials with his observations about dilatency of granular materials under shear (1885) and analysis of sloped embankments.
Since the early twentieth century, and especially since the 1950’s, the topic of granular materials has become an increasingly popular field involving an ever increasing number of scientists, engineers, and mathematicians. The field has also expanded greatly into many subfields. Review articles and books by Aranson and Tsimring [9], Campbell [24], Duran [42], Hutter, Svendsen, and Rickenmann [72], Jaeger, Nagel, and Behringer [74], Kudrolli [93], Mehta, [118], Meier, Lueptow, and Ottino [120], Pouliquen and Chevoir [142], Tang and Puri [170], and Williams [186] give an idea of the breadth and depth of the field of granular materials.
2.2
Introduction to Granular Segregation
the impact of granular segregation in industrial processes, and in Section 2.3 we describe three techniques for investigating granular segregation.
2.2.1 Granular Segregation Mechanisms
First, let us consider a system with particles of two sizes. Physical experiments and computer simulations have produced evidence that under vibration the phenomenon of vertical segregation with large particles on top is due to kinetic sieving [148, 149] and convection [89, 160]. Kinetic sievingis also known as percolationorgeometrical void filling. The smaller particles fall into the gaps between large particles and end up on the bottom, while the large particles rise to the top, as the smaller particles settle beneath them. The process by which the large particles are levered upward is sometimes calledsqueeze expulsion [154]. These mechanisms are also responsible for segregation in systems under shear.
Convectionis a transport of particles due to the mean flow [134]. In a convection cycle, particles rise in the center of the system and descend in a thin stream along the wall. Particles that are wider than the thin stream remain at the top of the sample, ultimately leading to segregation. Wall friction is critical to this mechanism [188] and the convection rolls are formed as a result of the difference in packing density during the upward and downward motions of the vibration [177]. The most well-known example of vertical segregation with large particles above small particles is theBrazil Nut Effect(BNE).
One can also observe vertical segregation in which the small particles end above the large particles. Since this configuration can occur with the same exact particles as for which vertical segregation with large particles above small particles occurs, the difference must be in the energy input. When a system is fluidized, that is, the material goes from a solid solid-like state to a dynamic fluid-like state due to the injection of a fluid or high frequency, large amplitude vibration [72], the segregation pattern is opposite that seen in BNE [34, 35]. For this reason, this phenomenon is sometimes know as the Reverse Brazil Nut Effect(RBNE). Segregation by liquid fluidization has been used successfully in several industries, including the separation of solids of different sizes or densities in the mining industry (which has been employed since the early nineteenth century) and wastewater treatment plants [45].
to the bottom and the lighter ones rise to the top [76] due to buoyancy. This can occur under shear or vibration. When the particles differ in both size and density, the particle diameter ratio and the particle density ratio, as well as the driving frequency and amplitude determine if the system exhibits BNE or RBNE [16]. For example, when the larger particles are more dense and the vibrational frequency is low, the large, dense particles will continue upward once launched, whereas a less dense particle would have been forced back downward by collisions with other particles. In this case, inertia causes segregation [71, 161]. It is even possible for a system to transition between BNE and RBNE by varying the external excitation; this reinforces the idea that granular systems can be very sensitive to small changes [16].
Horizontal segregation in granular systems with particles of different sizes occurs in heap or pile formation. The responsible mechanism is inertia, in this case with respect to air drag: the speed of smaller particles in free flight is reduced more by air drag than the speed of larger or heavier ones [38]. Therefore, the larger particles segregate to the outer regions of the heap. If the angle of repose, which is defined as the angle of inclination to the horizontal of the free surface of a heap of the granular material, differs between the two types of particles, the particles with a smaller angle of repose segregate further down the slope [107, 108].
In a partially filled rotating drum, two segregation patterns can occur. Radial segregation, in which the denser or smaller particles concentrate in a central region close to the free surface [43] is similar to vertical segregation in which the larger or less dense particles are found on top. As the drum rotates, a series of small avalanches occurs, and with each avalanche, the geometrical void filling mechanism is responsible for segregation. Axial segregation is a phenomenon where dissimilar solids in a partially filled horizontally rotating cylinder separate into alternating bands perpendicular to the axis of rotation [134].
2.2.2 Segregation in Industrial Processes
a well-mixed sample of several components is desired. Segregation defeats mixing, and unacceptable variations in product quality or handling characteristics can occur [25], so limiting segregation is an important industrial challenge. Moreover, designing an apparatus to mix granular materials, that is, disperse all components given any initial distribution [139], is not a trivial task, since even slightly heterogeneous granular materials tend to segregate with energy input. There are many pieces of equipment or methods that can help control segregation (see [179]), however inadequate sampling, extended mixing times, and other factors can still lead to catastrophic variations in the mixture.
Segregation problems have long been reported in a wide variety of industries. In the early to mid twentieth century, the detrimental effects of segregation in the preparing, transporting, storing, and burning of coal [21] was an important area of study. As a result of segregation, coal utilization was less efficient, the potential for spontaneous combustion increased, and the concentration of impurities adversely affected the performance of appli-ances. Segregation also affects the pharmaceutical, chemical, powdered metal, glass [25], agricultural, ceramics, energy, mining, pollution control [147], and construction materials and plastics manufacturing [135] industries. In the chemical processing industry, the in-tegrity of products such as dry-cell batteries, disposable diapers, water-filter cartridges, swimming pool chemicals, cake mixes, and roofing shingles [25] can be harmed by seg-regation. The economic impact of segregation can be significant. In 2004, unacceptable variations resulting from segregation cost a typical glass manufacturing plant $600,000 per year per furnace [25].
for a pharmaceutical product can change the final product [127], an approved batch manu-facturing process will not change [128]. While this approach had been effective, Muzzio et al. [128] suggest that the rise in potent and specific drugs will find the status quo approach inadequate, and an empirical method will be needed.
Particle size segregation can be seen in both human and animal foods. When cake mixes had non-uniform amounts of ingredients other than flour, sugar, and shortening, due to segregation in a storage bin, the cake heights varied from 1 to 12 inches in a baking test [54]. If a box of cereal is shaken, the largest particles rise to the top. In a can of mixed nuts, the Brazil nuts rise to the top under vibration, thus giving rise to the colloquial name Brazil Nut Effect. The quality of eggs that commercial hens lay can be affected by particle size segregation. Hens feed preferentially on large particles and large particles rise when mash feed segregates. Therefore, the hens’ diet may be nutrient deficient, since the nutrients are generally much smaller than the other components [11, 169]. Choosing constituents with similar properties, adding a large amount of the smaller sized ingredients, mixing particles with a small amount of water or oil, or modifying the feeding system to continually mix the mash feed could reduce segregation [11, 25, 32, 169].
2.3
Granular Segregation Research
There are three primary ways to study granular segregation: physical experimenta-tion, numerical simulaexperimenta-tion, and analysis of mathematical models. Laboratory experiments probing granular segregation are conducted in many different geometries, using particles with a wide variety of characteristics. Several types of energy input are also considered. The scope of experiments investigating segregation in granular materials is much too large to even begin to summarize here. The breadth of numerical simulations is similarly pro-hibitive. In this section, we summarize data collection techniques relevant to the study of size segregation in shear flows. Further, we introduce computer simulation methods and mathematical models for static and flowing granular materials.
2.3.1 Experiments
one wants to determine the surface velocity of the flow [105]. We use this technique in our experimental work; we need the velocity to determine the input parameters for the model. Particle tracking could also be used to determine the trajectories of the surface particles, recording how the particles move from an initial state to the segregated state. However, surface images do not indicate the dynamics of the interior of the system. One major difficulty in studying three-dimensional granular systems is that one cannot see into system. In order to combat this deficiency, [95, 183] used positron emission particle tracking, [132] used dual photon gamma-ray tomography, [126, 129, 139, 183] used magnetic resonance imaging (MRI), [126] used X-rays, and [37] developed a magnetic particle tracking system to study the motions of particles in the interior of the system and the state of the system at locations other than the outer wall. Many of these solutions are prohibitively expensive.
2.3.2 Computer simulations
Another way to combat the inability to see the interior of three dimensional gran-ular systems is to model the system using computer simulations. Early particle system simulations considered the solids as a continuum, borrowing ideas from computational fluid dynamics (CFD). However, for larger particles or denser flow, this is a poor approximation. The discrete element method (DEM), also known as particle dynamics (PD) or molecular dynamics (MD) simulation, based on molecular dynamics for liquids and gases [140] may provide better models than CFD [99], and can be used to model physical experiments or situations unaccessible via physical experimentation. Computer simulations are often useful for investigating the effect of parameters that are difficult to tune in physical experiments (see, for example, [20, 51, 91, 166]). One such parameter is therestitution coefficient, which is a fractional value representing the ratio of relative velocities before and after impact. A restitution coefficient of 1 implies perfectly elastic collisions and a restitution coefficient of 0 implies perfectly inelastic collisions, that is, the particle stops upon collision [62]. Also, granular materials do not scale well (a small system and large system with the same ratio of components under the same conditions may exhibit radically different behavior), so MD simulations can be used to investigate behavior in a full-sized system before building the apparatus.
for all particles to determine the bulk flow of the granular material [140], was developed by Cundall and Strack in 1979 [33]. At that time, the systems studied were very small (generally fewer than 1000 particles) and often two dimensional. Increased computing power has allowed the study of systems with more than one million of particles in three dimensional complex geometries with non-ideal particle shapes [31]. In some cases, force-based DEM is problematic (for example, a fixed restitution coefficient may not be realistic or the frictional forces may be hysteretic) [9], but force-based DEM is generally robust [140] and often used successfully for the analysis of dense flows. Gallas, et al. [50] reported the first three-dimensional molecular dynamics simulation of particle segregation by shaking. They were the first to be able to reproduce both the upward or downward movement of a large intruder, depending on the frequency of the vibration, in a bed of small particles.
2.3.3 Modeling Static and Flowing Granular Materials
Models for granular materials must be able to capture the solid-like, liquid-like and gas-like behaviors exhibited by granular systems. Constitutive equations based on kinetic theory for collisional rapid flows and soil mechanics for slow plastic flows are generally accepted for modeling granular materials behaving as a gas or a solid, respectively, however there is no unified theory for granular systems flowing like a liquid [84], even for the simple case of a monodisperse system [93]. Whether modeling static or flowing granular materials, one must decide if a continuum or discrete model is more appropriate. Continuum models are computationally faster and are useful for studying the impact of parameters, while discrete models are often more appropriate for studying long-range interactions between particles and interactions of particles with the system (boundaries or a paddle or blade, for example) [120].
Flowing granular systems can be modeled in many ways; here we focus on con-tinuum models based on kinetic theory and hydrodynamics. The kinetic theory approach to modeling the rapid flow of granular materials is based on kinetic theory for dense gases, where colliding particles interact through impulsive binary collisions, do not participate in long-lasting contacts, and the granular particles are analogous to excited molecules in a dense gas [187]. The assumption of collision interaction (not prolonged contacts) means that this method is better suited to rapidly flowing, less dense granular systems, but not systems where diffusion dominates [46], and we recall that inelastic particle collisions and collisions with the boundary dissipate energy [187, 69], so an external input of energy is re-quired. The hydrodynamic approach to modeling granular flows is based on direct analogy with the shallow water equations, that is, the moving mass is long and shallow. Further these models assume that interparticle contacts are sustained and solid concentrations are high. These models are relatively simple and successfully capture qualitative features of flow such as shocks and dead zones [60].
Jenkins and Savage [79] formulated a kinetic theory model for the flow of identical, smooth, nearly elastic, spherical particles that interact with their neighbors only through binary collisions. They derived balance laws for mass, linear momentum, and fluctuation energy using probability distribution functions for the velocity of a single particle and like-lihood of binary collisions. If the probability distribution functions have simple, physically plausible forms, one can use this model to solve boundary value problems. Jenkins and Savage tested their model against experimental data and found agreeing qualitative and quantitative predictions, and Lun et al. [106] similarly developed a kineitc theory model for the flow of slightly inelastic smooth spherical particles.
averag-ing smears out the basal layer, in which much of the interestaverag-ing behavior occurs. They also assume a Coulomb-like basal friction law, which relates to the shear traction to the normal pressure at the base and involves the friction angle between the flowing material and the bed. Based on these assumptions, Savage and Hutter formulate equations for the conserva-tion of mass and linear momentum for an incompressible system. Further, they formulate boundary conditions at the base and free surface. Manipulating the conservation equations, Savage and Hutter obtain equations for the height of the flow and the transversely averaged streamwise velocity. These equations differ from the shallow water equations in the scaling: in the shallow-water equations, the phenomenon is governed by surface waves; in granular avalanches the phenomenon is governed by free fall. The model at the heart of this thesis is a continuum hydrodynamic model.
2.4
Shear-Induced Segregation
Section 2.4.1, we describe the results of experiments in shear cells.
2.4.1 Segregation in Shear Cells
There are three types of shear cells commonly used in laboratory experiments: parallel plate shear cells and annular shear cells. In a parallel plate shear cell, one or both of a pair of parallel walls provides shear at the boundary. When two walls move, they move in opposite directions. In an annular shear cell, the sidewalls are concentric cylinders. In experiments with this apparatus, rotation occurs at one or both of the sidewalls or one or both of the horizontal boundaries, thus providing shear to the sample. A third type of shear cell is the split-bottom cell. In a shear cell, the material experiences nonuniform shear and the behavior is influenced by factors such as the ability of the walls to transmit momentum to the particles, relative width of the shear layer, effective shear rate, and particle properties [102].
Much attention has been given to monodisperse flows in shear cells (see, for ex-ample, [49, 68, 69, 70, 94, 155, 172, 178]), and several conclusions are relevant to binary mixtures as well. The shear rate increases as the moving wall velocity increases [69] and the density profile and azimuthal velocity profile are nearly exponential with dependence on distance from the moving boundary in an annular shear cell with a moving inner cylinder [178]. One of the most interesting phenomena observed in shear cells is the formation of a shear band, which marks an area of flow, material failure and energy dissipation [126].
the sample. Savage and Sayed [155] studied a mixture of 30% small particles and 70% large particles (by weight) with a size ratio near 3 in an annular shear cell and found that at the end of an experimental run, the small particles had collected in the outer bottom corner of the trough and the large particles were found predominantly in the inner upper corner. They explain this pattern as a combination of centrifugal and gravitational forces, meaning that the small particles preferentially moved down and outward when voids were available (percolation). The coarser particles are then pushed in the opposite direction (squeeze expulsion). It is also relevant to note that initial velocity profiles differ greatly from packing to packing, suggesting an initial time period in which a shear band has not yet formed. The duration of this initial period depends on the details of the initial packing of granular materials.
2.4.2 Segregation in Experimental Flows, Avalanches, and Debris Flows While avalanches have been of interest for a long time, only recently have scientists established that avalanche shape depends sensitively on the thickness of the layer and the inclination angle [9]. Natural flows (rock and snow avalanches and debris flows) and their behaviors are of interest due to the potential for destruction and the hope that predicting the path and characteristics of a geological flow could lead to better methods of protection [60, 72, 168]. In granular free-surface flows, the segregation pattern, in which grain size increases toward the top of the bed, is known asinverse grading.
heights demonstrated increased and decreased runout lengths, respectively, which agrees with geological event observations [100].
Physical experiments have also demonstrated that the behavior and final state of a bidisperse mixture of grains in a gravity-driven free-surface flow depends on particle characteristics and boundary conditions. Thomas [174] studied flow down a rough inclined plane and observed segregation (large particles on top), mixing (large particles at the surface and within the sample), and reverse segregation (large particles distributed within the sample but none on top), with transitions between the regimes as the difference in particle sizes increased. Goujon et al. [55] found that, as a result of size segregation, the small particles concentrate at the bottom of the flow and final deposit, while the large particles are found at the free surface and on the lateral and front borders of the flow. These features, known as the outline effect and interface effect, depend on the relative friction of each particle type with the plane and the interaction between layers of different sized particles. Varying the relationships of the particle properties can suppress the outline effect (when large particles have smaller basal friction), narrow the flow (when larger particles have larger basal friction), and decrease runout length and width (when there is a large percentage of large particles). For intermediate values of large particle percentage, one observes the formation of fingers and an increased deposit length. Interface effects can lead to the trapping of large beads and the dragging ahead of a layer of small beads by a layer of large beads [55]. The outline effect has also been observed in rock avalanche deposits [48].
2.4.3 Segregation in the Filling and Emptying of Silos and Hoppers Segregation in the filling and emptying of silos and hoppers can have catastrophic effects in many industrial processes, so a huge amount of research into segregation during these processes has been conducted. One of the early academic papers on particle segre-gation was written by Brown in 1939 [21]. When coal is poured onto a pile, such as when filling a bunker, it forms a cone. The small particles are found in the core of the cone and large particles appear in the top layers and around the base [21] because large particle roll more easily over small particles than vice versa [116]. Williams [184] finds the same patterns in the filling of silos and hoppers, and suggests that size is the most important segregation-causing property (over density, shape, and roughness). Computer simulations in two [116, 117] and three [117] dimensions, which assume that deposited particles follow a path of steepest descent on the heap until they reach a local minimum, the bottom surface, or a vessel wall, support the patterns observed by Brown and Williams. Further, the extent of segregation increases as the fraction of small particles decreases and the particle size ratio increases [116].
Segregation pattern formation in bunkers, silos, and hoppers has two industrially relevant consequences. First, one cannot withdraw a representative sample from the heap. Second, a bunker, silo, or hopper filled by pouring that empties with funnel (core) flow discharge exhibits a discharge dominated first by small particles from the central channel and then the larger particles. This flow pattern leads to difficulties such as blockages, incomplete emptying, and segregated discharge [109, 163, 185]. Mass flow hoppers perform better than funnel flow hoppers since in a mass flow hopper the entire body of material is in motion, material discharge follows a first in-first out pattern, and the discharge is well mixed [185]. Further, the discharge from mass flow hoppers is insensitive to fill method [110]. Williams [185] and Jenike (see [36]) are known as pioneers in the hopper design industry, and Jenike’s method is still accepted today [36]. However, hopper flow characteristics and the impact of segregation can be studied using DEM, and this offers a direct approach to designing hoppers with a minimum number of experiments [36].
than the small particles. However, when the smaller grains are more faceted, the mixture segregates into two different regions. These patterns occur because large grains tend to segregate downhill while small grains segregate uphill and rounded grains segregate uphill while more faceted grains segregate downhill. Complete segregation occurs when these two mechanisms work together, while stratification results from these mechanisms trying to act in opposition [107].
Particle characteristics such as ratio of diameters of particles and mass fraction [151], as well as operating conditions such as feed rate of mixture into hopper [151], fill method, hopper characteristics, and duration of experimental run [86] have direct impact on the segregation pattern observed during discharge. For further examples of experiments probing the impact of varying particle characteristics and operating conditions see [17, 18, 25, 26, 86, 96, 156, 162, 170, 171, 186].
2.4.4 Segregation in Rotating Tumblers
Radial Segregation
Radial segregation in a bidisperse mixture is relatively straightforward. In each surface avalanche, the small particles segregate to the bottom of the avalanche and the large particles rise to the top. This is repeated many times, leading to the core of small particles. Kawaguchi, et al. [85] verified, using magnetic resonance imaging (MRI), that radial segregation occurs throughout a rotating cylinder and is not merely an end wall effect. However, there are more large particles in a cross-section at the end wall than in interior cross-sections, so one could overestimate the ratio of large to small particles in the cylinder if observations are only made at the end wall [85]. Dury and Ristow [43] used DEM simulations to show that radial segregation occurs for arbitrarily small differences in particle size and becomes faster and more pronounced as the size difference increases. Further, they find the highest level of segregation when the cylinder is slightly more than half full [43]. Turner and Nakagawa [176] found a phenomenon analogous to the RBNE: if the rotation rate is increased a sufficient amount, a core of large particles forms. Further, a homogeneous mixture can be produced by alternating between slow and fast rotation rates. When particles in a quasi-2D circular tumbler differ in size and density, Jain et al. [76], showed two different behaviors can occur. When the small particles are also more dense, percolation and buoyancy both contribute to segregation and radial streaks or a core will form, depending on the exact size ratio. However, when percolation and buoyancy are opposing forces (small particles are less dense), one sees a transition from a core of denser particles to a core of smaller particles. Further, if the particle size ratio is larger than the ratio of densities, mixing is observed. Using the DEM in a three-dimensional cylinder, Dury and Ristow [44] show that when smaller particles also have higher density, radial segregation is enhanced, but when the smaller particles are also less dense, it is possible to obtain a well-mixed final state.
Axial Segregation
the most mysterious phenomena in granular materials. Axial segregation can occur when particles differ only in size [167]. One proposed stimulant for the formation of axial bands is end wall friction. Pohlman et al. [138] studied the effects of end wall friction in granu-lar tumblers. Material adjacent to the end walls experiences a streamwise surface velocity decrease due to friction, however the material just inward from the end walls flows faster than the material at the center of a long cylindrical tumbler, and an axial velocity occurs near the end walls. The end-wall friction can initiate axial band formation or induce curved interfaces between bands of segregated particles near the end walls in bidisperse systems [138].
induce axial segregation. Further, it is possible to characterize whether a system will tend towards a mixed or axially segregated state. Bielenberg et al. [15] developed an expression for the Pe`clet number of the system, which describes the effects of system parameters on steady-state behavior, analogous to the way in which the Reynolds number in fluid flow describes the transition between laminar and turbulent flow in tubes. A high Pe`clet value indicates that a system will tend towards a segregated state, and a low Pe`clet number suggests that the system will tend towards a well-mixed state.
Segregation in other rotating geometries
Rotated quasi-two dimensional square, triangular, and other polygonally shaped tumblers containing bidisperse mixtures with varying fill levels produce a variety interesting segregation patterns. Jain, Ottino, and Lueptow [75] studied the mixing or segregation of beads differing in both size and density in a quasi-two-dimensional square tumbler. As in circular tumblers [44], mixing is observed when the larger particles are also denser, specifically when the ratio of the particle diameters is greater than the fourth root of the ratio of the masses [75]. See [28, 29, 56, 58, 66, 75, 87, 112, 113, 121, 119, 122, 190] for examples of the segregation patterns seen in polygonally shaped tumblers with various fill levels.
2.5
Velocity Profiles in Shear Flows
The velocity profile with respect to depth of the flow is an important feature of a granular flow that depends on the geometry of the flow and impacts the segregation pattern. In the case of relatively slow flow down an inclined plane, the velocity profile is roughly linear, with the largest velocity at the free surface and little slip at the boundary [63, 189]. With faster granular chute flow, the velocity profile tends to be nonlinear and concave with a slip velocity at the base [189]. In an annular shear cell, the velocity profile has been widely observed to be exponential, with the largest velocity next to the moving boundary [47, 63, 125, 178]. Further, some period of time is needed before the velocity profile settles into a steady state. These findings can be incorporated into modeling efforts.
2.6
Modeling Segregation in Granular Materials
Kinetic theory and hydrodynamics have both been used as the basis for modeling segregation in granular materials. In Section 2.6.1 we briefly discuss segregation modeling in rapid flows based on kinetic theory. Kinetic theory is limited by the assumptions of small volume fractions and the absence of prolonged rolling and sliding contacts by the grains [57]. Thus hydrodynamics-based models are often more appropriate. In Section 2.6.2 we describe the segregation models of of Bridgwater et al. [19] and Savage and Lun [154]. In Section 1.1, we presented the segregation model developed by Gray and Thornton [61], which is at the heart of this thesis.
2.6.1 Segregation Models Based on Kinetic Theory
per-formed better for size differences than for mass differences. Dolgunin et al. [39] include the influence of solid phase concentration gradient on mass segregation. Arnarson and Willits [10] used the thermal diffusion factor to characterize species segregation in a binary mix-ture of smooth, nearly elastic spheres. Liu et al. [103] described solids species segregation in steady-state Couette flows using the thermal diffusion factor and granular energy gra-dients. Both groups found that larger, denser particles concentrate in cooler regions and segregation increases as the magnitude of gravity force relative to the mixture temperature gradient increases. Also, segregation is maximized when one species is dilute in the other.
Farrell et al. [46] formulated a kinetic theory model for a granular flow of a binary mixture of smooth, inelastic, spherical particles. In this case, velocity distribution functions for both single particles and pairs of particles are needed. Kinetic theory models have been extended to consider slightly dissipative spheres assuming energy equipartition [10, 78] and the effects of particle size and density on the overall behavior of a granular flow assuming a non-Maxwellian velocity distribution and energy non-equipartition [3, 73]. Comparing numerical solutions of kinetic theory equations with MD simulations and experiments, Xu et al. [187] conclude that in single-species flows, the agreement is very good, but in binary flows, kinetic theory overestimates segregation, especially at high particle volume fractions.
2.6.2 Segregation Models Based on Hydrodynamics
Segregation models based on hydrodynamics, specifically the Gray-Thornton model, which was described in Section 1.1, are the basis for the model developed in Chapter 5 of this thesis.
The Bridgwater, Foo, and Stephens Model
mixture is dilute and that there exists an infinite supply of small particles above the failure zone.
The Savage & Lun Model
Savage and Lun [154] model kinetic sieving in avalanche flow using statistical mechanics and information entropy ideas in a 1988 paper. They consider a steady two-dimensional flow of a mixture of large and small spherical particles of equal density down a roughened inclined chute. Assuming the flow takes place in layers in motion relative to one another as a result of the mean shear and the flow is relatively slow, so that particle velocity fluctuations due to particle collisions are small, there are two mechanisms that cause particles to move between layers. The first, which is called the random fluctuating sieve, is a void-filling mechanism that depends on gravity and relative particle size. As a result of rearrangements, there will be voids at any time, and if a void is large enough, a particle from the layer above can fall into the void. Since the probability of finding voids that accommodate small particles is greater than that of finding voids that accommodate large particles, the tendency is for small particles to segregate to the bottom of the flow. To quantify kinetic sieving and determine if a particle in an upper layer will fall down into a void in the adjacent layer involves information about the distribution of the sizes of the void spaces in the layer beneath. Using the maximum entropy approach of Jaynes [77], which says that one will observe whatever is most probable, they determine the configuration of voids that will maximize the information entropy. They find that the percolation velocities of both large and small particles are negative (towards the bed of the chute). The second mechanism, squeeze expulsion, relies on the imbalance of contact forces on a particle, which squeeze a particle out of its layer into an adjacent one. This mechanism is neither size nor gravity preferential, however large particles are levered upward to satisfy the condition that no overall mass flux can occur in the direction normal to the inclined chute. Savage and Lun refer to high speed videos of their first experiment to support this conclusion.
can calculate the distance downslope at which complete segregation occurs, which provides a useful comparison to experimental results. This result has been generalized by Shearer et al. [159]. In their second experiment, Savage and Lun used splitter plates to separate polystyrene beads flowing down an inclined chute into containers based on particle depth within the flow. They tested their theory against experimentally observed behaviors and concluded that the theory is reasonable for the relatively slow flow regime.
Savage and Lun also note the limitations of their theory. The theory is also based on a two-dimensional analysis (the particles are disks), but the experiments use spheres in a three-dimensional chute. Also, this theory depends on the presence of a shearing motion and does not account for spontaneous percolation effects due to gravity (and in the absence of shear) that are observed when the small particles are much smaller than the large particles. For mixtures with a small ratio of small to large particle diameters, this theory would underpredict the percolation velocity. Further, the dilute limit analysis is valid only when the shear rate is constant. Savage and Lun suggest that it would be interesting to examine the effects of velocity profile on the segregation process. The experimental configuration dictates the velocity profile, so one cannot impose a velocity profile. Using a bidisperse mixture in the Couette geometry, we extract the velocity profile and determine two appropriate shear rate profiles (see Chapter 4). In Chapter 5, we consider the form of the shear rate on the predicted segregation process.
Chapter 3
Two-dimensional Classification
Problem
The two-dimensional classification problem involves a partial differential equation in two space dimensions and time. The choice of parameter values determines the struc-ture of the solution, and we characterize the solutions based on parameter values, thereby classifying the solutions to the partial differential equation into three groups.
Recall the partial differential equation for the volume fraction of small particles described in Section 1.1, equation 1.1.4:
∂ϕs ∂t +
∂ ∂x(ϕ
su) + ∂
∂y(ϕ
sv) + ∂
∂z(ϕ
sw)
−∂z∂ (qϕsϕl) = 0. (3.0.1) In this two-dimensional classification problem, we consider motion in the (x, z)-plane, where the bulk velocity is strictly in thex-direction (sow= 0) and only depends onz,the distance from the bottom boundary. Segregation occurs in thez-direction, normal to the bulk flow. We also assume that the shear rate,Sr,is a positive constant, that is, the velocity is a linear
function of z.Therefore, (3.0.1) with ϕs=ϕand ϕl= 1−ϕ reduces to
∂ϕ
∂t +u(z) ∂ϕ ∂x −Sr
∂f(ϕ)
∂z = 0, (3.0.2)
where u(z) is a linear function. In order to carry explicit calculations as far as possible, we will consider the case wheref(ϕ) =ϕ(1−ϕ).Scalingx and t bySr (effectively setting
first order hyperbolic partial differential equation: ∂ϕ
∂t +u(z) ∂ϕ ∂x −
∂
∂z(ϕ(1−ϕ)) = 0. (3.0.3)
Further, we take
u(z) =α+ 2(1−α)z, (3.0.4)
where 0≤α ≤1 and the parameterα controls amount of shear. Whenα = 0, the system experiences simple shear and whenα= 1,we observe plug flow.
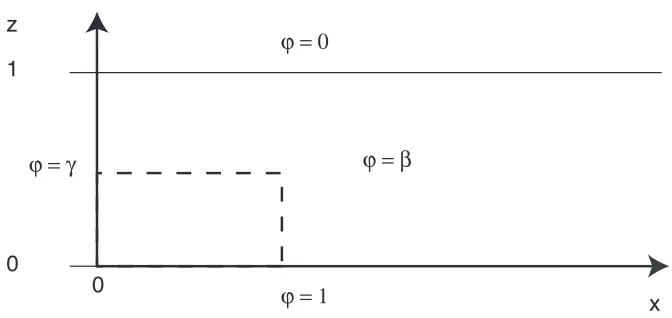
We consider a region in the (x, z)-plane with −∞ < x <∞ and 0 ≤z ≤1. We begin with the initial condition
ϕ(x, z,0) =
β, x >0, 0< z <1,
γ, x <0, 0< z <1, (3.0.5) with 0≤γ, β ≤1,which is shown in Figure 3.1. The boundary conditions are
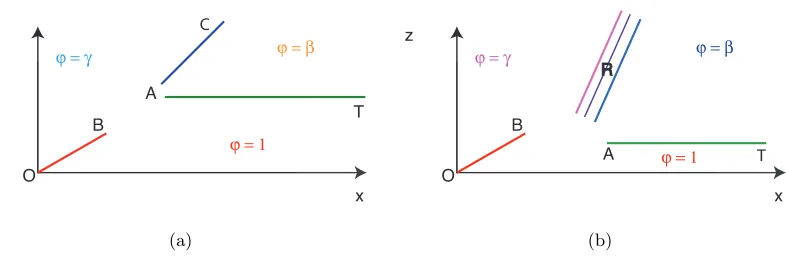
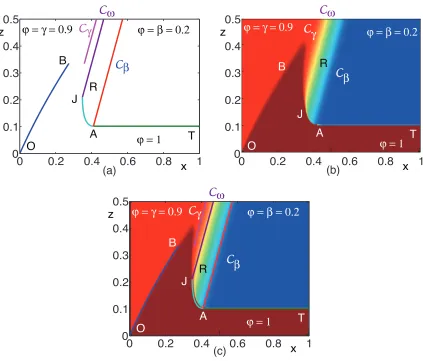
ϕ(x,0, t) = 1, ϕ(x,1, t) = 0, −∞< x <∞. (3.0.6) We callx= 0 the inflow interface. Further, we consider only the structures that form in the region adjacent to the bottom boundary and only for a short time from initiation of shear. We employ the method of characteristics, which is described in Section 3.1.1, to solve (3.0.3) with (3.0.4), (3.0.5), and (3.0.6). We find that the solution consists of three farfield features:
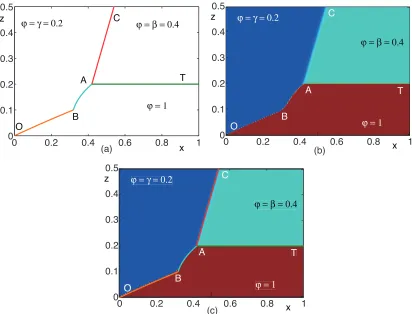
I. A steady shock between ϕ=γ and ϕ= 1,which joins the origin to a point B,so we call this shock OB. The explicit formula for OB is derived in Section 3.3.1. When γ = 1,there is no steady shock, and whenγ = 0,the steady shock is horizontal along thex-axis.
II. A horizontal shock between ϕ= 1 and ϕ =β, which joins the points we call A and T.We call this shockAT,and its construction is given in Section 3.3.2. Ifβ = 0,the horizontal shock is stationary and remains on the boundaryz = 0. Ifβ = 1, there is no horizontal shock.