IJEDR1402127
International Journal of Engineering Development and Research (www.ijedr.org)2083
Outlier Analysis Using Frequent Pattern Mining
(LOF Algorithm)
Ankur N. Yagnik
1, Maulik V Dhamecha
21M.Tech (CE) Research Scholar, RK University, Rajkot, Gujarat, India
2 Assistant Professor, Department of Computer Engineering, RK University, Rajkot, Gujarat, India
1[email protected], 2 [email protected]
________________________________________________________________________________________________________
Abstract - An outlier in a dataset is an observation or a point that is considerably dissimilar to or inconsistent with the remainder of the data. Detection of such outliers is important for many applications and has recently attracted much attention in the data mining research community. In this paper, we present a new method to detect outliers by discovering frequent patterns (or frequent item sets) from the data set. The outliers are defined as the data transactions that contain less frequent patterns in their item sets. We define a measure called FPOF (Frequent Pattern Outlier Factor) to detect the outlier transactions and propose the Find FPOF algorithm to discover outliers. The experimental results have shown that our approach outperformed the existing methods on identifying interesting outliers.
Keywords - Frequent pattern mining ,Association rules ,Data mining research, Applications, FPOF, abnormalities,
discordant, deviants, anomalies.
I.INTRODUCTION
An outlier is a data point which is significantly different from the remaining data. Hawkins formally defined [20] the concept of an outlier as follows: “An outlier is an observation which deviates so much from the other observations as to arouse suspicions that it was generated by a different mechanism.”Outliers are also referred to as abnormalities, discordant, deviants, or anomalies in the data mining and statistics literature. In most applications, the data is created by one or more generating processes, which could either reflect activity in the system or observations collected about entities. When the generating process behaves in an unusual way, it results in the creation of outliers. Therefore, an outlier often contains useful information about abnormal characteristics of the systems and entities, which impact the data generation process. The recognition of such unusual characteristics provides useful application-specific insights.
The output of an outlier detection algorithm can be one of two types
Most outlier detection algorithm output a score about the level of “outlierness” of a data point. This can be used in order to determine a ranking of the data points in terms of their outlier tendency. This is a very general form of output, which retains all the information provided by a particular algorithm, but does not provide a concise summary of the small number of data points which should be considered outliers.A second kind of output is a binary label indicating whether a data point is an outlier or not. While some algorithms may directly return binary labels, the outlier scores can also be converted into binary labels. This is typically done by imposing thresholds on outlier scores, based on their statistical distribution. A binary labeling contains less information than a scoring mechanism, but it is the final result which is often needed for decision making in practical applications.
II.RELATEDWORKANDRESEARCHMOTIVATION
Local Outlier Factor (LOF) [Breunig et al. 1999], [Breunig et al. 2000]
Motivation - Distance-based outlier detection models have problems with different densities
IJEDR1402127
International Journal of Engineering Development and Research (www.ijedr.org)2084
Fig 1 Example of an image with acceptable resolution
Parameters ε and π cannot be chosen so that o2 is an outlier but none of the points in cluster C1 (e.g. q) is an outlier – Outliers based on kNN-distance
kNN-distances of objects in C1 e.g. q) are larger than the kNN-distance of o2 Solution: consider
– relative density
Reachability distance
– Introduces a smoothing factor
reach dist ( p,o) max{k distance(o),dist( p,o)}
IJEDR1402127
International Journal of Engineering Development and Research (www.ijedr.org)2085
The outlier detection problem itself is not well defined and none of the existing definitions are widely accepted. Although several techniques have been proved useful in solving some outlier detection problems, the following problems still remain to be further explored and motivate our research.Firstly, the existing techniques try to detect outliers using the distance of points in the full dimensional space. Recent research results show that in the high dimensional space, the concept of proximity may not be qualitatively meaningful [17]. Due to the curse of dimensionality, these approaches are not appropriate for discovering outliers in a high dimensional space. Furthermore, they failed to find outliers in the subsets of dimensions. The method proposed by Aggarwal and Yu [4] considers data points in a local region of abnormally low density as outliers to conquer the curse of dimensionality. The main problem of their approach is that the outlier factor of each data object is determined only by the projection with the lowest density of data, without considering the effect of other projections. Moreover, their algorithm has a high computational cost. Wei et al. [7] introduced an outlier mining method based on a hyper-graph model to detect outliers from a categorical dataset. In that method, since all data points are constructed as the vertices of a hyper-graph, again it is computationally intensive.
Secondly, most studies on outlier detection are focused only on identifying outliers. In real applications, the reasons on why the identified outliers are abnormal also need to be given. Such descriptions should be intuitive and provide the user with some hints for further actions. Knorr and Ng [18] discussed the concept of intentional knowledge of distance-based outliers in terms of the subset of attributes. Their algorithms traverse all the sub-dimensions to find distance-based outliers and then the intentional knowledge. This search approach is intensive in computation and cannot provide an overall interpretability for different sub-spaces in reasoning which causes the abnormality.
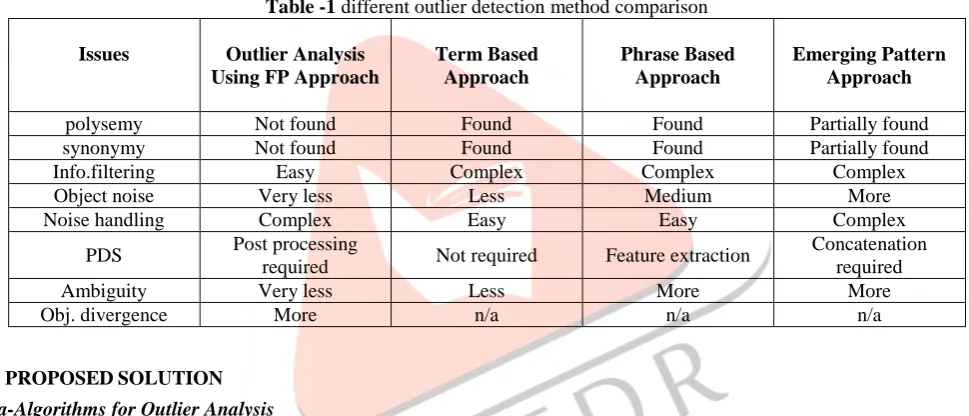
Outlier Method Comparison
Table -1 different outlier detection method comparison
Issues Outlier Analysis
Using FP Approach
Term Based Approach Phrase Based Approach Emerging Pattern Approach
polysemy Not found Found Found Partially found
synonymy Not found Found Found Partially found
Info.filtering Easy Complex Complex Complex
Object noise Very less Less Medium More
Noise handling Complex Easy Easy Complex
PDS Post processing
required Not required Feature extraction
Concatenation required
Ambiguity Very less Less More More
Obj. divergence More n/a n/a n/a
III.PROPOSEDSOLUTION
Meta-Algorithms for Outlier Analysis
In many data mining problems such as clustering and classification, a variety of meta-algorithms are used in order to improve the robustness of the underlying solutions. For example, in the case of the classification problem, a variety of ensemble methods such as bagging, boosting and stacking are used in order to improve the robustness of the classification [146]. Similarly, in the case of clustering, ensemble methods are often used in order to improve the quality of the clustering [20]. Therefore, it is natural to ask whether such meta-algorithms also exist for the outlier detection problem. The answer is in the affirmative, though the work on meta-algorithms for outlier detection is often quite scattered in the literature, and in comparison to other problems such as classification,not as well formalized. In some cases such as sequential ensembles, the corresponding techniques are often repeatedly used in the context of specific techniques
The different meta-algorithms for outlier detection will be discussed in the following subsections. There are two primary kinds of ensembles, which can be used in order to improve the quality of outlier detection algorithms: In sequential ensembles, a given algorithm or set of algorithms are applied sequentially, so that future applications of the algorithms are impacted by previous applications, in terms of either modifications of the base data for analysis or in terms of the specific choices of the algorithms. The final result is either a weighted combination of, or the final result of the last application of an outlier analysis algorithm. For example, in the context of the classification problem, boosting methods may be considered examples of sequential ensembles.
In independent ensembles, different algorithms, or different instantiations of the same algorithm are applied to either the complete data or portions of the data. The choices made about the data and algorithms applied are independent of the results obtained from these different algorithmic executions. The results from the different algorithm executions are combined together in order to obtain more robust outliers.
Algorithm SequentialEnsemble(Data Set: D Base Algorithms: A1 . . .Ar)
begin
j = 1;
IJEDR1402127
International Journal of Engineering Development and Research (www.ijedr.org)2086
past executions;Create a new data set fj(D) from D based on results from past executions;
Apply Aj to Dj ; j = j + 1;
until(termination);
report outliers based on combinations of results from previous executions;
end
IV.EXPERIMENTALRESULTS
The Density Based LOF algorithm
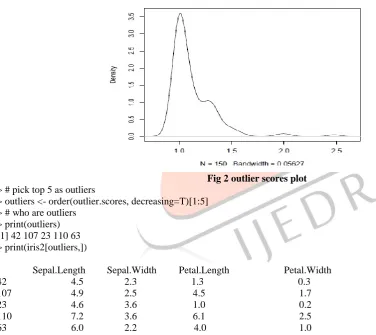
LOF (Local Outlier Factor) is an algorithm for identifying density-based local outliers [Breunig et al., 2000]. With LOF, the local density of a point is compared with that of its neighbors. If the former is signi.cantly lower than the latter (with an LOF value greater than one), the point is in a sparser region than its neighbors, which suggests it be an outlier.
Function lofactor(data, k) in packages DMwR and dprep calculates local outlier factors using the LOF algorithm, where k is the number of neighbors used in the calculation of the local outlier factors.
Fig 2 outlier scores plot
> # pick top 5 as outliers
> outliers <- order(outlier.scores, decreasing=T)[1:5] > # who are outliers
> print(outliers) [1] 42 107 23 110 63 > print(iris2[outliers,])
Sepal.Length Sepal.Width Petal.Length Petal.Width 42 4.5 2.3 1.3 0.3 107 4.9 2.5 4.5 1.7 23 4.6 3.6 1.0 0.2 110 7.2 3.6 6.1 2.5
63 6.0 2.2 4.0 1.0
Visualize Outliers with Plots
Next, we show outliers with a biplot of the first two principal components > n <- nrow(iris2)
> labels <- 1:n
> labels[-outliers] < - "."
IJEDR1402127
International Journal of Engineering Development and Research (www.ijedr.org)2087
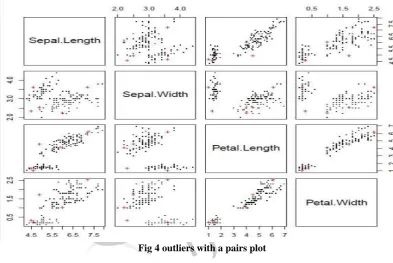
Fig 3 outliers with a biplot of the first two principal components We can also show outliers with a pairs plot as below, where outliers are labeled with "+" in red.
Fig 4 outliers with a pairs plot
V. CONCLUSIONSANDFUTUREWORK
IJEDR1402127
International Journal of Engineering Development and Research (www.ijedr.org)2088
VI.ACKNOWLEDGEMENT
The comments and suggestions from the guides and reviewers greatly improve the paper. We thank Prof. Of my university for their help with the data analysis and for reviewing this research paper.
REFERENCES
[1] Agarwal R, Aggarwal CC, Prasad VVV (2011) A tree projection algorithm for generation of frequent itemsets. J Parallel
Distribut Comput 61:350–371
[2] Aggarwal CC, Yu PS (1998) A new framework for itemset generation. In: Proceedings of the 1998 ACM symposium on
principles of database systems (PODS’98), Seattle,WA, pp 18–24
[3] Agrawal R, Gehrke J, Gunopulos D, Raghavan P (1998) Automatic subspace clustering of high dimensional data for data
mining applications. In: Proceedings of the 1998 ACM-SIGMOD international conference on management of data (SIGMOD’98), Seattle, WA, pp 94–105
[4] Agrawal R, Imielinski T, Swami A (1993) Mining association rules between sets of items in large databases. In: Proceedings of the 1993ACM-SIGMODinternational conference on management of data (SIGMOD’93), Washington, DC, pp 207–216
[5] Agrawal R, Shafer JC (1996) Parallel mining of association rules: design, implementation, and experience. IEEE Trans
Knowl Data Eng 8:962–969
[6] Agrawal R, Srikant R (1994) Fast algorithms for mining association rules. In: Proceedings of the 1994 international conference on very large data bases (VLDB’94), Santiago, Chile, pp 487–499
[7] Y. Zhang and M.J. Zaki, “EXMOTIF: Efficient Structured Motif Extraction,” Algorithms for Molecular Biology, vol. 1,
pp. 21-38, 2006.
[8] F. Fassetti, G. Greco, and G. Terracina, “Mining Loosely Structured Motifs from Biological Data,” IEEE Trans. Knowledge and Data Eng., vol. 20, no. 11, pp. 1472-1489, Nov. 2008.
[9] L. DS, “Transcription Factors: An Overview,” Int’l J. Biochemistry and Cell Biology, Vol. 29, no. 12, pp. 1305-1312,
1997.
[10] R.S. Tsay, Analysis of Financial Time Series, first ed., Wiley-Interscience, Oct. 2001 [8]AsaiT, AbeK,Kawasoe S, ArimuraH, SatamotoH,Arikawa S (2009) Efficient substructure discovery from large semi-structured data.
[11] R. Agrawal and R. Srikant, “Fast algorithms for mining association rules”, Proc. of the 20th Very Large Data Bases International Conference, (2011), pp. 487-499, Santiago, Chile.
[12] Ravi Kumar, Prabhakar Raghavan, Sridhar Ra-jagopalan, and Andrew Tomkins. Trawling the web for emerging cyber-communities. Computer Networks,31(11-16):1481{1493, 1999.
[13] Heikki Mannila and Hannu Toivonen. Levelwise search and borders of theories in knowledge discovery. Data Mining and Knowledge Discovery, 1(3):241{258, 2009}
[14] Nicolas Pasquier, Yves Bastide, Ra_k Taouil, and Lot_Lakhal.. Information Systems, 24(1):25{46, 2004}
[15] Gerd Stumme, Ra_k Taouil, Yves Bastide, Nicolas Pasquier, and Lot_ Lakhal. Computing iceberg con-cept lattices with t. Data & Knowledge Engineering,42(2):189{222, 2002.
[16] Takeaki Uno, Tatsuya Asai, Yuzo Uchida, and Hiroki Arimura. An e_cient algorithm for enumerating closed patterns in transaction databases. In Discovery Sci-ence, pages 16{31, 2004.
[17] J. Han, J. Pei, Y. Yin and R. Mao, “Mining frequent patterns without candidate generation: a frequent-pattern tree approach”, Data Mining and Knowledge Discovery, (2004), Vol. 8, No.1, pp. 53–87.
[18] J. Pei, J. Han, andW.Wang. Constraint-based sequential pattern mining in large databases. [19] X. Yan, J. Han, and R. Afshar. CloSpan: Mining closed sequential patterns in large datasets.
[20] M. Zaki. SPADE: An efficient algorithm for mining frequent sequences. Machine Learning, 40:31–60,2001. [21] G. M. Landau and J. P. Schmidt. An algorithm for approximate tandem repeats.
[22] F. Masseglia, F. Cathala, and P. Poncelet. The PSP approach formining sequential patterns.
[23] A.M. Carvalho, A.T. Freitas, A.L. Oliveira, and M.-F. Sagot, “A Highly Scalable Algorithm for the Extraction of Cis-Regulatory Regions,” Proc. Asia-Pacific Bioinformatics Conf. (APBC), pp. 273-282, 2005.
[24] Y. Zhang and M.J. Zaki, “EXMOTIF: Efficient Structured Motif Extraction,” Algorithms for Molecular Biology, vol. 1, pp. 21-38, 2006.
[25] F. Fassetti, G. Greco, and G. Terracina, “Mining Loosely Structured Motifs from Biological Data,” IEEE Trans. Knowledge and Data Eng., vol. 20, no. 11, pp. 1472-1489, Nov. 2008.
[26] L. DS, “Transcription Factors: An Overview,” Int’l J. Biochemistry and Cell Biology, Vol. 29, no. 12, pp. 1305-1312, 1997.
[27] Agrawal R, Imielinski T, Swami A (1993) Mining association rules between sets of items in large databases. In: Proceedings of the 1993ACM-SIGMODinternational conference on management of data (SIGMOD’93), Washington, DC, pp 207–216
[28] Agrawal R, Shafer JC (1996) Parallel mining of association rules: design, implementation, and experience. IEEE Trans Knowl Data Eng 8:962–969 [29]Agrawal R, Srikant R (1994) Fast algorithms for mining association rules. In: Proceedings of the 1994 international conference on very large data bases (VLDB’04), Santiago, Chile, pp 487–499 [29] AsaiT, AbeK,Kawasoe S, ArimuraH, SatamotoH,Arikawa S (2009) Efficient substructure discovery from large
semi-structured data.
[30] R.S. Tsay, Analysis of Financial Time Series, first ed., Wiley-Interscience, Oct. 2001