Deeply Virtual Compton Scattering on the Neutron: JLab
Exper-iment E08-025
Meriem BENALI1,2,3,a, Malek MAZOUZ2,3, Helene FONVIEILLE1
1Laboratoire de Physique Corpusculaire Clermont-Ferrand, IN2P3, 63177 Aubière Cedex, France 2Faculté des Sciences de Monastir, 5000, Tunisia
3For the Hall A DVCS collaboration
Abstract.
This paper gives the preliminary results of the experimental cross section for deeply vir-tual Compton scattering on the neutron (en→enγ). The E08-025 experiment was per-formed at Jefferson Lab Hall A. We measured the (D(e,eX−H(e,eγ)X) unpolarized cross section and we extracted, for the first time, a non-zero contribution of (neutron-DVCS+ coherent-deuteron-DVCS) atQ2=1.75
GeV2and
xB=0.36.
1 Introduction
The electromagnetic probe is a very important tool to investigate the properties of the nucleon. This technique has been used to measure the nucleon form factors by elastic scattering [1] and the par-tons distribution functions through inclusive deep inelastic scattering [2]. While elastic scattering allowed access to spatial distributions of charge and current in the nucleon, the deep inelastic scat-tering provides information about parton’s longitudinal momentum and helicity distributions in the nucleon. Unfortunately, these two separate informations do not allow multi-dimensional description of the nucleon, any spatial information remains inaccessible in inclusive DIS. In the mid-90’s, a new theoretical framework has been developed, namely the generalized parton distributions (GPDs) [3–5] , which relates the elastic form factors and the ordinary parton distributions. In addition, these ob-servables give information about the angular momentum of partons which is an important element to solve the "spin crisis" problem [4, 6]. Indeed, the longitudinal projection of the nucleon spin (=1/2) is written according to Jaffe an Manohar’s decomposition as [7]:
1/2= ΔΣ
2 + ΔG+Lq+Lg
whereΔΣis the intrinsic spin contribution of quarks which is measured (ΔΣ≈ 0.34) [8, 9],ΔG
is the gluons spin contribution and is also determined [9, 10] andLq,Lgare respectively the orbital
momentum of quarks and gluons wich are unknown so far. However, Ji [4] demonstrated that the GPDs give access to the quarks (and gluons) angular momentum contribution to the nucleon’s spin (Ji’s sum rule):
1.
Figure 1.Handbag diagram for the DVCS process.
Motivated by the importance of these observables, different DVCS experiments were performed. The first Beam spin asymmetries were measured by HERMES [11] and CLAS [12]. The H1 [13] and ZEUS [14] collaborations measured the DVCS cross section at lowxB. The first measurements of DVCS cross section in the valence quark region were performed at JLAB Hall A [15]. The first extraction of DVCS on the neutron and the first experimental constraint on the GPD E was obtained at JLab Hall A [16]. DVCS beam-spin asymmetries and target spin asymetries were determined in JLab Hall B using CLAS [17, 18]. The E08-025 experiment was performed at JLab Hall A in 2010 in order to measure the n-DVCS cross section, which is sensitive to the GPD E (the less constrained GPD). The data were taken at fixedQ2 =1.75GeV2andx
B =0.36 but at two beam energiesEbeam=4.45GeV andEbeam = 5.54GeV. In this experiment, 15 cm liquid deuterium (D2) and hydrogen (H2) targets
are used. The photon electroproduction on a deuterium target can be decomposed into: coherent
d(e,eγ)dand incoherentp(e,eγ)pandn(e,eγ)ncontributions:
D(e,eγ)X=p(e,eγ)p+n(e,eγ)n+d(e,eγ)d+...
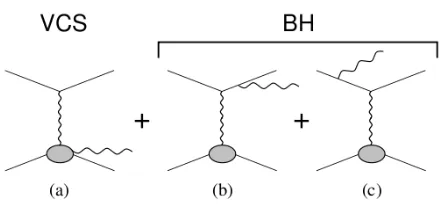
As shown in figure 2, each contribution is the sum of the DVCS process and the Bethe-Heitler (BH) process where the real photon is emitted by the incoming or the scattered electron.
The BH amplitude is fully calculable using the form factors so measuring the experimental cross section of then(e,eγ)nprocess leads to the determination of the|DVCS|2plus the interference term.
Figure 2.(a): The DVCS process, (b) and (c) Bethe-Heitler process diagrams
The DVCS on the neutron is deduced by comparing the data taken on hydrogen and deuterium targets. The scattered electron is detected in a High Resolution Spectrometer (Left-HRS) in coin-cidence with the DVCS photon detected in an electromagnetic calorimeter. The recoil nucleon is identified with the missing mass technique. The electromagnetic calorimeter is a matrix of 13×16
PbF2blocks, placed at 1.1mfrom the target, centered around the virtual photon direction which leads
to a momentum transfer t ranging roughly from -0.1 to -0.5GeV2. Each block is connected to (PM +electronic base+ARS) which are equivalent to a numeric oscilloscope recording signals on 128ns. The main goal of using ARS is to deal with pile up signals in our high luminosity experiment. Due to radiation damage the optical properties of the PbF2-blocks deteriorate during the experiment leading to an overall decline of blocks gain. For this reason, the first step in our analysis is the calorimeter energy calibration.
2 Calorimeter energy calibration
Two elastic calibrations, based onep → epelastic reaction, are performed during our experiment but cannot provide a daily calibration [20]. So we performed a second calibration where we used
H(e,eπ0)X andD(e,eπ0)Xdata which have been taken simultaneously with DVCS data. The
cali-bration method is based on the comparison between the measured energy of a detectedπ0(using the
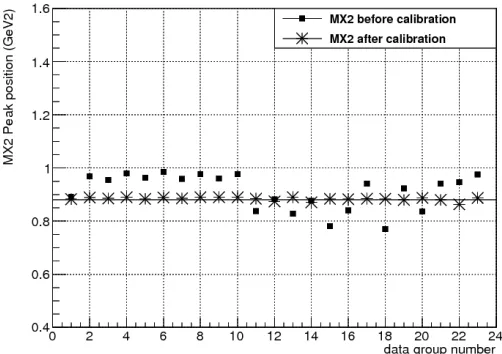
energy deposit in calorimeter) and its expected energy calculated with its scattering angle (also given by the calorimeter) [19]. The invariant mass ofγγevents detected in the calorimeter provides a good test of this calibration. Figure 3 shows the invariant mass peak position versus data group number. After the calibration, the points representing the new invariant mass peak position are aligned with the exactπ0mass. To check our calibration, we compared the missing mass squared peak position (of the
same data), corresponding toH(e,eπ0)pexclusive events, before and after this calibration for each
group of data. After the calibration we reproduce, as shown in Figure 4, the nucleon mass squared (0.88GeV2) for each group number.
Thanks to thisπ0calibration method and to the daily switching between hydrogen and deuterium targets during data taking, we obtained a daily calibration of the calorimeter energy. This allows to reduce the systematic error on the results coming from the energy calibration of the calorimeter.
3 Selection of exclusive photon electroproduction events
The DVCS events are selected with a cut on the missing mass squaredM2X = (k+p−k−q)2 <
(M+Mπ0)2 ≈ 1.15GeV2. Below this cut, we have only H(e,eγ)p(or D(e,eγ)pn) events (called
Figure 3.Invariant mass peak position as a function of data group number before and afterπ0calibration. The solid horizontal line represents theπ0mass.
Figure 4.Missing mass squared peak position as a function of data group number before and afterπ0calibration. The solid horizontal line represents the nucleon mass squared.
• Accidental coincidences : when the detected photon in the calorimeter is in fortuitous coincidence with the scattered electron.
• π0contamination : when the detected photon in the calorimeter comes from the asymmetric decay
ofπ0, this photon resembles kinematically to a DVCS photon. We substract theπ0contamination by using a clean sample of detectedπ0fromH(e,eπ0)XorD(e,eπ0)X. For these events, a simulation
of all possibleπ0→γγdecays tells us which fraction of asymmetric decays is seen as DVCS events
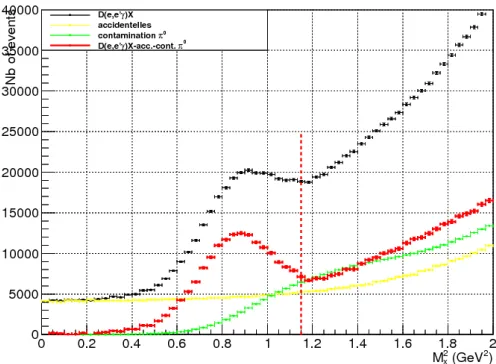
Figure 5.Missing mass squared spectrum of raw data (black), accidental data (yellow),π0contamination (green), and after all substractions (blue spectrum) forD(e,eγ)X, "Kin2 low" kinematics.
Figure 5 shows the spectrum of the missing mass squared M2
X for D(e,eγ)X raw data, the
accidental coincidences and the π0 contamination events for one kinematic (called Kin2Low: EBeam = 4.45GeV). Before subtracting the H(e,eγ)p events from D(e,eγ)pn) events, we added
Fermi momentum [21] to H2 data and normalized H2 and D2 data to the same luminosity. The
D(e,eγ)X−H(e,eγ)Xdata are represented by the purple spectrum in figure 6. This spectrum con-tains the DVCS on the neutron events (n-DVCS) and also the DVCS on the coherent-deuteron events (d-DVCS). The vertical line represents the missing mass squared cut at the pion production threshold. These experimental data are used to extract the (n-DVCS+d-DVCS) cross section.
4 Smearing of the simulation data
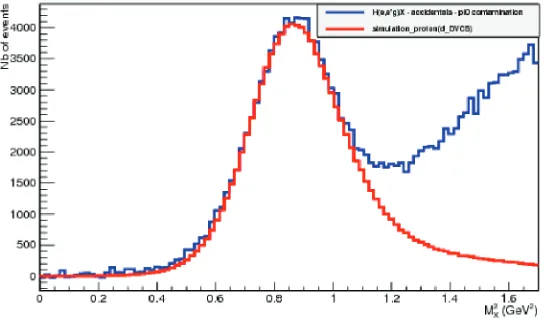
The extraction of the cross section is done using the experimental data and the simulation data. First, it is necessary to have a good matching between the experimental data and simulated data (having the same exclusive peak position and having the same resolution). Our method is based on smearing the photon energy for each event in the simulation, because the experimental resolution is dominated by the energy resolution of the calorimeter. Since the extraction of the cross section is performed by bins intand inφ(the angle between the hadronic and leptonic planes), our smearing method was applied for each of these bins independently. Figure 7 shows a spectrum of the missing mass squared of the
H(e,eγ)pdata (blue) and the proton simulated data after smearing (red), a good agreement between the two spectra is clear below the pion production threshold.
5 Extraction of the cross section
The experimental data (D(e,eγ)X−H(e,eγ)X) contain a neutron contribution (n-DVCS) and a co-herent deuteron contribution (d-DVCS). In this case, the unpolarized photon electroproduction cross section can be written as [22]:
d4σ dQ2dx
Bdtdφ
=σ(BHn)+σ(BHd)+
in
(Γin(Q2,xB,t, φ)Xin)+
id
Figure 6.Missing mass squared spectrum of (D(e,eX- accidental -π0contamination) events (red), (
H(e,eγ)X -accidental -π0contamination) events (blue) and (D(e,eγ)X−H(e,eγ)X). The purple spectrum represents the (n-DVCS+deuteron-coherent-DVCS) events at the left of the vertical line which is the pion production threshold.
Figure 7.Missing mass squared spectrum of theH(e,eγ)pdata (blue specrum) and the proton simulation data
(red spectrum).
depen-dence onφin the kinematical factors allows us to separate the contribution of the different harmonics (for the neutron or the coherent-deuteron) and a binning inM2
X is important to separate the
contribu-tions of the neutron from the ones of coherent-deuteron.
In order to extract the observablesXinandXidgiven by equation 1, we performed aχ2
minimiza-tion between the experimental number of events,Nexp, and the simulated number of events,Nsim.
χ2= Nbin
k=1
(N
sim
k −N
exp k ΔNkexp )
2. (2)
Note the summation over all bins at the vertex k (5 bins in t×20 bins inφ=100 bins). ΔNkexpis the experimental statistical error in one bin k.
(rad)
φ
0 1 2 3 4 5 6
) 4 (nb/GeV φ dtd 2 dQB dx σ d 0 0.02 0.04 0.06 0.08 0.1 0.12 0.14 0.16 0.18 0.2 2 >=-0.25 GeV n
<t BHneutron BHdeuton (BHneutron+BHdeuton)
2
= 0.95 GeV
2 X
;cut_M
kin2_low
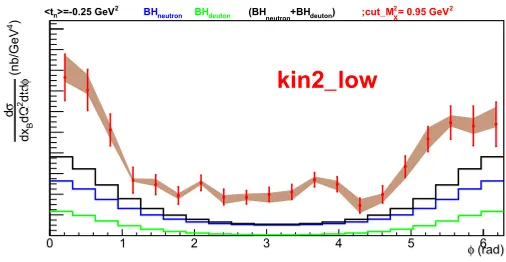
Figure 8.Preliminary results of (n(e,eγ)n+d(e,eγ)d) experimental cross section (black points), neutron BH contribution (blue histogram), coherent-deuteron BH contribution (green histogram) and BH-sum (black his-togram) for one bin at<t>=−0.25GeV2and the kinematic Kin2Low. Error bars are statistical and the shaded area is the systematic error.
Figure 8 shows the preliminary results of the experimental cross section corresponding to the sum (n(e,eγ)n+d(e,eγ)d), for one bin at<t >= 0.25GeV2 for one kinematic Kin2Low. These
results show for the first time the existence of a positive contribution of n-DVCS (+d-DVCS) which is observed at both beam energies. These results are obtained after testing their stability as a function of the upperM2
Xcut.
5.1 Conclusion
In summary, our analysis of this experiment provides preliminary results of the experimental cross section (n(e,eγ)n+d(e,eγ)d). For the first time, we have found a positive contribution of n-DVCS (+d-DVCS) at both beam energies. We plan to make more stability and correlation studies to estimate separately the contributions n-DVCS and d-DVCS and a global fit will be performed using data at both energies to extract CFFs.
References
[1] V. Punjabi et al., Eur.Phys.J. A51, 79 (2015) and references therein.
[12] S. Stepanyan et al. (CLAS), Phys. Rev. Lett. 87, 182002(2001). [13] C. Adloffet al. (H1), Phys. Lett. B 517, 47 (2001).
[14] S. Chekanov et al. (ZEUS), Phys. Lett. B573, 46 (2003). [15] C. Munoz Camacho et al., Phys. Rev. Lett. 97, 262002 (2006). [16] M. Mazouz et al. Phys.Rev.Lett. 99, 242501 (2007).
[17] F.X Girod et al. Phys.Rev.Lett. 100, 162002 (2008). [18] S. Pisano et al. Phys.Rev. D91, 052014 (2015). [19] M. Mazouz, DVCS internal note, (2011).