IAPSO-TCI: Improved Ant and Particle Swarm based
Optimization Techniques for Classifying Imagery
Rebika Rai
#1, Ratika Pradhan
#2, M.K.Ghose
#3 #1Department of Computer Applications, Sikkim University,
6th Mile, Samdur, PO Tadong, Gangtok, Sikkim-737102, India
#2
Department of Computer Science & Engineering, Sikkim Manipal Institute of Technology,
Majitar, Rangpo, Sikkim-737132, India
#3
Department of Computer Science & Engineering, Sikkim Manipal Institute of Technology,
Majitar, Rangpo, Sikkim-737132, India
Abstract-The biologically inspired world comprising of social
insect metaphor for solving out wide range of dilemma has become potentially promising area in most recent duration focusing on indirect or direct coordination’s among diverse artificial agents. Swarm [8] apparently is a disorganized collection / population of moving individual that tends to cluster together while each individual seems to be moving in random directions. Swarm Intelligence techniques include Particle swarm optimization, Ant Code Optimization, Biogeography based optimization, Bee Colony Optimization, Stochastic Diffusion Search, Bacterial foraging optimization. Classification is the computational procedure [1] [3] that arrange the images into groups according to their similarities. Plentiful methods for classification have been designed and investigating novel means to increase classification exactness has been a key topic. Ant Colony Optimization (ACO) [6] [11] [18] is an algorithm motivated by the foraging behaviour of ants wherein ants leaves the volatile substance called pheromone on the soil surface for the purpose of collective contact via indirect communications. Particle Swarm Optimization is an approach to problems whose solutions can be represented as a point in an n-dimensional solution space wherein number of particles [13] [19] are randomly set into motion through this space. In each of the iteration, they observe the "fitness" of themselves and their neighbours and "emulate" successful neighbours by moving towards them. This paper focuses on improved Methodology of Swarm Computing for classifying imagery termed as IAPSO-TCI exploring Improved Ant and Particle Swarm based Optimization using a traditional classifier SVM (Support Vector Machines) for edge detection and image classification
Keywords- Classification, Imagery, Feature Extraction, Feature Selection, Pheromone, Swarm, Ant Colony Optimization, Particle Swarm Optimization, Support Vector Machines, Edge Detection, Image Classification.
I. I
NTRODUCTIONSwarm Intelligence (SI) [16] [17] is artificial intelligence based on the collective behaviour of decentralized, self-organized
systems wherein
agents follow very simple rules, and althoughthere is no centralized control structure dictating how individual agents should behave, localInteractions between such agents lead
to the emergence of complex global behaviour. In fastidious the regulation focuses on joint behaviour those upshots from local interactions with each other and with the surroundings. Instance of systems studied by Swarm Computing is colonies of ant and termites, school of fish, flocks of birds, herds of land animals and thereby has been employed in various problems varying from a Travelling Salesman Problem (TSP) [16][9] to Robotic navigation to Edge detection[21] [22] to Image classification [6] [8] [13] [24]. Detection of edge [21] in an image being one of the imperative components of image processing and the critical hindrance in Image processing pitch is to expose productive information by accumulating the images into momentous categories. The most important step in the edge detection, on which the success of production of true edge map depends, lies on the determination of threshold. In this paper Otsu’s thresholding method is employed.Image of high dimensions can be generated with the improvement in image capturing equipments; Several methods [17] for classifying imagery is widely available in the literature such as traditional, statistical, knowledge based, neural networks, and other artificial intelligence methods. However, these methods still generate several imperfections as the complexities of images increases.
In ACO [5] [6] [11], as colonies ant reacts speedily and effectively with the environment. They find shorter path to the best food source, assign workers to various tasks, and defend their territory from enemies. Ant colonies make these possible by countless interactions between individual ants. This coordination among the ants doesn’t stem from ‘centre of control’ rather each ant acts only on the local information. PSO[12] [19] is a population-based computation technique, which simulates the individuals (particles) in a bird flocking. SVM (Support Vectors Machines) [1] [7] [12] tackles the nearest distance between a point in one class and a point in the other class being maximized and illustrate a hyper plane to classify two categories as apparently as possible. SVM in this paper aims is to prove its potential along Advanced Particle Swarm based Optimization technique to classify images.
A.
Ant Colony Optimization(ACO)
Ant Colony Optimization is an iterative algorithm wherein at each iteration; a number of artificial ants are builds a solution by walking from vertex to vertex on the graph with the constraint of not visiting any vertex that she has already visited in her walk. At the end of an iteration, on the basis of the quality of the solutions constructed by the ants, the pheromone values are modified in order to bias ants in future iterations to construct solutions similar to the best ones previously constructed.
The underlying mechanism for real ant system is illustrated in Figure 1 [9] [16] [17] [21] [22] [24]
.
Ants communicate with each other using pheromones. In species that forage in groups, a forager that finds food marks a trail on the way back to the colony; this trail is followed by other ants (Figure 1 (a)), these ants then reinforce the trail when they head back with food to the colony. When the food source is exhausted, no new trails are marked by returning ants and the scent slowly dissipates. This behaviour helps ants deal with changes in their environment. For instance, when an established path to a food source is blocked by an obstacle (Figure 1 (b)), the foragers leave the path to explore new routes (Figure 1 (c)). If an ant is successful, it leaves a new trail marking the shortest route on its return. Successful trails are followed by more ants (Figure 1 (d)), reinforcing better routes and gradually finding the best path.Figure 1 (a): Ants moving from nest (source) towards its food (Destination) [9] [16] [17] [21] [22] [24].
Figure 1 (b): An obstacle placed on the way between nest and food [9] [16] [17] [21] [22] [24].
Figure 1 (c): Ants randomly choosing the path [9] [16] [17] [21] [22] [24].
Figure 1 (d): Shortest path chosen by maximum ants based on pheromone deposits [9] [16] [17] [21] [22] [24].
B.
Particle Swarm Optimization (PSO)
Particle swarm optimizers (PSO) are optimization algorithms, modelled after the social behaviour of flocks of birds. PSO [12]
[19] [23] is a population based search process where individuals, referred to as particles, are grouped into a swarm. Each particle in the swarm represents a candidate solution to the optimization problem. In a PSO system, each particle is “flown” through the multidimensional search space, adjusting its position in search space according to own experience and that of neighbouring particles. A particle therefore makes use of the best position encountered by itself and that of its neighbours to position itself toward an optimal solution. The effect is that particles “fly” towards a minimum, while still searching a wide area around the best solution. The performance of each particle (i.e. the “closeness” of a particle to the global optimum) is measured using
a pre-defined fitness function which encapsulates the
characteristics of the optimization problem.
Each particle maintains the following information: xi, the
current position of the particle; vi, the current velocity of the
particle; and yi, the personal best position of the particle. The
personal best position associated with a particle is the best position that the particle has visited so far, i.e. a position that yielded the highest fitness value for that particle. If f denotes the objective function then the personal best of a particle at a time step is updated [12] [19] [23] as:
(1) Two main approaches to PSO exist, namely lbest and gbest, where
the difference is in the neighborhood topology used to exchange experience among particles. For the gbest model, the best particle is determined from the entire swarm. If the position of the best particle is denoted by the vector ŷ [12] [19] [23], then
(2) Where, s is the total number of particles in the swarm. For the lbest model, a swarm is divided into overlapping neighbourhoods of particles. For each neighbourhood Nj, a best particle is determined
with position ŷj. This best particle is referred to as the
neighbourhood best particle, defined [12] [19] [23] as
(3)
(4) For each iteration of a gbest PSO algorithm, vi andxi are updated
[12] [19] [23] as
(5)
(6)
Where, ω is the inertia weight, and c1 and c2 are the acceleration
constants and r1 (t), r2 (t) ~ U (0, 1). The PSO algorithm performs
C.
Support Vector Machine(SVM)
Support Vector Machines (SVM) is supervised representation associated with learning algorithm which used to analyze data and recognize patterns used for segmentation and classification. Support vector machine is the representation of the examples as points in space. SVM [1] [8]can also be used to perform non-linear classification using kernel trick, which implicitly mapped their inputs into high-dimensional feature.
When given a set of points which belong to either of two classes, a linear SVM finds the hyper plane leaving the largest possible fraction of points of the same class on the same side, while maximizing the distance of either class from the hyper plane. In simple form, a support vector machine constructs a hyper plane or set of hyper planes in high or infinite-dimensional spaces, which can be used for classification, regression or other tasks. Intuitively a good separation is get by the hyper plane that has the nearest training data point of any class. The hyper plane in the higher-dimensional space is defined as a set of points whose dot product with a vector in that space is constant. The vector defining the hyper plane can be choosing to be linear combinations with
parameter of image of feature vectors that occur in the
database. With this choice of a hyper plane, the points x in a feature space that are mapped into the hyper plane [1] [8] are define by the relation:
, If K(x , y) [1] [8] becomes small as y grows further away from x, each term in the sum measure the degree of closeness of the test point x to the corresponding database point x.
Figure 2: Hyperplanes separate [1] [8] correctly the training examples. The Optimal Separating Hyperplane on the right hand side has a larger
margin and is expected to give better generalization.
II.
P
ROPOSEDW
ORKClassifying imagery is defined using the following steps: 1. Pick test image to be classified.
2. Edge detection using Improved Ant based Optimization
Techniques (IAOT).
3. Create category database for Imagery.
4. Calculate energy levels through decomposition for
feature selection and extraction. 5. Check out the best matching category.
6. Perform sorting based on their semantic scored and re-ranked using Visual Ranking Algorithm based on the histogram and Eigen value features.
7. Image classification using Improved Particle Swarm
based Optimization techniques (IPSOT) traditional base classifier SVM highlighting parameters such as
Execution / Processing Time, Figure Of Merit (FOM), Kappa value and Peak to Signal Noise Ratio (PSNR). The proposed work focuses on applying methods of Improved Ant based Optimization Techniques (IAOT) for edge detection; Improved Particle Swarm based Optimization techniques (IPSOT) over traditional base classifier Support Vector Machine (SVM) [1] [8] to further classify images.
Firstly the test image is randomly selected and the foreground region is extracted from the image to get the region of interest of the test imagery. There after Improved Ant based Optimization Techniques (IAOT) is applied to input image, which gives the edges of image (Edge Detection) [18][22]. The attributes attained and selected are based on wavelet features by locating the 3 level energy of an image by finding the mean value of the image which is nothing but the energy of the image at that particular level wherein the energy is stored in an array to be saved in the database which are stored with image type (category) in the database created. In addition, new input imagery is given as an input to IAOT for obtaining features of the image. Additionally, this new features of images are compared to features stored in database to obtain class of image. Each of the images from different category is sorted based on their semantic scored and re-ranked using Visual Ranking Algorithm based on the histogram and Eigen value features. Support Vector Machine (SVM)[1][8] which is traditional base classifier has been used and its potential is improved by optimizing it by applying Improved Particle Swarm based Optimization (IPSO) techniques to acquire the class of image from the database and classification of the image based on features. Ultimately, re-ranked list is displayed emphasizing the undergone iterations and the best matching image from the selected category which counterpart the query image exhibiting parameters for instance Execution / Processing Time, Figure Of Merit (FOM), Kappa value and Peak to Signal Noise Ratio (PSNR).
A.
Improved Ant based Optimization Techniques
(IAOT)
ACO-based advances to edge detection and classification of imagery utilizes a decision rule based on Ant System (AS) being leading algorithm based on foraging act of ants i.e. ACO. Continually since its development, quite a few accompaniments have been made to traditional ACO and from amongst which ACS is one. This paper emphasizes on a technique called IAOT [21] [22] [24] resulting from facets of ACS where one of the significant aspects is formation of decision rule, the pseudorandom proportional rule.
Several modifications have been proposed on the existing ACO algorithms to generate IAOT:
1) Ant Based Initialization Process. 2) Heuristic Function Calculation. 3) Ant Based Decision Process.
pheromone matrix is used to classify each pixel either as an edge or a non-edge.
An M × N 2-D image can be represented as 2-D matrix [19] with image pixels as its elements. In the representation used, each pixel in the image represents both a node and an edge in the graph. A pixel represents a node because locations in the graph are associated with pixel locations: ants move from one pixel to another. At the same time, it also represents an edge because the heuristic information is determined from the local variation of the image’s intensity values and hence, is associated with a pixel location in the image. The components of the pheromone and transition matrices are associated with pixels in the image. The algorithm consists of three main steps. The first is the initialization process [18] [21] [23]. The second is the iterative construction-and-update process, where the goal [18] is to construct the final pheromone matrix. The construction and-update process is performed several times, once per iteration. The final step is the decision process, where the edges are identified based on the final pheromone values.
B.
Improved Particle Swarm based Optimization
Techniques (IPSOT)
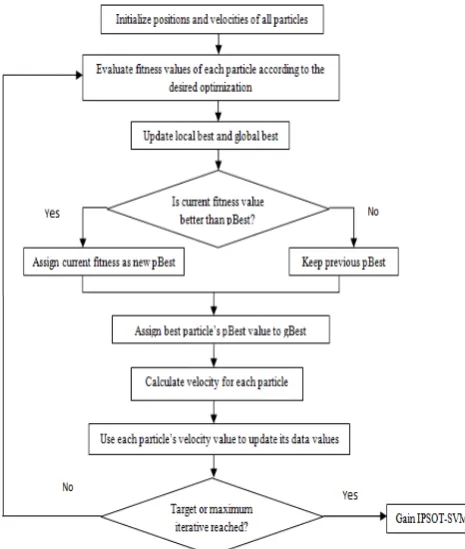
with Support Vector Machines (SVM)The process of Support Vector Machines (SVM) [1] [8] [23] trained by Particle Swarm based Optimization Techniques is given in Figure 3:
Figure 3: the process of Support Vector Machine trained by Particle Swarm based Optimization Techniques
The process of Support Vector Machine (SVM) trained by Particle Swarm Optimization (PSO) is described as followings: (1) Initialize the positions and velocity of all particles; (2) Evaluate the fitness of each particle according to the desired optimization;(3) Update local best and global best, and update the velocity and position of the particles according to local best and global best;(4)
Check if the current fitness value is better than pBest, if yes assign current fitness as new pBest else keep previous pBest; (5) Assign best particle’s pBest value to gBest; (6)Calculate velocity for each particle and use each particle’s velocity value to update its data values; (7) Subsequently, check if the maximum iteration has reached, if has not step (2) to be repeated else finally, termination-condition is judged.
III. EXPERIMENTAL /SIMULATION RESULT
Experiments were carried outed using numerous ordeal illustrations. The proposed method i.e. Improved Ant and Particle Swarm based Optimization Techniques for Classifying Imagery were implemented using Matlab R2011a. The program is run on a PC with an Intel (R) Core (TM) i5: 2400CPU @ 3.10 GHz; 4 GB RAM and 32 bit Operating System.
Parameters, its significance, values for each parameter used for experiments are summarized in following table:
Table 1
Parameters used in Experiments
Parameters Significance
τinit Initial pheromone value
N No. of iterations L No. of construction steps
K No. of ants
α Influence of pheromone β Influence of heuristic value ψ Pheromone decay coefficient ρ Pheromone evaporation coefficient
s Total particles in swarm
ω Inertia weight
c1, c2 Acceleration constant
Vmax Maximum velocity
r Random number (Control exploration)
Table 2
Parameters value used in Experiments
Parameter s Value
τinit 1/M1M2
N 1-25 L 50 K 256
α 1
β 1
ψ 0.05
ρ 0.1
s 150
ω 0.72
c1, c2 1.42
Vmax 255
r 0.25
The best solution is extracted after a user-specified number of iterations (100 iterations was used for all the experiments conducted). Velocity updates can also be clamped through a user defined maximum velocity, Vmax, which would prevent them from
exploding, thereby causing premature convergence. Here, c1 and
c2 are constants introduced that controls the velocities where c1
controls the intensity of particles to go to global maxima. On the other hand, r is random number that controls the exploration.
Table 3
Output Parameters generated via Experiments
Parameters
Execution / Processing Time (Time Required) Figure Of Merit (FOM)
Kappa value
Peak to Signal Noise Ratio (PSNR)
In the simulation result given below, we have highlighted the proposed methodology of Image Classification known as: Improved Ant and Particle Swarm based Optimization Techniques in terms of Execution / Processing Time (time required), Figure Of Merit (FOM), Kappa value and Peak to signal Noise Ratio (PSNR). Numerous images has been considered and tested. In the experimental / simulation results, three images: Designer Door, Living Room, Bed, has been projected as Image 1, Image 2 and Image 3 respectively.
The simulation is highlighted in the following manner:
STEP 1: New database for imagery is created and several
categories (Unlimited) of images are entered and stored in the database (as shown in Result 1 given below).
STEP 2: Images are inserted in each category created in the STEP 1. As and when, the images are inserted, the foreground information of image is extracted, edge is detected using Improved ACO, energy level feature of the edge detected image is evaluated and further the Eigen Value and Histogram of the image is evaluated (as shown in Result 2 given below).
STEP 3: Subsequently, energy level of the input image is
calculated, list is re-ranked, input image is compared with images from the category database and the best matching image is extracted thereby classifying the input image in that category. The various input images that had been inserted in the category database are shown below (Image 1, Image 2 and Image 3) along with the outcome of STEP 3.
Result 1:
Result 2:
IV. CONCLUSION
The PSO-SVM takes the advantage of minimum structural risk of SVM and the quick global optimizing ability of PSO. In this paper, an improved methodology termed as IAPSO-TCI (Improved Ant and Particle Swarm based Optimization Techniques for Classifying Imagery) has been proposed and result highlights the quality performance based on the mentioned parameters below:
For (Image 1), the following values have been tabulated: Parameters By IAPSO-TCI
Time required 1.53 seconds
Figure Of Merit 0.896
Kappa Value 95.23
PSNR 63.84 dB
Threshold value 149.03
For (Image 2), the following values have been tabulated:
Parameters By IAPSO-TCI
Time required 1.69 seconds
Figure Of Merit 0.889
Kappa Value 94.93
PSNR 62.52 dB
Threshold value 92.27
For (Image 3), the following values have been tabulated: Parameters By IAPSO-TCI
Time required 2.00 seconds
Figure Of Merit 0.928
Kappa Value 96.79
PSNR 63.12 dB
Threshold value 118.4
As per the conclusions and experiment, it leads to the following research directions: Edge detection is highly dependent on the lighting conditions, density of image and noise [24]. Therefore, an automatic detector to provide better edge detection is required. Threshold value is determined in this paper using Otsu’s method which gives a comparatively better outcome but if multiple thresholding [24] techniques can be available applying each one when the scene conditions are most ideal. Classification has been performed in this paper using a base classifier SVM with proposed method IAPSO-TCI. A hybrid swarm based method can be developed to yield better outcome thereby increasing the Figure Of Merit, Processing time and accuracy.
REFERENCES
[1] Olivier Chapelle, Patrick Haffner, and Vladimir N. Vapnik, “Support Vector Machines for Histogram-Based Image Classification”, IEEE Transactions on Neural Networks, Volume 10 (5), September 1999. [2] Aksoy S, Koperski K, Tusk C, et al. “Learning Bayesian classifiers
for scene classification with a visual grammar”, IEEE Transaction on Geo science Remote Sensing, volume 43(3), pp. 581-589, 2005. [3] S.N.Omkar, Manoj Kumar M, Dheevatsa Mudigere, Dipti Muley,”
Urban Satellite Image Classification using Biologically Inspired Techniques”, In IEEE International Symposium on Industrial Electronics, 2007.
[4] Q. Yin, and P. Guo, “Multispectral Remote Sensing Image Classification with Multiple Features,” Proceedings of International Conference on Machine Learning and Cybernetics, volume 1, pp. 360-365, August 2007.
[5] T.Piatrick, E.Izquierdo, “An application of Ant Colony Optimization to Image Clustering”, In proceedings of K-Space Jamboree workshop, 2008.
[6] Xiaoping Liu, Xia Li, Lin Liu, Jinqiang He, Bin Ali,” An innovative method to classify Remote Sensing Images Using Ant Colony Optimization”, IEEE Transaction on Geo science Remote Sensing, volume 46 (12), 2008.
[7] S. Osowski, R. Siroic, T. Markiewicz, and K. Siwek, “Application of support vector machine and genetic algorithm for improved blood
cell recognition,” IEEE Trans. Instrum. Meas., vol. 58, no. 7, pp. 2159–2168, Jul. 2009.
[8] Farid Melgani, Yakoub Bazi “Classification of Electrocardiogram Signals with Support Vector Machines and Particle Swarm Optimization” IEEE Transactions On Information Technology In Biomedicine, Vol. 12, No. 5, September 2008
[9] Rebika Rai, Tejbanta Singh Chinghtam, M.K.Ghose, “Optimization of Autonomous Multi-Robot Path Planning & Navigation using Swarm Intelligence”, In National Conference on LEAN Manufacturing Implementations : The future of Process Industries (LEMAN ), 2009.
[10] Sanggil Kang, Sungjoon Park,“A fusion neural network classifier for image classification”, Pattern Recognition Letters, vol.30,no.9, pp.789-793, 2009.
[11] Peng Xiao, Jun Li, Jian-Ping LI3, “Ant colony Optimization Algorithm for Image Extracting”, IEEE, 2010.
[12] Shuaishi Liu; Yantao Tian; Cheng Peng; Jinsong Li, “Facial expression recognition approac based on least squares support vector machine with improved particle swarm optimization algorithm “IEEE International Conference on Robotics and Biomimetics (ROBIO), pp: 399 – 404, 2010.
[13] LI Linyi, LI Deren “Fuzzy Classification of Remote Sensing Images Based on particle Swarm Optimization” in International Conference on Electrical and Control Engineering in 2010.
[14] Simranjeet Kaur, Prateek Agarwal, Rajbir Singh Rana, “Ant Colony Optimization: A technique used for Image Processing”, IJCST, volume 2 (2), 2011.
[15] Ling Chen, Bolun Chen, Yixin Chen, “Image Feature Selection Based on Ant Colony Optimization”, In proceedings of 24th
International conference on Advances in Artificial Intelligence, pp.580-589, 2011.
[16] Rebika Rai, Tejbanta Singh Chinghtam, "A hybrid framework for Robot path planning and Navigation using ACO & Dijkstra", IJCA Proceedings on International Symposium on Devices MEMS, Intelligent Systems & Communication (ISDMISC), Published by Foundation of Computer Science, New York, USA, Volume 9, pp. 19-24, October 2011.
[17] Rebika Rai, Ratika Pradhan, M.K.Ghose, “Ant based Swarm Computing for Image Classification - A Brief Survey”, in IJCA Special Issue on Computational Intelligence and Information Security (CIIS), ISBN: 973-93-80870-58-7, pp. 17-21, November 2012 . [18] Mohit Mehta, Munish Rattan, “An improved ACO based
algorithm for image edge detection”, International Journal of Computing and Corporate Research, Volume 2 Issue 5, September 2012.
[19] Jagdeep Kaur, Kirandeep Kaur, “Remote Image Classification Using Particle Swarm Optimization”, International Journal of Emerging Technology and Advanced Engineering, ISSN 2250-2459, Volume 2, Issue 7, July 2012.
[20] Nikita Kashyap, G.R.Sinha,” Image Watermarking Using 3-Level discrete Wavelet Transform (DWT)”, International Journal of Modern Education and Computer Science, Volume 3, pp. 50-56, April 2012.
[21] Rebika Rai, Ratika Pradhan, M.K.Ghose, “Ant based Swarm Computing for edge detection of images- A Brief Survey”, International Journal of Emerging Technology and Advanced Engineering (IJETAE), ISSN 2250-2459, ISO 9001:2008 Certified Journal, Volume 3, Issue 4, pp. 249-259, April 2013.
[22] Rebika Rai, Ratika Pradhan, M.K.Ghose, “AASC: Advanced Ant based Swarm Computing for detection of edges in Imagery”, International Journal of Emerging Technology and Advanced Engineering (IJETAE), ISSN 2250-2459, ISO 9001:2008 Certified Journal, Volume 3, Issue 12, pp. 107-115, December 2013. [23] Abhishek Pandey, Anjna Jayant Deen, Rajeev Pandey, “Content
based Structural Recognition for Image Classification using PSO Technique and SVM”, International Journal of Computer Applications (IJCA), Volume 87, No. 7, pp. 0975 – 8887, February 2014.
![Figure 1 (d): Shortest path chosen by maximum ants based on pheromone deposits [9] [16] [17] [21] [22] [24]](https://thumb-us.123doks.com/thumbv2/123dok_us/7841017.1299676/2.595.55.289.368.704/figure-shortest-path-chosen-maximum-based-pheromone-deposits.webp)
![Figure 2: Hyperplanes separate [1] [8] correctly the training examples.](https://thumb-us.123doks.com/thumbv2/123dok_us/7841017.1299676/3.595.54.289.422.528/figure-hyperplanes-separate-correctly-training-examples.webp)