Optimization of experimental parameters
for the production of LMWH-loaded polymeric
microspheres
Nusrat Motlekar Bi-Botti Youan
Butler University, College of Pharmacy and Health Sciences, Indianapolis, IN, USA
Correspondence: Nusrat Motlekar Assistant Professor, Butler University, College of Pharmacy and Health Sciences, Indianapolis, IN, USA
Tel +1 317 940 6427 Fax +1 317 940 3046 Email [email protected]
Abstract: The present study reports on the production of low molecular weight heparin (LMWH) loaded polymeric microspheres for delivery via the oral route. The microspheres were prepared by the spray-drying technique using Eudragit® as the polymer. The objective of
this study was to examine extensively the infl uence of formulation and process variables on the characteristics of the microspheres prepared. The effects of various experimental parameters such as polymer concentration, inlet temperature, and liquid feed fl ow rate on particle morphology, particle dimensions, and production yields were evaluated by means of experimental factorial designs. Electron microscopy, moisture content analysis, and fractal dimensional analysis were employed to characterize the microspheres. The inlet temperature and polymer concentration had the greatest effects on the production yield. Results showed that the polymer concentra-tion affected the dimensions of the microspheres. Drug-loaded microspheres were spherical in shape and had a smooth surface with sizes ranging between 19–60 µm. Production yields were above 50% under most of the operating parameters studied. The selection of appropriate parameters yielded spray-dried microparticles characterized by smooth morphology and narrow dimensional distribution.
Keywords: spray drying, LMWH, DOE, fractal, microspheres
Introduction
into a polymer by spray drying. In this study, the spray dryer was a mini-Büchi 190 (Büchi Co., Flawil, Switzerland) which is a laboratory scale spray dryer. The main components of the equipment include the air-heater, the nozzle/atomizer, the desiccation chamber (spray-drying cylinder), the fan, the cyclone collector (for separation between the product and the air-fl ow) and a fi nal collector vessel in which the spray-dried product is collected.
The quest for an ideal anticoagulant has resulted in a number of oral factor Xa inhibitors and direct thrombin inhibitors being introduced in the market. Low molecu-lar weight heparin (LMWH) is the agent of choice in the anti-coagulant therapy and prophylaxis of thrombosis and coronary syndromes (Gallus 1992; Weltermann et al 2003). However, a major disadvantage of LMWHs is that they can only be administered parenterally, due to a lack of absorption when administered orally (Grau et al 2001; Breddin et al 2001; Money and York 2001). The development of oral formulations for LMWH would have tremendous clinical importance as it would result in avoidance of the pain and discomfort associated with injections, thereby offering better patient compliance. The intestinal absorption of LMWHs is limited owing to their poor membrane permeability charac-teristics such as hydrophilicity, anionic surface charges and high molecular weight (Ross and Toth 2005). Moreover, these therapeutic macromolecules are unstable in the acidic conditions of the stomach. It has been shown that desulfation of heparin may occur in the acidic pH of the stomach (Larsen et al 1989). Selective deacetylation and desulfation of heparin have been shown to affect both its anticoagulant activity and
in vivo disposition characteristics (Bjornsson et al 1988). Since LMWHs are not absorbed in the gastrointestinal tract, recent studies have focused on combining LMWH with car-riers (Salartash et al 1999; Jiao et al 2002).
Since several polymeric microparticles are proven to protect and target drugs, we made use of this formulation approach in our study (Esposito et al 2001). A polymer belonging to the class of Eudgragit® polymers was selected
for this study. These polymers are widely accepted in the pharmaceutical industry (Esposito et al 2001). The carrier chosen was Eudragit S100 which is a methacrylate polymer composed of methacrylic acid-methacrylic acid methyl ester copolymers. This was chosen for its gastroresistance as it is a pH-dependant enterosoluble polymer which is soluble above pH 7.0. S100 is a non-biodegradable polyca-tionic polymer which is generally used for enteric coating (Esposito et al 2001). This polymer was chosen for the production of microparticles by spray-drying in the current
study because of its inertness and solubility characteristics (Esposito et al 2001). Since spray drying depends on various interacting variables and operating conditions, the effects of process and formulation variables were investigated. The effects of these variables on particle size and yield were of primary importance to this study. Other response parameters of interest were particle morphology, moisture content, encapsulation effi ciency, in vitro release and fractal dimension of the resulting microparticles obtained using the spray-drying process.
Materials and methods
LMWH was purchased from Celcus Laboratories Inc. (Boston, MA). Eudragit S100 was kindly provided by Rohm Pharma (Darmstadt, Germany). The commercial kit used for the evaluation of anti-factor Xa activity was purchased from Dia-pharma group (Westchester, OH). Other reagents used were purchased from Sigma Chemical Co. (St. Louis, MO).
Design of experiments
Spray-drying procedure
The mini spray dryer employed was a Büchi 290 (Büchi Co., Flawil, Switzerland). Aqueous solutions of LMWH ardepa-rin and Eudragit S100® (methacrylic acid copolymer type B MW 135,000) were prepared at their given concentrations in purifi ed water. The various spray-drying process conditions are listed in Table 1. Briefl y, given amounts of S100 were dissolved in 100 mL of purifi ed water and 500 mg of LMWH, ardeparin was added to this solution under stirring. The resultant mixture was fed into the spray-dryer by a peristaltic pump and sprayed with a 0.7 mm nozzle, by means of a fl ow of compressed air, in the drying chamber of the apparatus. A fl ow of heated air aspirated by a pump induced the quick evaporation of the solvent from the drops, leading to the formation of solid microparticles. The particles were separated from the exhausted air in a cyclone and settled into a bottom collector using a Model 290 bench top spray dryer (Büchi Co, Flawil, Switzerland) using the following settings: pressure 85 mbar, solvent flow rate 15%–25%, and temperature 80–100 °C. The drug loading was kept constant for all runs at 0.5%. At the end of the spray-drying process, the particles were collected and subsequently characterized.
Particle morphology and geometric size
Surface characteristics of the various spray dried microparticles were examined using scanning electron microscopy (SEM). Dried microparticles were analyzed without sputter coating at 15–20 kV. SEM images were obtained for all the runs to examine particle morphology. Samples were analyzed using a Hitachi S-3400 II Scanning Electron Microscope (Hitachi High Technologies America, Inc. Schaumburg, IL). Microsphere size was determined by examining the diameter on digital photomi-crographs. The analysis was performed by a computerized size analysis system built into the above SEM system.
Fractal analysis
Fractal dimension was applied to study the surface roughness of microparticles. The fractal dimension was measured using BenoitTM 1.3 (St. Petersburg, FL). The fractal dimension was
calculated using the Box-dimension method. The fractal dimension Df, is a measure of the particle surface. The SEM images were used for the computation of dimensions after conversion to a bitmap image fi le.
Determination of residual moisture
content
The residual water content for the microparticle samples was determined by Karl Fisher titration using a Brinkmann 756 KF Coulometer (Hamburg, Germany). Typically 10 mg of sample was dissolved in 1 mL of reagent Hydranal®
-Coulomat AG-H and added to the Karl Fisher titration vessel following equilibration of the instrument for moisture determination. The moisture content of the anhydrous reagent was determined as the baseline and subtracted from data as baseline correction (Tattini et al 2005).
Production yield/recovery
Microparticle recovery effi ciencies were calculated as per-centage of weight of microparticles obtained compared to the total amount of polymer and drug initially used in the formulation process.
Results and discussion
Fractal dimension
The fractal concept of Mandelbrot (Mandelbrot 1982) offers the theoretical basis for the understanding of the changes in boundary lengths due to differences in resolution. The surface fractal dimension (Df) is the measure of the space-fi lling ability of a curve (Clark 1986). The more irregular and unsteady an object is, the higher the value of Df . This has implications in understanding the physical behavior of pharmaceutical solids. An advantage of fractal analysis is that it partitions roughness characteristics of a surface into a scale-free component (fractal dimension). It is an attractive method for summarizing properties of roughness (Davies 1999). The earliest work in fractal analysis has shown that the degree of surface roughness or irregularities can be expressed by the parameter Df (Avnir and Pfeifer 1983; Farin and Avnir 1992; Pfeifer 1983). A perfectly smooth surface has a low Df value while a highly rough, disordered surface has a high Df . The fractal dimension can be derived from the slope of Richardson plots which are linear. The importance of this
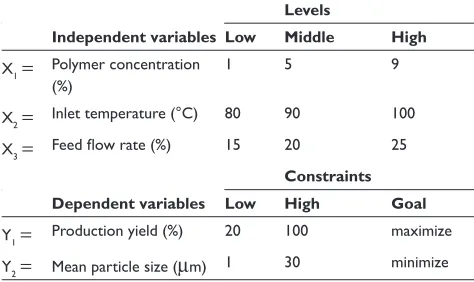
Table 1 Factors and levels in the Box-Behnken design
Levels
Independent variables Low Middle High X1= Polymer concentration
(%)
1 5 9
X2= Inlet temperature (°C) 80 90 100
X3= Feed fl ow rate (%) 15 20 25
Constraints Dependent variables Low High Goal
Y1= Production yield (%) 20 100 maximize
technique is that the roughness of solid surfaces can now be reasonably quantifi ed. The fractal dimension of solid surfaces can be determined using a variety of techniques including scanning electron microscopy (Friel and Pande 1998).
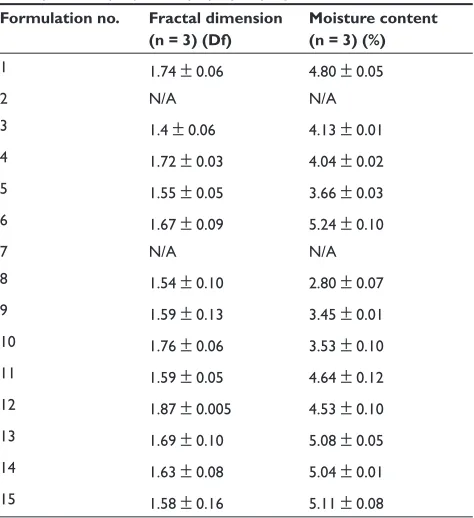
The fractal dimension of the particle contour provides information on the appearance of the surface that is diffi cult to be evidenced even in qualitative form. Table 3 indicates that formulation no. 3 had the smoothest surface with fewer irregularities while formulation no. 12 had a more irregular surface (Table 3). The lowest value for formulation no. 3 not only confi rms the SEM observation, but also suggests a lower degree of irregularity than that appreciated by direct vision. Fractal geometry has been used to determine effects of surface morphology on drug dissolution (Farin and Avnir 1992). In this regard, the Noyes-Whitney equation and Hixon-Crowell cube root laws have been modifi ed to include surface roughness effects on the dissolution rate of drugs. Surface irregularity and shape allow better contact with the dissolution medium and improvement of the dissolution rate and therefore, a more effi cient pharmaceutical form. Thus, the particles in our study possessing greater irregularity would be able to release drug more effi ciently.
In
fl
uence of operating conditions
on microsphere characteristics
The input parameters and the resulting responses for the 15 experimental runs are listed in Table 1. The Box-Behnken design is suitable for understanding the quadratic response surfaces. The design consists of replicated center points and the set of points lying at the mid-point of each surface of the cube defi ning the region of interest. Interaction effects between the factors resolved by the design allow a mid-level value for a combination of factors (Box 1960).
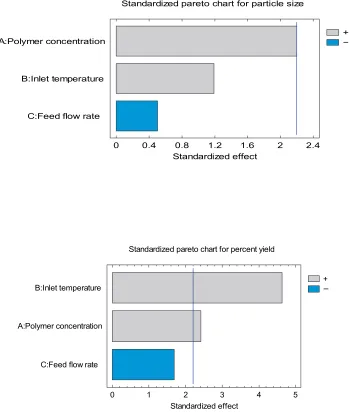
Qualitative estimates of the infl uence of the individual variables could be made by inspection of the data in Table 2. However, it would be diffi cult visually to make predictions as to whether the interactions actually existed between the variables, or which single variable had the most dominant effect. To achieve this, fractional factorial statistical design methods were applied to all 15 runs. These designs are good alternatives to a full factorial design, especially in the initial screening stage. In this study a 3-factorial design was used where main factor effects are confounded with two factor and higher order interactions. The main effects and interac-tion effects calculated for the responses of percent yield and mean diameter are shown in Figure 1.The variables A, B, and C represent polymer concentration, inlet temperature, and feed fl ow rate, respectively. Interactions between two and
among three variables are shown as AB, BC, AC, and ABC. The standardized Pareto Chart shown contains a bar for each effect, sorted from most signifi cant to least signifi cant. The length of each bar is proportional to the standardized effect, which is equal to the magnitude of the t-statistic that would be used to test the statistical signifi cance of that effect. A vertical line is drawn at the location of the 0.05 critical values for Student’s t. Any bars that extend to the right of that line indicate effects that are statistically signifi cant at the 5% sig-nifi cance level. From the magnitudes of all the effects, inlet temperature and polymer concentration appeared to be the main factors affecting the percent yield. There was no main factor for the effect on particle size. The interactions between the variables did not seem very prominent for the percent yield or particle size. From the analysis, it is concluded that inlet temperature and polymer concentration were the important factors affecting yield or recovery of particles. The results obtained for all experiments performed revealed that the particle size distribution were practically insensitive to the spray drying operating parameters. Table 2 indicates that the production yield was highest for formulation no. 3 (59.26%) while it was lowest for both formulation no.’s 2 and 7 (0%). This difference may be attributed to either higher temperature or higher polymer concentration. In terms of mean particle size, formulation no. 4 has the smallest size (19.62 µm) while formulation no. 3 had the largest size
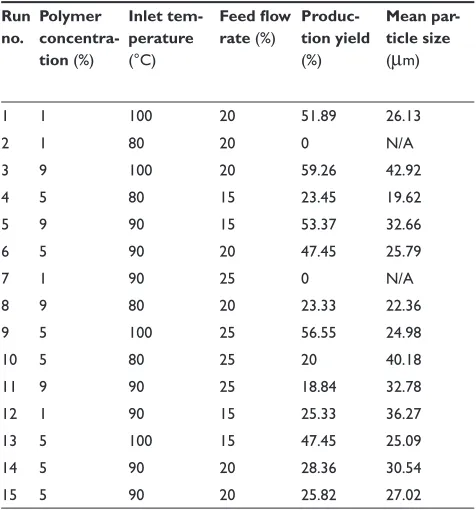
Table 2 Box-Behnken experimental design grid and responses pertaining to microparticle production
Run no.
Polymer concentra-tion (%)
Inlet tem-perature (°C)
Feed fl ow rate (%)
Produc-tion yield (%)
Mean par-ticle size (µm)
1 1 100 20 51.89 26.13
2 1 80 20 0 N/A
3 9 100 20 59.26 42.92
4 5 80 15 23.45 19.62
5 9 90 15 53.37 32.66
6 5 90 20 47.45 25.79
7 1 90 25 0 N/A
8 9 80 20 23.33 22.36
9 5 100 25 56.55 24.98
10 5 80 25 20 40.18
11 9 90 25 18.84 32.78
12 1 90 15 25.33 36.27
13 5 100 15 47.45 25.09
14 5 90 20 28.36 30.54
(42.92). The operation variable responsible for this cannot be isolated from these results.
The yields ranged from 0 to 60%. Most of the runs resulted in low yields because of the diffi culties in particle collection. Condensation inside the chamber leads to a low yield as the dry particles tend to stick to the walls of the chamber and therefore cannot be collected. The yield was expected to be greater at higher temperature due to the increase throughput of the polymer slurry and rapid evaporation of the solvent. Dramatic yield losses in formulation no’s 2 and 7 were caused by lack of drying at lower temperature and adherence of some of the polymer onto the sides of the atomization cham-ber. Also, the mean diameters at higher temperature were increased. Interdroplet agglomeration probably contributed to larger mean particle sizes with formulation. Inlet temperature of air-drying is an important parameter for both particle size and yield. The temperature employed in spray drying opera-tion has to be compatible with the material to be dried and the solvent used (Torrado et al 1989). High pumping rates during the spray drying process result in large volumes of nebulized solution to be dried. Owing to this, heated air may not instantaneously transform the liquid droplets into solid microparticles, leading to the formation of larger/irregular particles that are not completely dried after leaving the desiccating chamber (Wan et al 1991). At higher feed rates, the atomizing air may not be able to penetrate the stream
Table 3 Fractal dimension and residual moisture content for microparticles prepared by spray drying
Formulation no. Fractal dimension (n = 3) (Df)
Moisture content (n = 3) (%)
1 1.74 ± 0.06 4.80 ± 0.05
2 N/A N/A
3 1.4 ± 0.06 4.13 ± 0.01
4 1.72 ± 0.03 4.04 ± 0.02
5 1.55 ± 0.05 3.66 ± 0.03
6 1.67 ± 0.09 5.24 ± 0.10
7 N/A N/A
8 1.54 ± 0.10 2.80 ± 0.07
9 1.59 ± 0.13 3.45 ± 0.01
10 1.76 ± 0.06 3.53 ± 0.10
11 1.59 ± 0.05 4.64 ± 0.12
12 1.87 ± 0.005 4.53 ± 0.10
13 1.69 ± 0.10 5.08 ± 0.05
14 1.63 ± 0.08 5.04 ± 0.01
15 1.58 ± 0.16 5.11 ± 0.08
of liquid. As a result, incomplete atomization may lead to wider droplet size distribution (Masters, 1990). The reduc-tion in yield may be attributed to the incomplete atomizareduc-tion and drying, resulting in the deposition of a large amount of microparticles on the walls of the desiccating chamber and the cyclone separator. The spray drying process resulted in a range of particle sizes. Five different runs produce the small-est size and there were no common input conditions for these runs. These results are expected as low polymer concentra-tion decreases the amount of solid in each droplet exiting the nozzle. Therefore, when the water in the droplet evaporates, a smaller particle remains. Also, when the feed fl ow rate is high, the drop exiting the nozzle tends to be smaller and hence the resulting particle will be smaller. The polynomial equation (regression) relating dependant (response) and independent variables obtained is: Percent Yield =−119.86
+ 2.42438*Polymer Concentration + 1.85462*Inlet Tem-perature - 1.35525*Feed Flow Rate To test the statistical signifi cance of the effects, ANOVA was carried out. The ANOVA table partitions the variability in percent yield into separate pieces for each of the effects. It then tests the statisti-cal signifi cance of each effect by comparing the mean square against an estimate of the experimental error. In this case, 2 effects have P-values less than 0.05 indicating that they are signifi cantly different from zero. The R2 statistic indicated
that the model as fi tted explains 73.25% of the variability in percent yield. The standard error of the estimate shows the standard deviation of the residuals to be 11.33. In the case of particle size, 1 effect has P-values less than 0.05, indicating that they are signifi cantly different from zero. The R2 statistic indicated that the model as fi tted explains
37.17% of the variability in particle size. The adjusted R2
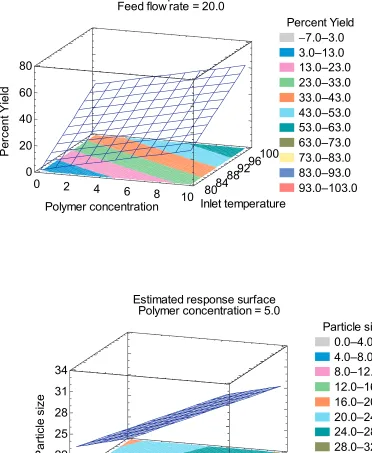
statistic, which is more suitable for comparing models with different numbers of independent variables, is 20.03%. The standard error of the estimate shows the standard deviation of the residuals to be 10.98. To fully understand the fi tted model, a wire frame surface plot was created (Figure 2). In this plot, the height of the surface represents the predicted value of yield over the space of temperature and polymer concentration; with the third factor ie, feed fl ow rate held constant at its middle values. A similar plot was made for the particle size response (Figure 3).
Prediction of theoretical response values
(Response Optimization)
After establishing the relationship between the dependant and independent variables, the process was optimized. A computerized optimization procedure was used to obtain the
levels of polymer concentration, inlet temperature and feed fl ow rate at which a maximized percent yield and particle size could be obtained. The combination of factor levels leading to attainment of maximum response was 9%, 100 °C, and 15% for polymer concentration, inlet temperature and feed fl ow rate, respectively. The predicted optimum values found were 67.03 and 40.87 for percent yield and particle size, respectively.
Scanning electron microscopy
The particle morphologies observed were smooth spheres (no’s 3, 5, 10, 11, and 12) and collapsed particles (1, 4, 6, 8, and 9). Examples of these can be seen in the images shown in Figure 1. The fi gure indicates that formulation no’s 3 and 11 possess uniform spherical morphology characteristics. The common factor in these two cases was the polymer con-centration at 9%. SEM studies of the remaining formulation numbers indicated the formation of collapsed microparticles. Microparticles made at low polymer concentration of 1% were poorly formed. The viscosity of the polymer solution was too low to maintain the stability of the droplets during spray-drying. Higher concentration and higher viscosity of the polymer solution resulted in good droplet stability. The SEM micrograph of the native drug illustrates large crystal-line particles while the SEM micrographs of the spray dried particles indicate smooth surfaces which are much smaller in size when compared with the drug. The particle size is an important parameter in drug design and delivery. For exam-ple, decreasing the particle size increases the surface area, which enhances the dissolution rate (Kondo et al 1993).
Production yields
The yields ranged from 0% to 60%. Most of the runs resulted in low yields because of the diffi culties in particle collection. Condensation inside the chamber leads to a low yield as the dry particles tend to stick to the walls of the chamber and therefore cannot be collected.
Moisture content
preparation of pharmaceutical dosage forms. Table 3 shows the results obtained. It can be observed that the temperature is the most important parameter for the product moisture content. In general, higher temperatures lead to a product with lower moisture content. In terms of residual moisture content, formulation no. 8 was found to be the best due to lowest water content (2.80%). This was in compliance with USP requirements for product storage (USP 1994).
Conclusions
Microparticles were successfully prepared by spray-drying technique. SEM micrographs showed that the particles sizes of the various formulations ranged from 19 to 60 µm and that the surfaces were smooth in appearance. The factorial design proved to be a valuable technique for optimizing the production
of spray-dried microparticles. Since spray-drying involved various parameters for study, the number of experiments was minimized while a detailed evaluation of the dominant variable effects and interactions was accomplished. The conditions for obtaining microparticles with optimal yield (67.03%) and mean diameter (40.87 µm) under the operating conditions used were determined. Highest yields (56%) were obtained with highest temperature (100 °C) and at a polymer concentration of 9%. Smallest particle size (19 µm) was obtained with the tem-perature at 80 °C and a polymer concentration of 5%. Results indicate that the pH-sensitive polymer may protect LMWH against acidic pH after microencapsulation using the spray dry-ing technique. This approach may contribute to enhanced oral bioavailability of LMWHs. This work confi rms the feasibility of the spray drying for the preparation of microparticulate
Standardized pareto chart for particle size
Standardized effect
+ −
0 0.4 0.8 1.2 1.6 2 2.4
C:Feed flow rate B:Inlet temperature A:Polymer concentration
Standardized pareto chart for percent yield
Standardized effect
+ −
0 1 2 3 4 5
C:Feed flow rate A:Polymer concentration
B:Inlet temperature
systems with incorporated controlled-release mechanism to modify LMWH release. Results indicate that the drug release rate from microparticles can be controlled by a proper choice of polymer type, polymer amount and, spray drying operating conditions such as the inlet temperature and feed rate of the microencapsulating composition. One limitation of this study is that the stability of the drug within the microparticles has
not been determined. This data would be useful to determine whether the polymer interacts in a signifi cant manner with the LMWH contained within the particles. Further research is needed before this study can provide important clinical rel-evance with regards to anti-coagulant therapy. Future studies describing the in vivo absorption and anti-coagulant activity of the formulation in an appropriate animal model will aid
Estimated response surface
Feed flow rate = 20.0
Polymer concentration
Inlet temperature
P
er
ce
nt
Y
ie
ld
Percent Yield
7.0–3.0
3.0–13.0
13.0–23.0
23.0–33.0
33.0–43.0
43.0–53.0
53.0–63.0
63.0–73.0
73.0–83.0
83.0–93.0
93.0–103.0
0
2
4
6
8
10
80
84
88
92
96
100
0
20
40
60
80
Estimated response surface
Polymer concentration = 5.0
Inlet temperature
Feed flow rate
Pa
rt
ic
le
si
ze
Particle size
0.0–4.0
4.0–8.0
8.0–12.0
12.0–16.0
16.0–20.0
20.0–24.0
24.0–28.0
28.0–32.0
32.0–36.0
36.0–40.0
40.0–44.0
80
84
88
92
96
100
15
17
19
21
23
25
19
22
25
28
31
34
in determining the potential of these microparticles for suc-cessfully overcoming the challenges faced in the delivery of LMWH via the oral route.
Acknowledgments
The administrators at the department of pharmaceutical sciences are gratefully acknowledged for their support. The experiments in this study were carried out at Texas Tech University. There are no confl icts of interest to report.
References
Avnir D, Pfeifer P. 1983. Chemistry in noninteger dimensions between two and three. II. Fractal surfaces of adsorbents. J Chem Phys, 79:3566–73.
Bittner B, Ronneberger B, Zange R, et al. 1998. Bovine serum albumin loaded poly(lactide-co-glycolide) microspheres: the infl uence of poly-mer purity on particle characteristics. J Microencapsul, 15:495–514. Bjornsson TD, Schneider DE, Hecht AR. 1988. Effects of N-deacetylation
and N-desulfation of heparin on its anticoagulant activity and in vivo disposition. J Pharmacol Exp Ther, 245:804–8.
Bodmeier R, Chen HG. 1988. Preparation of biodegradable poly(+/−)lactide microparticles using a spray-drying technique. J Pharm Pharmacol, 40:754–7.
Box GBD. 1960. Some new three level designs for the study of quantitative variables. Technometrics, 2:455–75.
Breddin HK, Hach-Wunderle V, Nakov R, ET AL. 2001. Effects of a low-molecular-weight heparin on thrombus regression and recurrent thromboembolism in patients with deep-vein thrombosis. N Engl J Med, 344:626–31.
Broadhead ER. 1992. The spray drying of pharmaceuticals. Drug Dev and Ind Pharm, 18:1169–206.
Clark N. 1986. Powder Technology. 46:45–52.
Conti B, Pavanetto F, Genta I. 1992. Use of polylactic acid for the prepa-ration of microparticulate drug delivery systems. J Microencapsul, 9:153–66.
Davies SH. 1999. Statistical methodology. Journal of the Royal Statistical Society (series B), 61:3–
Esposito E, Roncarati R, Cortesi R, et al. 2000. Production of Eudragit microparticles by spray-drying technique: infl uence of experimental parameters on morphological and dimensional characteristics. Pharm Dev Technol, 5:267–78.
Farin D, Avnir D. 1992. Use of fractal geometry to determine effects of surface morphology on drug dissolution. J Pharm Sci, 81:54–7.
Friel JJ, Pande CS. 1998. A direct determination of fractal dimension of fracture surfaces using scanning electron mocroscopy and stereoscopy.
J Mater Res, 8:100–6.
Gallus AS. 1990. Anticoagulants in the prevention of venous thromboem-bolism. Baillieres Clin Haematol, 3:651–84.
Grau E, Tenias JM, Real E, et al. 2001. Home treatment of deep venous thrombosis with low molecular weight heparin: Long-term incidence of recurrent venous thromboembolism. Am J Hematol, 67:10–14. Jiao YY, Ubrich N, Hoffart V, et al. 2002. Preparation and characterization
of heparin-loaded polymeric microparticles. Drug Dev Ind Pharm, 28:1033–41.
Kondo N, Iwao T, Masuda H, et al. 1993. Improved oral absorption of a poorly water-soluble drug, HO-221, by wet-bead milling producing par-ticles in submicron region. Chem Pharm Bull, (Tokyo). 41:737–40. Larsen AK, Rice KG, Linhardt RJ, et al. 1989. Resistance of
hepari-nase-derived heparin fragments to biotransformation. J Biol Chem,
264:1570–7.
Mandelbrot B. 1982. The fractal geometry of nature. San Francisco: Free-man.
Masters K. 1990. Spray Drying Handbook. New York: Longmans. Money SR, York JW. 2001. Development of oral heparin therapy for
pro-phylaxis and treatment of deep venous thrombosis. Cardiovasc Surg, 9:211–18.
Pfeifer P, Avnir D. 1983. Chemistry in noninteger dimensions between two and three. I. Fractal theory of heterogenous surfaces. J Chem Phys, 79:3558–65.
Ross BP, Toth I. 2005. Gastrointestinal absorption of heparin by lipidiza-tion or coadministralipidiza-tion with penetralipidiza-tion enhancers. Current Drug Delivery, 2:277–87.
Salartash K, Gonze MD, Leone-Bay A, et al. 1999. Oral low-molecular weight heparin and delivery agent prevents jugular venous thrombosis in the rat. J Vasc Surg, 30:526–31.
Tattini V, Parra DF, Polakiewicz B, et al. 2005. Effect of lyophilization on the structure and phase changes of PEGylated-bovine serum albumin.
Int J Pharm, 304:124–34.
Torrado J, Illum L, Davis S. 1989. Particle size and size distribution of albumin microspheres produced by heat and chemical stabilization.
Int J Pharm, 51:85–93.
U.S. Pharmacopoeia National Formulary, USP XXIII NF XVIII. 1994. pg. 2300.
Wan L, Heng P, Chia C. 1991. Preparation of coated particles using a spray drying process with an aqueous system. Int J Pharm, 77:183–91. Weltermann A, Kyrle PA, Eichinger S. 2003. Novel anticoagulants for