Electronic Thesis and Dissertation Repository
7-30-2014 12:00 AM
The X-ray View of Galaxies in Compact Groups and the Coma
The X-ray View of Galaxies in Compact Groups and the Coma
Cluster Infall Region
Cluster Infall Region
Tyler D. Desjardins
The University of Western Ontario
Supervisor Sarah Gallagher
The University of Western Ontario Graduate Program in Astronomy
A thesis submitted in partial fulfillment of the requirements for the degree in Doctor of Philosophy
© Tyler D. Desjardins 2014
Follow this and additional works at: https://ir.lib.uwo.ca/etd
Part of the External Galaxies Commons
Recommended Citation Recommended Citation
Desjardins, Tyler D., "The X-ray View of Galaxies in Compact Groups and the Coma Cluster Infall Region" (2014). Electronic Thesis and Dissertation Repository. 2283.
https://ir.lib.uwo.ca/etd/2283
This Dissertation/Thesis is brought to you for free and open access by Scholarship@Western. It has been accepted for inclusion in Electronic Thesis and Dissertation Repository by an authorized administrator of
(Thesis format: Integrated-Article)
by
Tyler D. Desjardins
Graduate Program in Astronomy
A thesis submitted in partial fulfillment
of the requirements for the degree of
Doctor of Philosophy
The School of Graduate and Postdoctoral Studies
The University of Western Ontario
London, Ontario, Canada
In this thesis, we have explored what information may be gleaned from X-ray
observa-tions of galaxies in dense environments. We use X-ray observaobserva-tions from XMM-Newton
and the Chandra X-ray Observatory, and multi-wavelength ancillary data, to investigate
the X-ray emission of galaxies. First, we study the distribution and properties of the
intragroup di↵use X-ray emission in compact groups (CGs) of galaxies. From a sample of 19 CGs, we find the morphology of hot gas in low-mass groups is varied, and most
sys-tems have hot gas (if any) associated with only individual members. The galaxy-linked
hot gas is coupled with high star formation rates (SFRs), while only CGs with high
baryonic masses have substantial hot gas linked to the group environment. High-mass
CGs also agree well with the scaling relations between di↵use X-ray luminosity (LX), gas
temperature, and velocity dispersion predicted and observed in galaxy clusters,
indicat-ing that the hot gas in only massive CGs is virialized. We also investigate the relations
betweenLX, SFR, and stellar mass from individual members of CGs and the infall region
of the nearby Coma galaxy cluster, which is the only environment that has a mid-infrared
galaxy color distribution similar to CGs. The Coma galaxies agree with the scaling
rela-tions between LX, SFR, and stellar mass from the literature within uncertainties, while
the CG members often show an X-ray excess. We also used our multi-wavelength
obser-vations to identify active galaxies in the Coma infall sample and find that the fraction
of active galaxies is similar to the CG environment. From our observations of the di↵use X-ray emission in CGs, we find it unlikely that the intragroup hot gas is responsible for
the rapid transformation of galaxies from star-forming to quiescent. While the fraction of
nuclear activity in Coma infall and CG galaxies is similar, which may reflect the influence
of multi-galaxy gravitational interactions, the X-ray emission from individual galaxies in
the two environments is also markedly di↵erent.
Keywords: compact groups of galaxies, Coma cluster, di↵use X-rays, galaxy X-ray
emission, active galactic nuclei
The majority of the co-authors on the individual papers presented in this thesis work
are members of the HCG Collaboration, which represents experts on the topic of galaxy
evolution in compact groups of galaxies and who use multi-wavelength tools to study this
process. Their respective contributions to this work are described below.
Chapter 2
“Intragroup and Galaxy-Linked Di↵use X-ray Emission in Hickson Compact Groups”
Dr. Sarah C. Gallagher advised the author of this work on the use of X-ray analysis
tools, gave direction on the appropriate methodologies used in X-ray astronomy, and
helped shape the focus of the paper. Dr. Panayiotis Tzanavaris reduced the raw
X-ray data to its usable form using a previously written reduction code as described in
Section 2.2. Drs. John S. Mulchaey and Ann I. Zabludo↵ provided insight into the analysis and interpretation of X-ray data, as well as gave focus to the resulting paper,
through electronic communications. Dr. Gordon P. Garmire was the PI of several X-ray
observations used in the analysis. Drs. Caryl Gronwall, Ann E. Hornschemeier, Kelsey E.
Johnson, and Iraklis S. Konstantopoulos provided useful feedback to improve the quality
of the published manuscript.
Chapter 3
“Some Like It Hot: Linking Di↵use X-ray Luminosity, Baryonic Mass, and Star
Formation Rate in Compact Groups of Galaxies”
Dr. Sarah C. Gallagher provided useful advice concerning the determination of stellar
masses using SED-fitting. Drs. Ann E. Hornschemeier and John S. Mulchaey o↵ered suggestions to improve the quality of the manuscript, and Dr. Mulchaey specifically
o↵ered useful information on the dwarf galaxy populations of galaxy groups. Dr. William N. Brandt o↵ered useful suggestions in the analysis and interpretation of the X-ray data,
Johnson, and Panayiotis Tzanavaris provided useful feedback to improve the quality of
the published manuscript.
Chapter 4
“The X-ray Scaling Relations and AGN Fraction of Coma Infall Galaxies”
Dr. Ann E. Hornschemeier was the PI of the observing proposal that acquired the
primary data used in the paper and provided suggestions concerning the overall analysis
and structure of the paper. Dr. Sarah C. Gallagher provided helpful discussions
concern-ing the properties of active galaxies and o↵ered suggestions to improve the manuscript. Drs. Panayiotis Tzanavaris, Ann E. Hornschemeier, and Mr. Gregory Hrinda advised
on the calculations of the star formation rates and stellar masses. Ms. Laura Lenki´c
provided stellar masses and star formation rates for the compact group galaxy sample.
Dr. Andrew Ptak advised the author on the analysis of XMM-Newton data. Dr. Bret
Lehmer o↵ered useful advice concerning his previous study of the X-ray luminosities, star formation rates, and stellar masses of luminous infrared galaxies. Dr. Daniel Wik
used previously written computer code to generate the mosaics of the Coma clusterXMM
observations for use in the paper. Dr. Derek Hammer provided the multi-wavelength
cat-alogs assembled from the literature that were used in one of his previous works. Dr. Neal
Miller provided the author with radio measurements of the Coma infall galaxies from one
of his previous works.
something or to understand something. Nothing can compare with that experience...”
— Dr. Cecilia Payne-Gaposchkin
Abstract ii
Co-Authorship Statement iii
List of Figures xiii
List of Tables xv
List of Abbreviations 1
1 Introduction 1
1.1 Groups and Clusters of Galaxies . . . 1
1.2 Theoretical Overview of Gas in Systems of Galaxies . . . 8
1.2.1 Mass-Fraction and Distribution . . . 9
1.2.2 Temperature and Phase . . . 11
Heating . . . 11
Cooling . . . 14
The Importance of Gas Temperature and Phase . . . 15
1.2.3 The E↵ects of Environment on Galaxy Evolution . . . 16
1.3 Observations of Extragalactic Gas in Compact Galaxy Groups . . . 17
1.3.1 Molecular Gas . . . 18
1.3.2 H i Gas . . . 22
1.3.4 Hot Gas . . . 28
1.3.5 X-ray Binaries and Active Galactic Nuclei . . . 35
Accretion Power . . . 35
Properties of X-ray Binaries . . . 37
Active Galactic Nuclei . . . 38
1.4 Summary . . . 39
References . . . 42
2 Intragroup and Galaxy-Linked Di↵use X-ray Emission in Hickson Com-pact Groups 49 2.1 Introduction . . . 49
2.2 Sample Definition, Observations, and Data Reduction . . . 54
2.3 Spectral Extraction and Modeling . . . 58
2.3.1 Point Source Detection and Removal . . . 58
2.3.2 Extraction of the Di↵use Emission . . . 59
2.3.3 Spectral Model Fitting . . . 60
2.4 Results and Discussion . . . 64
2.4.1 Gas Distribution and Morphology . . . 69
2.4.2 The LX T and LX Relations Re-visited . . . 77
2.4.3 Comparison of the X-ray Data with H i Gas . . . 83
2.4.4 Di↵use X-ray Emission and Specific Star Formation Rates . . . . 90
2.5 Summary . . . 91
2.5.1 Future Work . . . 93
References . . . 94
3 Some Like It Hot: Linking Di↵use X-ray Luminosity, Baryonic Mass,
and Star Formation Rate in Compact Groups of Galaxies 100
3.2 Sample Description . . . 102
3.3 Analysis . . . 109
3.3.1 X-ray Observations . . . 109
3.3.2 Optical Data . . . 117
3.3.3 Stellar Mass Determination . . . 119
3.4 Results and Discussion . . . 121
3.4.1 X-ray Morphology . . . 123
3.4.2 X-ray Scaling Relations . . . 124
3.4.3 Relating X-ray Emission to the Baryonic Mass . . . 130
3.4.4 X-ray Emission and the H i Reservoir . . . 138
3.4.5 Comparison of Di↵use X-rays with Star Formation . . . 140
3.5 Summary and Conclusions . . . 143
References . . . 147
4 The X-ray Scaling Relations and AGN Fraction of Coma Infall Galaxies155 4.1 Introduction . . . 155
4.2 Data and Sample Selection . . . 159
4.3 Analysis . . . 160
4.3.1 Galaxy Stellar Masses . . . 163
4.3.2 Star Formation Rates . . . 168
4.3.3 XMM Data Reduction . . . 184
4.3.4 Coma XMM Photometry . . . 185
4.3.5 Compact Group Comparison Sample, Chandra Data Reduction, and X-ray Photometry . . . 204
4.4 Results and Discussion . . . 213
4.4.1 AGNs in the Coma Infall Environment . . . 213
4.4.2 The Relation Between LX, SFR, and Stellar Mass . . . 224
References . . . 252
5 Conclusion 259
References . . . 264
Appendix A Notes on Individual Groups from Chapter 2 265
Curriculum Vitae 269
1.1 The Luminosity Function of Galaxies Fitted with a Schechter Function . 3
1.2 Distribution of Mid-Infrared Colors in Compact Group Galaxies . . . 6
1.3 Multi-wavelength View of the M82 Starburst . . . 13
1.4 Cooling Efficiency of Semi-Fobidden Lines, Fobidden Lines, and Bremsstrahlung Radiation . . . 16
1.5 CO (1-0) Contour Maps of HCGs 31A+C and 92C . . . 20
1.6 VLA H i Contours of HCGs 7, 26, and 92 . . . 23
1.7 H↵ Image of HCG 31 . . . 25
1.8 LX T and LX Scaling Relations of Groups and Clusters . . . 29
1.9 ROSATX-ray Map of HCG 16 . . . 31
1.10 ChandraX-ray Map of Seyfert’s Sextet (HCG 79) . . . 32
2.1 Three Color Image of HCG 16 . . . 71
2.2 X-ray Contour Maps . . . 72
2.3 LX T Diagram for Compact Groups . . . 79
2.4 LX Diagram for Groups . . . 80
2.5 H i Gas Mass with E/S0 Fraction . . . 85
2.6 H i Gas Mass and Di↵use X-ray Emission . . . 86
2.7 Specific Star Formation Rate and Di↵use X-ray Emission . . . 88
3.1 Comparison of Stellar Mass Determination Methods . . . 120
3.2 Continued. . . 126
3.2 Continued. . . 127
3.3 LX , LX T, and T Relations . . . 128
3.4 CG Di↵use X-ray Luminosity and the Total Neutral Gas and Stellar Mass 132 3.5 Comparison of Fossil Group Selection Methods for CGs . . . 135
3.6 X-ray Emission from CGs and the Neutral Gas Fraction . . . 139
3.7 Comparison of the CG X-ray Luminosities and Total Group SFR . . . . 141
4.1 XMM Image of the Coma Cluster . . . 161
4.2 Zoomed XMM Image of the Coma Cluster Infall Region . . . 162
4.3 NUV–r vs. r Color-Magnitude Diagram of Coma Infall Galaxies . . . 164
4.4 Coma Galaxy Stellar Mass Determination Comparison . . . 167
4.5 Histograms of Star Formation Rates, Stellar Masses, and Specific Star Formation Rates of Coma Sample Galaxies . . . 169
4.6 Comparison of X-ray Spectrum of HCG 92C with and without AGN . . . 212
4.7 BPT Diagram of the Coma Cluster X-ray Targets with Emission Line Spectra . . . 215
4.8 Mid-IR AGN Selection Color-Color Diagrams . . . 218
4.9 X-ray Luminosity vs. Stellar Mass of Coma, Compact Group, and Field Galaxies . . . 226
4.10 Observed and Predicted 2–10 keV X-ray Luminosities of Star Forming Galaxies in the Coma Infall, Compact Group, and the Lyman Break Ana-log Samples . . . 230
4.11 HST/ACS F814W Images of Coma Galaxy 77 with X-ray Source, Optical Point Source, and SDSS Spectral Fiber Regions . . . 237
4.12 Deblending of the [N ii]+H↵ Line Complex in Coma Galaxy 77 . . . 239
4.14 Color-Magnitude Diagram of the Optical Point Sources within 1000 of the
Coma Galaxy 77 X-ray Centroid Including AGN Estimates . . . 243
2.1 ChandraObservation Information . . . 56
2.2 Best Fit Spectral Model Parameters of CG Di↵use X-ray Emission . . . . 62
2.3 Properties of Sample HCGs . . . 65
2.4 Comparison ofChandra and ROSAT Measurements . . . 67
3.1 Compact Group Sample . . . 103
3.2 Extended Group Membership . . . 107
3.3 Summary ofChandra ACIS Observations . . . 111
3.4 Extraction Region Parameters . . . 114
3.5 Best-Fitting X-ray Model Parameters . . . 115
3.6 Total Group Stellar Masses Using Core Galaxies . . . 122
4.1 XMM Observation Summary . . . 165
4.2 Coma Galaxy Properties . . . 170
4.3 Flare-Cleaned XMM-Newton Exposure Times . . . 186
4.4 Best-Fitting Model Parameters of X-ray-Detected Coma Infall Galaxies . 188 4.5 Weighted Average Fluxes of Detected Coma X-ray Sources . . . 190
4.6 X-ray Flux Upper Limits of Non-Detected Coma Infall Galaxies . . . 191
4.7 Compact Group ChandraObservations . . . 203
4.8 Model Parameters and Fluxes of Compact Group Galaxies . . . 206
4.9 Coma AGNs and Their Detection Methods . . . 220
4.12 HST/ACS Photometry of Optical Point Sources in Source 77 . . . 234
2MASS: Two Micron All Sky Survey
ACIS: Advanced CCD Imaging Spectrograph
ACS: Advanced Camera for Surveys
AE: ACIS Extract (software for analysis of Chandra data1) AGB: Asymptotic giant
branch
AGN: Active galactic nucleus
APO: Apache Point Observatory (ground observatory)
ARF: Ancillary response file
BC: Blue-cloud
C3B: Coma-3 Bottom field
C3T: Coma-3 Top field
CfA2: Second Center for Astrophysics redshift survey
CG: Compact group of galaxies
CIAO: Chandra Interactive Analysis of Observations (Chandradata analysis software2)
CMB: Cosmic microwave background
CMD: Color-magnitude diagram
DR7/DR9: Seventh and ninth data releases of the SDSS, respectively
DSS: Digitized Sky Survey
E/S0 galaxies: Elliptical and lenticular galaxies EPIC: European Photon Imaging
Cam-era
FWHM: Full-width at half-maximum
FUV: Far Ultraviolet
GALEX:Galaxy Evolution Explorer (space observatory)
GBT: Green Bank Telescope (ground observatory)
1http://www2.astro.psu.edu/xray/docs/TARA/ae users guide.html 2http://cxc.harvard.edu/ciao/
ICM: Intracluster medium
IGM: Intragroup medium; alternatively intergalactic medium
IR: Infrared
IRAC: Infrared Array Camera
IRAF: Image Reduction and Analysis Facility3
ISM: Interstellar medium
LBA: Lyman Break Analog galaxy
LINER: Low ionization nuclear emission-line region
LMXB: Low-mass X-ray binary
MIPS: Multi-band Imaging Photometer for SIRTF
N48: NGC 4839 field
NED: NASA Extragalactic Database
NGC: New general catalog
NRAO: National Radio Astronomy Observatory
NUV: Near Ultraviolet
obsID: Observation identifier
ODR: Orthogonal distance regression
PHA: Pulse height amplitude
POSS: Palomar Observatory Sky Survey
PSF: Point spread function
PSPC: Position Sensitive Photon Counter
PyRAF: Python-based IRAF4
RASS: ROSAT All Sky Survey
RMF: Response matrix file
3http://iraf.noao.edu
4http://www.stsci.edu/institute/software hardware/pyraf
RSCG: Redshift survey compact group
S/N: Signal-to-noise ratio
SAS: Scientific Analysis System (XMM-Newtown data analysis software5)
SED: Spectral energy distribution
SDSS: Sloan Digital Sky Survey
SFR: Star formation rate
sSFR (or SSFR): Specific star formation rate
SSP: Simple stellar population
SSRS2: Second Southern Sky Redshift Survey
SXRB: Soft X-ray Background
UV: Ultraviolet
UVOT: Ultraviolet Optical Telescope
VFAINT: Very Faint
VLA: Very Large Array (ground observatory)
WISE: Wide-field Infrared Survey Explorer (space observatory)
WFPC2: Wide-Field Planetary Camera 2
XMM: XMM-Newtown (space observatory)
XRB: X-ray binary
⇤CDM: Cold dark matter cosmology including dark energy
5http://xmm.esac.esa.int/sas/
Introduction
1.1
Groups and Clusters of Galaxies
As the majority of galaxies in the nearby Universe are found within gravitationally bound
systems such as groups (e.g., Tully 1987; Small et al. 1999; Karachentsev 2005),
un-derstanding the physical processes at work in these systems is fundamental to galaxy
formation and evolution, as well as cosmological theory. Systems of galaxies are often
described in terms of their richness, i.e., the number of galaxies that are gravitationally
bound members. The poorest systems, with typically . 50 members having L ⇠ L⇤, constitute groups, while the richest systems are termed clusters and may contain several
thousand members. The term L⇤ refers to the characteristic luminosity of the Schechter
function, which is a mixed exponential power-law fit to the galaxy luminosity function
with the form (L) = ( ⇤/L⇤) (L/L⇤)↵
e (L/L⇤)
, where (L) is the number of galaxies
per unit luminosity per unit volume, ⇤ is the power law normalization, and ↵ is the
power law exponent (Schechter 1976). TheL⇤ value specifically indicates the luminosity
at which the function turns over from being dominated by a power-law (low luminosity)
to an exponential (high luminosity) term. For comparison, the Milky Way is
approxi-mately anL⇤ galaxy (Binney & Merrifield 1998). We show an example galaxy luminosity
function, with a Schechter function fit, from Blanton et al. (2001) in Figure 1.1. In
ad-dition to the relatively luminous galaxies, examination of luminosity functions in these
systems reveals that they also contain varying numbers of dwarf galaxies (e.g., Sandage
et al. 1985; Binggeli et al. 1988; Zabludo↵ & Mulchaey 1998), with a weak dependence of the Schechter function turnover on the richness of the system (Hansen et al. 2009).
We emphasize to the reader that the richness criterion for separating groups and clusters
should be regarded carefully, as the richness of systems of galaxies is a continuum, and
a one dimensional distinction such as this does not necessarily separate objects that are
subject to di↵erent physical processes and that exhibit di↵erent characteristics.
As a subclass, compact groups (e.g., Shakhbazyan 1973; Hickson 1982; Barton et al.
1996) are systems in which the galaxies are separated on the sky by typically no more
than a few galaxy radii. This proximity leads to increased probabilities of tidal
inter-actions and subsequent mergers. The sample definitions for these groups vary between
catalogs, however there are two selection criteria that are typical: (1) compactness as
de-fined by an average surface brightness in a specific photometric bandpass and measured
over a defined aperture; and (2) the number of galaxies (& 3) having similar luminosity
(e.g., within 3 mag of the brightest member) and redshifts within some multiple of
stan-dard deviations from the group mean velocity. Hickson Compact Groups (HCGs) are
particularly interesting environments in which to study galaxy evolution and the
inter-action between galaxies and their environment. Not only are the galaxies close together,
but Hickson (1982) also introduced an isolation criterion given by ✓N 3 ✓G. In this
constraint, ✓N is the angular diameter of the largest circle that does not contain
non-members of similar luminosity or brighter, while ✓G is the smallest circle that contains
all of the geometric centers of the member galaxies. Hickson’s other criteria included
N >4, though recent studies include groups with onlyN >3, where N is the number of
accordant galaxies (i.e., galaxies of similar redshift) having Johnson B filter magnitudes
Figure 1.1: The luminosity function vs. absolute magnitude of galaxies in the SDSS r-band adapted from Blanton et al. (2001). The top panel shows the luminosity function, while the bottom panel shows the number of galaxies in each bin used to determine the luminosity function. The x-axis has units of magnitudes, while the y-axis has units of galaxies h3 Mpc 3 mag 1. Note that the values on the x-axis are such that bright galaxies are to the left and faint galaxies are to the right. The thick black line in the top panel shows the Schechter function (Schechter 1976) fit to the data. At Mr = 20.06,
surface brightness measured over✓G.
Similar in some ways to CGs, fossil groups represent one end stage to galaxy evolution
in the group environment. Fossil groups were defined by Jones et al. (2003) to be groups
in which: (1) the luminosity of di↵use, hot (T⇠106–107 K) gas is L
X,bol &1041.4 erg s 1
(assuming H0 = 70 km s 1, ⌦= 1, and ⌦⇤ = 0.7); and (2) the di↵erence in magnitude
between the two brightest galaxies within half the virial radius m12 2 mag in the
Johnson-Cousins R-band. The X-ray criterion ensures that the group is gravitationally
bound, while the optical requirement attempts to select groups where most of the stellar
mass is concentrated in a single galaxy. The authors described the formation of fossil
groups as a result of successive mergers of ⇠L⇤ galaxies in normal groups. The e↵ect of dynamical friction causes the most massive galaxies to sink to the center of the
grav-itational potential faster than lower mass members. These massive galaxies will merge
on relatively short timescales (a few tenths of a Hubble time, where one Hubble time
is the quantity 1/H0, or approximately 13.8 Gyr). Thus, similar to CGs, most of the
luminous matter in fossil systems is confined to a relatively compact region. We will
revisit the topic of fossil groups as a comparison sample and explore their relation to
compact groups further in Chapters 2 and 3.
With respect to galaxies, the term evolution refers to changes in three di↵erent observ-ables: the star formation rate history (which manifests itself as changes in the spectral
energy distribution [SED]); the stellar kinematics; and the metallicity, mass-fraction,
distribution, temperature, and phase of the gas. Some of these properties may manifest
themselves in the form of morphological changes (e.g., a spiral becoming a lenticular
galaxy), which reflect well the stellar and gas distributions. The transformation of the
SED due to the star formation rate history can be best understood in terms of a simple
stellar population (SSP). Though high-mass, hot stars are less numerous compared to
their low-mass, cool counterparts, evolved massive stars have low mass-to-light ratios,
the high-mass stars exhaust their fuel and end in supernovae, while the low-mass stars
remain on the main sequence for longer than 10 Gyr. This causes the
optical/near-infrared to become relatively more luminous compared to bluer wavelengths (e.g., the
ultraviolet). The use of a single SSP to describe a galaxy is obviously an
oversimplifi-cation, as galaxies are better characterized by continuous and/or multiple, discrete star
formation events over several Gyr (i.e., the history of the star formation rate). Further,
the evolution of high-mass stars as they leave the main sequence and evolve along the
red giant, horizontal, and asymptotic giant branches will have observable e↵ects on the SED. However, the use of a SSP in this context is adequate to describe the gross changes
observed in galaxy SEDs. The kinematic evolution occurs as spiral galaxies progress from
disk-dominated to bulge-dominated systems. In elliptical galaxies, which are likely the
result of major mergers, the stars have mostly random orbits (though with some small
rotational component), while lenticular galaxies have a dominant bulge component and
a relatively stronger disk (compared with elliptical galaxies) that has a net rotation. See
Kormendy & Bender 2012 for a discussion on the properties and formation mechanisms
of elliptical and lenticular galaxies.
Recently, much work has been done on the study of the evolutionary history of galaxies
in compact groups through a variety of observational tools (e.g., activity in galaxy nuclei,
star cluster populations, galaxy color-magnitude diagrams; Gallagher et al. 2008, 2010;
Konstantopoulos et al. 2010; Fedotov et al. 2011; Konstantopoulos et al. 2011, 2012,
2013; Walker et al. 2013; Tzanavaris et al. 2014). Johnson et al. (2007) reported a gap
in the mid-infrared colors from Spitzer Infrared Array Camera (IRAC) imaging of 12
HCGs containing 45 galaxies, with only two galaxies located in the gap range. This
was subsequently verified and statistically quantified by Walker et al. (2010). Walker
et al. (2012)1 expanded the sample to 49 compact groups from both the HCG catalog
Figure 1.2: Left: Mid-infrared color-color diagram of CG galaxies. The black points show the CG galaxies, the dashed lines show the linear and second-order polynomial fits to the galaxy colors, and the shaded box shows the position of the mid-infrared gap from Johnson et al. (2007). Right: Histogram of the mid-infrared colors (CMIR) of galaxies in the sample of 49 compact groups used in Walker et al. (2012). The values of CMIR represent a rotated mid-infrared colorspace defined by the curve fit to the CG galaxies in the left panel. The vertical dotted lines indicate the width of the mid-infrared canyon. This canyon implies a rapid transformation of galaxies in the compact group environment from mid-infrared active to mid-infrared quiescent. Adapted from Figures 3 and 4 of Walker et al. (2012).
from Hickson (1982) and the Redshift Survey Compact Group (RSCG) catalog of Barton
et al. (1996). Figure 1.2 shows the mid-infrared canyon from Walker et al. (2012) with
the canyon centered at CMIR ⇡ 0, where CMIR refers to the mid-infrared color in a rotated colorspace defined by fitting a curve to the CG galaxies on a log10(f8.0 µm/f4.5 µm)
vs. log10(f5.8 µm/f3.6 µm) diagram. Galaxies with mid-infrared colors above the canyon
in Figure 1.2 are brighter at longer wavelengths, which indicates the presence of warm
dust likely heated by star formation, while galaxies with colors below the canyon are
quiescent. Tzanavaris et al. (2010) used Swift Ultraviolet Optical Telescope (UVOT)
near-ultraviolet and Multiband Imaging Photometer for Spitzer (MIPS) 24 µm data,
which sample the emission of young, hot stars that are “naked” and heavily reddened by
rates (SSFR2; i.e., the star formation rate normalized to the stellar mass of the galaxy)
of CG galaxies. Note that the mid-infrared canyon and SSFR gap are specific to compact
groups and only observed in one other environment (the Coma infall region), suggesting
that the compact environment is conducive to the creation of the mid-infrared canyon.
At optical wavelengths, the CMD of galaxies shows two primary distributions: the
“blue-cloud”; and the “red-sequence”. These two groupings refer to actively star-forming,
blue galaxies and quiescent, red galaxies, respectively. Between these lies a third
distri-bution called the “green valley” that contains galaxies with intermediate colors that may
be transitioning from the blue-cloud to the red-sequence as they age and their star
for-mation ceases. The mapping of the mid-infrared colorspace to the optical CMD is not
clear, but a comparison of the mid-infrared canyon and SSFR gap reported by Johnson
et al. (2007), Walker et al. (2010, 2012), and Tzanavaris et al. (2010) indicates that
the galaxies with low specific star formation rates (SSFR. 10 11 M yr 1) have bluer
mid-infrared colors (i.e., to the left of the canyon in Figure 1.2), while those with large
rates (SSFR & 10 10 M yr 1) have redder mid-infrared colors (Lenki´c et al., in prep).
Walker et al. (2013) found that the mid-infrared canyon galaxies correspond to optical
red sequence galaxies, whereas they had been previously hypothesized to be in the optical
green valley (Walker et al. 2012). The authors argue that the mid-infrared canyon may
then indicate that the CG environment may be inhospitable to low-mass galaxies with
moderate star formation. The authors conclude that the CG environment appears to
enhance or end star formation in galaxies, but that moderate levels of star formation are
rare. What remains a mystery is which processes are at work in CGs that cause these
e↵ects, and if those processes are in some way dependent on other properties of the CG environments (e.g., mass, interaction history, the presence of a hot intragroup medium).
The first two-thirds of this thesis presented in Chapters 2 and 3 concerns the
fraction, distribution, temperature, and phase of the gas in the group environment. While
important, we do not include the X-ray gas metallicity as it is quite complex and merits
a comprehensive study on its own. Specifically, we examine the hot, X-ray emitting,
intragroup/intracluster medium (IGM/ICM3) gas in groups and clusters of galaxies. The
last third of this thesis (Chapter 4) discusses in more detail the relationships between
star formation, stellar mass, and the X-ray emission from individual galaxies in dense
environments, including the presence of actively accreting supermassive black holes in
galaxy nuclei.
Prior to presenting our work and results in subsequent chapters, we first discuss in
the remaining sections of this chapter the physics underlying intragroup gas, including
gas heating and cooling, and an overview of gas in molecular, neutral atomic, and ionized
states. This is followed by a discussion of observations of gas in compact galaxy groups.
Particular emphasis is placed on the implications of intragroup gas with respect to galaxy
evolution. We then briefly introduce the concept of accretion onto compact objects, i.e.,
X-ray binaries (XRBs) and active galactic nuclei (AGN), to acquaint the reader with
these topics prior to the discussion of these phenomena in Chapter 4.
1.2
Theoretical Overview of Gas in Systems of
Galax-ies
The gas in galaxies plays a pivotal role in their evolution, mostly as fuel for star formation
in the case of cold molecular gas. The quantity and distribution of cold gas dictates how
much and where star formation will occur. Similarly, the cool, atomic H i gas has an important role in star formation as it can be transformed into molecular gas when the
gas density is high (and where there is interstellar dust). Finally, the hot gas traced by
X-ray emission, for the moment, has been removed from the star forming process until
cooling mechanisms lower the gas temperature. Clearly, the role of gas in galaxies is
critical, and thus we discuss the gas properties that are important to galaxy evolution in
this section.
In addition to the e↵ects that gas temperature and phase have on galaxy evolution, hot, ionized gas in intragroup/intracluster media is important in terms of cosmological
theory. Cosmological hydrodynamical simulations of clusters using dark energy and cold
dark matter (⇤CDM) have found that the fraction of baryons in stars may be as little as 20% (Borgani et al. 2004), while observations suggest a value closer to 10% (e.g., Balogh
et al. 2001; Lin et al. 2003). This raises the question: where are the missing baryons?
As we have discussed previously, numerous gravitational encounters have the potential
to liberate large quantities of gas from the galaxies and deposit it into the extragalactic
space. Due to the large dynamical masses of clusters (⇠1015 M ), we expect that the virial temperatures of these systems are quite high, while the temperatures of groups
(⇠1012 M ) are somewhat lower compared to richer systems. Therefore, a significant amount of mass in clusters, and to a lesser extent in groups, may be in the form of a
hot medium that pervades the space between galaxies. This is important because to
accurately determine the cosmological parameter ⌦, and hence the ratio of the observed total density (⌦ = ⌦BM + ⌦DM + ⌦⇤, where the subscripts BM, DM, and ⇤ refer
to baryonic matter, dark matter, and dark energy respectively) to the critical density of
the Universe, we must account for all of the baryonic matter. Due to the expected high
virial temperature of the intragroup/intracluster gas, we require X-ray observations to
accurately characterize it (see Section 1.3.4).
1.2.1
Mass-Fraction and Distribution
We first consider the mass-fraction of gas in galaxies and their surrounding environments,
the mass-fraction and distribution together because of how dependent these parameters
are on each other in terms of both galaxy evolution and gas processing.
Large reservoirs of gas exist within galaxies, and that gas may be transferred into
the IGM/ICM. Elliptical and lenticular (E/S0) galaxies have relatively little cool gas
compared to spiral and irregular types (Blanton & Moustakas 2009). Specifically, spiral
and elliptical galaxies have been observed to have 10–20% and .1% of their baryons in
cool and cold gas phases, respectively (Knapp et al. 1985; Read & Trentham 2005). In
tidal encounters involving one or more cold gas-rich galaxies, we can expect that some of
the gas, in addition to stellar mass, will be ejected into extragalactic space. Regarding
the consequences in terms of galaxy evolution, this release of gas is important because
it limits the amount of fuel available for future star formation events within the confines
of the galaxies. If enough angular momentum is lost to the tidal interaction, gas may
also be funneled into the nucleus of the galaxy triggering nuclear star formation and/or
accretion onto the supermassive black hole located there.
In addition to the loss of gaseous material in tidal encounters, the gas mass inside the
galaxies is depleted over time due to its consumption in star formation. Evolved,
low-mass stars return material to the interstellar medium through winds; however, stars with
masses M . 0.87 M stay on the main sequence for longer than a Hubble time4. The
number of low-mass stars formed in a given star formation event as described by the initial
mass function (i.e., the frequency distribution of stellar masses formed from a collapsing
cloud of star-forming material) is far greater compared to high-mass stars (e.g., Salpeter
1955; Miller & Scalo 1979; Kroupa 2001), therefore the bulk of gas consumed in star
formation may be considered e↵ectively removed from the system. The e↵ect of star formation on the depletion of gas reservoirs is likely only important over the lifetimes
of most galaxies (excepting, e.g., starbursts). The ways in which star formation a↵ect galaxy evolution may be better understood in terms of the SSFR. The SSFR has units of
4This comes from the relation ⌧ms ⇡1010(M/M ) 2.5
inverse time, and is thus related to a characteristic timescale of star formation. Typical
sSFRs are ⇠10 10 yr 1 (Brinchmann et al. 2004), thus the buildup of long-lived stellar populations in galaxies happens on timescales of 1010 years.
Finally, while gas mass loss is clearly prevalent in galaxies from our discussion thus
far, external gas may also be accreted onto galaxies from the surrounding circumgalactic
medium and onto groups/clusters from the intergalactic medium (e.g., Kereˇs et al. 2005
and Gunn & Gott 1972, respectively). This gas may be either cold or hot (i.e., neutral
or ionized), but in either case it leads to growth of the system. In galaxies, this gas may
subsequently be cooled and used in the production of new stars, while in groups/clusters
this gas is likely trapped in the potential well of the system and heated (see the discussion
on virialization in Section 1.2.2).
1.2.2
Temperature and Phase
As previously stated, the temperature and, by extension, the phase of the gas are also
important in the context of evolution. Gas may be both heated and cooled, within and
outside of the galaxies, by several di↵erent processes. We begin by broadly discussing heating mechanisms, followed by cooling mechanisms, and then discuss the implications
of the gas temperature and phase on galaxy evolution.
Heating
The primary means through which gas is heated outside of galaxies isvirialization. This
mechanism is described by the virial theorem, which states that in a gravitationally
bound system in equilibrium
2hKi=hUi, (1.1)
stars in a globular cluster), when we consider a system of gas particles, we note that the
characteristic temperature of the system can be described using the relation
1
2hUi=hKi= 3
2kTvirial, (1.2)
where k is the Stefan-Boltzmann constant and Tvirial is the virial temperature. The
potential energy indicated is dictated by the mass distribution of the system. Note that
this applies to any system of bound particles, therefore galaxies may virialize the gas
surrounding them with their own potential, in addition to heating by the group or cluster.
Clearly, the larger hUi becomes, the hotter the gas will be under ideal conditions. The application of the virial theorem to observations is useful because it allows us to calculate
the mass of the X-ray emitting gas in galaxy clusters and groups from the temperature
and light distributions of the X-rays (if the assumptions of equilibrium and spherical
symmetry are valid and the signal-to-noise ratio of the X-ray observations is sufficiently high).
In addition to virialization, gas both inside and outside of galaxies may be heated by
shocks. Inside of galaxies, the shocks from supernovae may heat gas to temperatures of
⇠106 107 keV (cf. the Local Bubble; Cox & Reynolds 1987). These supernovae may eject gas along a path perpendicular to the plane of the galaxy in a phenomenon similar to
a galactic fountain. If ejected with enough energy, the gas may escape the potential well
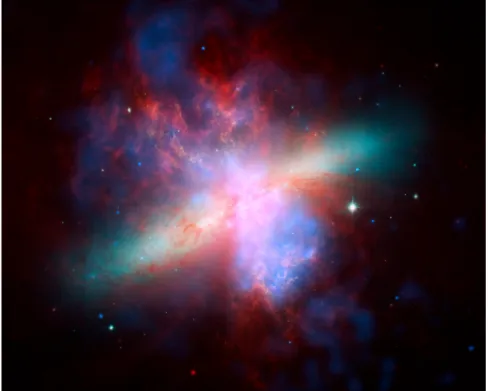
of the galaxy. This e↵ect is illustrated using the example of M82, a starbursting galaxy in the M81 group. Seen in Figure 1.3, the intense star formation (⇠10 M yr 1; Barker et al. 2008) in a relatively low-mass galaxy has lead to an abundance of supernovae in the
nuclear region of the galaxy with a rate of ⇠0.1 yr 1 (Bartel et al. 1987; McLeod et al. 1993). Referred to as a galactic superwind, the hot gas can be seen to large distances
from the plane of M82 (Strickland et al. 1997 and references therein).
Figure 1.3: Multiwavelength image of M82, where blue represents X-rays, green and orange colors are optical light, and red is mid-infrared light imaged with the Chandra X-ray Observatory, Hubble Space Telescope, and Spitzer Space Telescope, respectively. Notice the large plumes of hot gas that lie perpendicular to the semi-major axis of the galaxy. This hot gas has been expelled by numerous supernovae due to enhanced star formation within the disk (see Suchkov et al. 1996 for a full discussion). Image credit: X-ray: NASA/CXC/JHU/D.Strickland; Optical: NASA/ESA/STScI/AURA/The Hubble Heritage Team; IR: NASA/JPL-Caltech/Univ. of AZ/C. Engelbracht.
In this scenario, gas in clusters and groups is heated by the motions of the galaxies
them-selves. Unlike virialization, which is related to the kinematics of the galaxies as a result
of the total system mass, shock heating of gas relies on galaxies moving supersonically
through gas in the surrounding medium. The rapid compression of the gas heats it to
much higher temperatures and likely ionizes it (though it may not dissociate molecular
gas; see, e.g., Cluver et al. 2013).
Finally, an additional mechanism to heat gas inside galaxies and in their surrounding
environment is photoionization. One method for this type of heating is the presence of
an active galactic nucleus (AGN). High-energy photons from the accretion of gas onto
geometry, and ionize the surrounding gas (in particular, this refers to the narrow line
region, which may extend many kpc from the nucleus; Koski 1978; Ogle et al. 2000).
Depending on the geometry of the AGN/host galaxy, the ionizing radiation may a↵ect the host galaxy itself, or the gas in the circumgalactic medium. As AGNs tend to be
rare in groups, and those that are present are quite weak (e.g., Del Olmo et al. 2010;
Mart´ınez et al. 2010; Tzanavaris et al. 2014), we do not include gas heated by AGNs in
our observational discussion. In addition, the ultraviolet light from young, massive stars
will ionize any surrounding neutral gas. We refer the reader to Section 1.3.3 for a full
discussion of this e↵ect. Cooling
As energy is radiated away, hot gas becomes cooler. If the gas temperature is in excess of
⇠106K, as is the focus of the thesis, and the gas is optically thin (i.e., radiation is allowed to escape the gas with minimal absorption), then the primary means through which
energy is lost is bremsstrahlung radiation, also called free-free emission. Bremsstrahlung
radiation occurs when a free, charged particle (usually an electron) accelerates due to the
electromagnetic force exerted on it by another particle. The kinetic energy lost by the
particle in the encounter is radiated away. In the case of a hot plasma, bremsstrahlung
radiation is the result of encounters between free electrons and ions. As can be seen
in Equation 1.2, the average kinetic energy of the particles in the plasma is directly
proportional to the temperature of the gas. Therefore, repeated encounters between free
electrons and ions reduce the average kinetic energy of the system through radiation and
result in cooling. In general, the rate at which this cooling occurs per unit volume can
be represented as
rcool =n2⇤(T), (1.3)
inter-action between free particles in the gas. In principle, we can determine the time required
for a hot plasma to cool by equating the product of the cooling rate, volume of the gas,
and cooling time with the total kinetic energy of the gas. Seward & Charles (2010)
approximate this time, assuming only bremsstrahlung radiation, as
tcool ⇡(2.5⇥107)n 1(kT)1/2, (1.4)
where tcool is in units of years.
In addition to bremsstrahlung radiation, cooling may also occur due to line, or
bound-bound, emission. The relative importance of line emission in radiative cooling depends
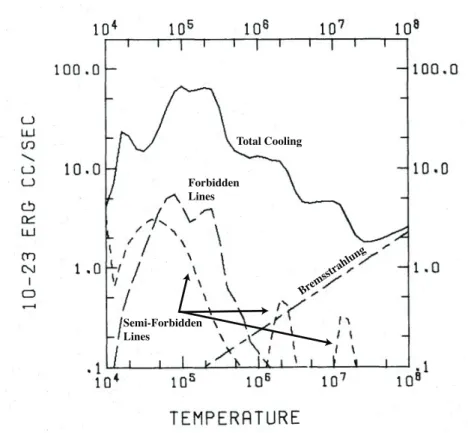
upon the temperature and chemical makeup of the gas. As can be seen in Figure 1.4, the
relative importance of line emission in cooling is negligible compared to bremsstrahlung
radiation untilT .106K. In hot gas, iron is the primary element responsible for line
cool-ing. In particular, semi-forbidden transitions in highly ionized species such as Fe XVIII
and Fe XIX emit at X-ray wavelengths (Raymond et al. 1976).
The Importance of Gas Temperature and Phase
The existence and properties of gas both inside and outside of galaxies are important
when considering the evolution of galaxies. We remind the reader that molecular gas
is the fuel for star formation. As the gas is converted into other phases (e.g., warm
ionized) by various processes, the loss of molecular gas quenches star formation. It is for
this reason that elliptical galaxies have very low star formation rates, as most of the gas
exists in a hot, ionized halo surrounding the galaxy. If this gas could be cooled e↵ectively, then it would return to a neutral atomic state and potentially aid in the formation of
Brems strah
lung Total Cooling
Forbidden Lines
Semi-Forbidden Lines
Figure 1.4: The cooling efficiency ⇤ as a function of temperature. The short-dash, long-dash, short-long-long-dash, and solid lines represent the semi-forbidden line, forbidden line, bremsstrahlung, and total cooling efficiencies. Note that at temperatures above⇠106 K, bremsstrahlung radiation becomes the dominant cooling mechanism. Figure adapted from Raymond et al. (1976).
1.2.3
The E
↵
ects of Environment on Galaxy Evolution
Galaxies residing in high galaxy density environments are expected to experience
pro-cesses leading to “strangulation”, i.e., the rapid depletion of the cold gas supply in
gas-rich galaxies. This depletion may occur through two primary processes: (1)
colli-sions/harassment; and (2) stripping. Galaxy harassment, or frequent tidal interactions
between galaxies, enhances star formation and causes the gas to be transformed into
stellar mass; collisions have a similar e↵ect. During the interactions, some mass may also be ejected into the space between the galaxies.
While harassment and collisions are fundamentally N-body problems, the primary
an e↵ect caused by the motion of a galaxy through a gaseous medium. Prior to X-ray observations, Gunn & Gott (1972) hypothesized the existence of a hot intracluster
medium in the Coma galaxy cluster and described the e↵ects of ram-pressure stripping. The pressure felt by a galaxy moving through a gaseous medium is described as
P =⇢vgal2 , (1.5)
where P is the pressure exerted on the galaxy, ⇢ is the density of the hot gas between
galaxies, andvgal is the velocity of the galaxy relative to the medium that is acting upon
it.
In both cases of harassment and stripping, it is clear that the environments of galaxies
can have profound e↵ects on their evolution. Furthermore, neither process is independent of the other, and both may be necessary to explain the evolution of galaxies in dense
environments. We will return to the importance of ram-pressure stripping in Chapter 5.
1.3
Observations of Extragalactic Gas in Compact
Galaxy Groups
Due to the di↵ering observational methods used to study gas, we group the information presented in this section into four subsections according to phase: cold, molecular gas;
cool, atomic H i gas; warm, ionized gas; and hot, ionized X-ray gas. We also include, in some instances, comparisons to clusters, normal groups, and field galaxies, which have
been more extensively observed, to give context to the observational studies of compact
galaxy groups. As the focus of this thesis concerns X-ray observations of galaxy groups,
we will cover the X-ray observations in greater depth relative to the other gas phases, and
it is important to review the other phases for reference in understanding the observed
1.3.1
Molecular Gas
Molecular gas forms in high density, cold environments and is largely associated with
dust grains. The surfaces of these grains are the formation sites of H2, which is the
most abundant molecule in the interstellar medium. Molecular gas is important in the
evolution of galaxies because it is within giant molecular clouds that stars are formed.
The dense, cold environment of these clouds is required for the gravitational collapse
of significant masses (105 106 M ) of star-forming material while also shielding the
proto-stellar environment from disruption by, e.g., high-energy cosmic rays (Shu et al.
1987).
In studying molecular gas, we wish to examine H2 due to its prevalence, however we
typically use carbon monoxide (primarily the isomer 12CO, hereafter abbreviated CO)
emission as a proxy for H2. This is because the absorption and emission lines of H2 are
not evident at the temperatures typical of cold (T ⇠ 10 K) interstellar gas5, i.e., star-forming regions, and the abundance of CO relative to H2 is quite high (Shu et al. 1987).
When studying these CO spectral features, we use the rotational transitions wherein the
quantum mechanical total angular momentumJ is changed (e.g.,J = 1 !0, abbreviated as 1-0 in parentheses). The relative abundance of CO in di↵erent rotational states is dictated by the number of collisions between molecules, and is therefore a function of the
density and temperature of the gas. For example, in giant molecular clouds (GMCs; the
coldest, densest phase of the ISM) the strongest emission typically seen is CO (1-0).
When observing in the radio/sub-millimeter portion of the electromagnetic spectrum,
single-dish data have the advantage of measuring the total flux within the beam down
to a limiting noise level and across a range of velocities, though the data lack spatial
information. Conversely, interferometric observations have the chief advantage describing
the spatial distribution of the cool gas; however, signal from di↵use gas that subtends a 5Warm H
large enough angle will be lost. The loss of spatially extended flux occurs because the
separate dishes can be thought of as one larger diameter dish to achieve high spatial
resolution, though the e↵ectively larger dish has holes in it that may miss some of the emission. Therefore, the complete study of cold gas requires both types of observations
(McLean 2008; Condon & Ransom 2010).
Verdes-Montenegro et al. (1998) used the single-dish National Radio Astronomy
Ob-servatory (NRAO) 12 m telescope to study the CO (1-0) emission in a sample of 80
galaxies located in HCGs. The beam size was such that only individual galaxies were
included in the measurements, rather than the group environment as a whole.
There-fore, the authors could parse the locations of the CO emission down to the level of the
individual group members. The authors found that 20% of spiral galaxies in their HCGs
were CO deficient compared to isolated field galaxies, however most galaxies were found
to be consistent with isolated, Virgo Cluster, and weakly interacting galaxy comparison
samples. Verdes-Montenegro et al. (1998) also found 5 out of 24 E/S0 galaxies in their
sample with strong CO emission indicative of H2 masses of (1.2 24.8)⇥108 M . The authors conjecture that the deficiency of CO in some CG spirals combined with the CO
enhancement of E/S0 galaxies is evidence for tidal stripping of molecular gas from
gas-rich galaxies. They point to the example of the HCG 90 galaxies B, C, and D, which
are a pair of evolved E/S0 galaxies interacting with a gas-rich irregular galaxy. The
system shows signs of strong tidal disruptions including a bright, di↵use, intragroup light component due to stripped stars (Longo et al. 1994; White et al. 2003). Huchtmeier &
Tammann (1992) studied the CO emission in this system and found that a large mass
(1.21⇥109 M ) of H
2 is associated with the elliptical galaxy 90B.
Yun et al. (1997) reported on the CO (1-0) emission observed in HCGs 31 and 92
by the Owens Valley Radio Observatory (OVRO) interferometer. Both of these present
interesting systems in which to study gas dynamics as they are currently undergoing
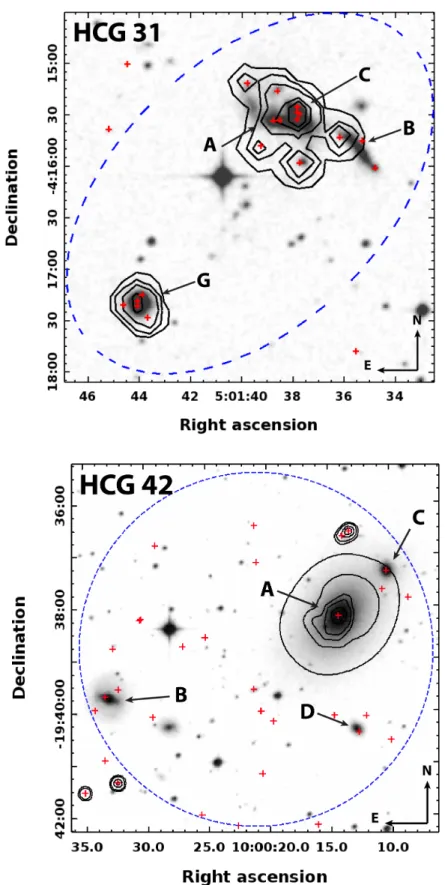
(a)
(b)
Figure 1.5: CO (1-0) contour maps of (a) HCG 31 superimposed on a Johnson V-band image with contours of –3, –2, +2, +3, and +4 times the rms noise and (b) HCG 92C superimposed on a Palomar 5 m telescope optical image with 15% linear contours. In both images, the crosses represent the locations of the galaxy nuclei, while the box in the lower left corner shows the size of the synthesized beam. In (a), the channel velocities of the maps are indicated in the top right, and the galaxies are labeled using the convention of Hickson (1982) (beginning with galaxy A in decreasing order of brightness). Note that HCG 31D is a discordant background galaxy. Adapted from Figures 3 and 4 of Yun et al. (1997).
faint, barely resolved CO emission in the overlap region between galaxies A and C (the
major merger in progress; see the right panel in Figure 1.5a) that is coincident with the
peak of the far-IR emission in the group indicating that this complex is associated with a
site of ongoing massive star formation. The emission detected is only 70% of the
single-dish measurement made with the NRAO 12 m telescope by Verdes-Montenegro et al.
(1998), and amounts to 2.9⇥108 M in the A+C merger with a potential additional mass of⇠108M detected in galaxy B. The authors note that the significant di↵erence between the single-dish and interferometric flux measurements may be due to CO emission that
is larger than the maximum angular size detectable by the OVRO (4500), therefore there
may be a large di↵use molecular gas structure present. Indeed, the H i envelope of HCG 31 is di↵use and large (Verdes-Montenegro et al. 2001), which supports the idea of extended molecular gas.
In HCG 92, Yun et al. (1997) found that all of the detected CO emission came from
galaxy C (62% of the single-dish flux; Verdes-Montenegro et al. 1998) with a mass of
8.6⇥108 M . The vast majority of the emission comes from a single, elongated structure (4.7 kpc long and.2 kpc wide)⇠8 kpc north of the galaxy C nucleus. A second, smaller complex lies 2 kpc south of the nucleus with 1.4⇥108 M of H
2. The authors note that there are smaller CO features detected, but not resolved, which individually have
masses (2 5)⇥107 M . Furthermore, no CO emission is found in the interacting pair in HCG 92, which is contrary to other examples of interacting galaxies (e.g. Combes
et al. 1994), though luminous molecular hydrogen is observed in the infrared in the shock
region (Appleton et al. 2006; Cluver et al. 2010).
The mass of the cold molecular gas reservoir in a system is clearly important because
it signifies the amount of material available for future star formation. In CG galaxies
in particular, we see that the strong tidal interactions associated with their environment
can transport this cold gas to locations where it may otherwise not typically be found
gives insight into the e↵ect of multiple gravitational interactions on the redistribution of gas. Furthermore, as massive molecular complexes like the ones discussed in the cases of
HCGs 31 and 92 are the sites of future star formation, mapping the CO (and hence H2)
gas helps us to understand how the gas will be processed in forming the next generation
of stars.
1.3.2
H
i
Gas
To measure the amount of cool, atomic gas (Hi) in a system, we observe emission at the 21 cm line. The 21 cm line is a forbidden line (i.e., a relatively low probability transition
compared to allowed lines that violates the quantum mechanical selection rules governing
spectra) that occurs due to the change in alignment of the quantum mechanical spins
of the electron and proton in the hydrogen atom. The spins are initially parallel in a
higher energy configuration before the spin of one of the particles flips such that the pair
are anti-parallel. The di↵erence in energy between these two configurations corresponds to emission at 21 cm. As previously mentioned, the H i 21 cm line is forbidden, and the probability of such a spin flip occurring is quite low with an Einstein coefficient A21 = 2.876⇥10 15s 1(or one hydrogen atom emitting a 21 cm photon every⇠108years; e.g., Cox 2000). One might expect this transition to be quite rare, however the sheer
number of neutral hydrogen atoms in astrophysical environments makes it possible to
observe this e↵ect. Furthermore, increased density of Hileads to an increased probability in the production of 21 cm photons due to collisional excitation.
The first comprehensive study of cool, atomic hydrogen gas in HCGs was performed
by Verdes-Montenegro et al. (2001). The authors used single-dish data from the Arecibo
and Green Bank (GBT) radio telescopes, in addition to the 100 m E↵elsberg antenna, that encompassed 72 of the 96 true groups in the Hickson (1982) catalog. In addition,
(a) (b)
(c)
Figure 1.6: VLA Hi contours (blue) superimposed on optical images of (a)HCG 7 with arbitrary contours (image credit: Amanda Heiderman); (b) HCG 26 with contour levels of 12, 18, 25, 35, 50, 71, 90, and 100% of 0.3 Jy/beam (Price et al. 2000); and(c)HCG 92 with contour levels of (5⇥1019 cm 2) ⇥ 2n (Hibbard et al. 2001). HCG 7 is an example
of a group where the cool gas is mostly confined to the galaxies, while HCGs 26 and 92 have large amounts of intragroup H i.
field galaxies of similar morphology and scaled for luminosity using prescriptions from
Haynes & Giovanelli (1984), the HCG galaxies were deficient in Hi. In the most extreme cases, the authors found that HCG 30 was missing 97% of its cool, atomic hydrogen,
while the individual galaxies HCG 92B and 92D were missing 99% of the H i gas. Of all HCGs sampled excluding those with no spiral members (48 groups), the mean H i
deficiency6 is 0.62±0.09. The authors note that repeated gravitational encounters may
have funneled the cool gas to the galaxy centers enhancing the amount of H2, however
6The H i deficiency is defined in Verdes-Montenegro et al. (2001) as Def
examination of the CO emission (see Section 1.3.1) suggests that this is not the case.
Recently, Borthakur et al. (2010) presented updated results of a GBT H i survey of 22 HCGs. The authors found that their masses mostly agreed with those presented by
Verdes-Montenegro et al. (2001). Where the masses disagreed with previous estimates,
the authors attributed smaller H i masses to the large angular extent of the H i and the di↵erences in the beam size (10.08 and 9.01 for Verdes-Montenegro et al. 2001 and Borthakur et al. 2010, respectively) and larger Hi masses to the increased sensitivity in the new data. The new measurements revealed that HCGs are not as Hideficient as had been previously reported, however they are still not consistent with field galaxies. By
comparing their GBT single-dish measurements with the VLA interferometry, Borthakur
et al. (2010) also hypothesize that the missing flux in the VLA data (see discussion in
Section 1.3.1 concerning single-dish and interferometry observations) is likely in the form
of a faint, di↵use intragroup medium that is undetectable by the VLA in the configura-tions used in the study. Furthermore, the authors argue that tidally stripped cool gas
will not survive in the hot IGM for longer than approximately 400 Myr unless the size
of the H i cloud is 200 pc in radius. The presence of cool gas in the IGM therefore implies a temperature of T < 4⇥106 K.
Thus far, we have focussed on the abundance of H i gas in CGs, however the distri-bution is also important in a discussion of gas processing. Figure 1.6 shows VLA maps
of the 21 cm line emission in several HCGs. From the figure, we see that the groups
may be classified into two subcategories: (1) those with Himostly confined to the galax-ies; and (2) groups with large amounts of extragalactic H i gas (Konstantopoulos et al. 2011). In the context of galaxy evolution, gas processing, and evolution of the group
environment itself, the distribution of the Hi gas is important because, as we have seen in Sections 1.2.3 and 1.3.1, the stripping of cool gas from galaxy disks can quench current
star formation and inhibit any future star formation that may have otherwise occurred.
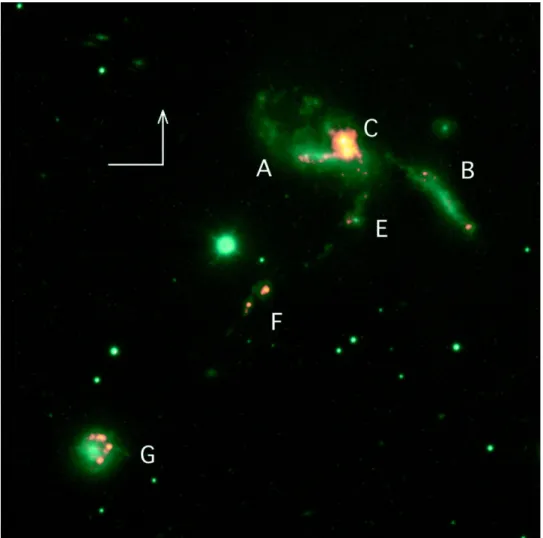
Figure 1.7: Image of HCG 31 that shows stellar continuum (green) and H↵ (orange) emission. The group members are labeled according to Hickson (1982), including the new tidal dwarf candidate galaxies E and F, while the vectors in the upper left indicate North (up) and East (left). Note that the bulk of star formation within the group is centered on the interface between galaxies A and C. Galaxy F is almost entirely dominated by ongoing star formation, while young stars in galaxy G are being created mostly along the NW edge of the galaxy nearest the A+C merger. Adapted from Figure 4 of Johnson & Conti (2000).
medium (see Section 1.3.4).
1.3.3
Warm Gas
The light from young, hot stars contains a substantial flux of ionizing photons, i.e., those
with wavelengths shorter than 912 ˚A (E > 13.6 eV), that can ionize hydrogen atoms
formation because young, pre-main sequence stars are enshrouded within the clouds of
gas and dust in which they formed. First, the radiation from the protostar sublimates
the dust grains and dissociates the surrounding molecular gas leading to the creation of
an atomic hydrogen (H i) cloud. Once the star enters the main sequence phase of its evolution (i.e., it begins fusing hydrogen into helium inside of its core), the ionization
rate of the gas due to high-energy photons surrounding the young star is balanced by the
recombination rate of free electrons and protons. The resulting cloud of ionized hydrogen
is referred to in theory as a Str¨omgren sphere, while in practice is termed an H iiregion. When the free electrons and protons recombine, the electrons do not immediately fall
down to the electronic ground state, but rather cascade down and emit a series of photons
in the process. The brightest emission line associated with this process is the H↵ line
(i.e, the transition that occurs when the electron falls from the n= 3 to n = 2 state) at
6562 ˚A in the optical part of the spectrum (Kennicutt 1998).
The light from a single O6 spectral-type star can ionize the surrounding hydrogen
out to a radius of several parsecs, but these luminous, young stars are not found in such
isolation. Rather, stars form in open clusters, and the dynamical timescale for cluster
dissociation (t ⇠107 109 yr; e.g., Boutloukos & Lamers 2003) is longer than the main sequence lifetimes of O- and B-type stars (t ⇠ 106 108 yr), that have sufficiently hot temperatures to produce a significant flux of ionizing ultraviolet photons. Therefore, we
expect that groups of O and B stars (OB associations) ionize the gas around young star
clusters. Because the main sequence lifetimes of these stars are short, H↵ emission traces
current star formation7. The H↵ flux due to star formation can be converted to a star
formation rate using standard relations (Kennicutt 1998, and references therein), though
Ly↵ is also emitted.
As yet, there has been no comprehensive examination of H↵emission in a large sample
of CGs; however, there have been several studies of individual CGs. Iglesias-Paramo &
Vilchez (1997) and Johnson & Conti (2000) studied on-going star formation in HCG 31,
which we have previously discussed as a group that is currently undergoing strong tidal
interactions and a major merger (see Section 1.3.1). Figure 1.7 shows the H↵and stellar
continuum image of the group. The authors of both studies found that the star formation
in HCG 31 appears to have begun simultaneously throughout the group, with Johnson &
Conti (2000) estimating that it began ⇠5 Myr ago. Interestingly, a shock would require 800 Myr to propagate through the group, therefore the authors rule this out as the
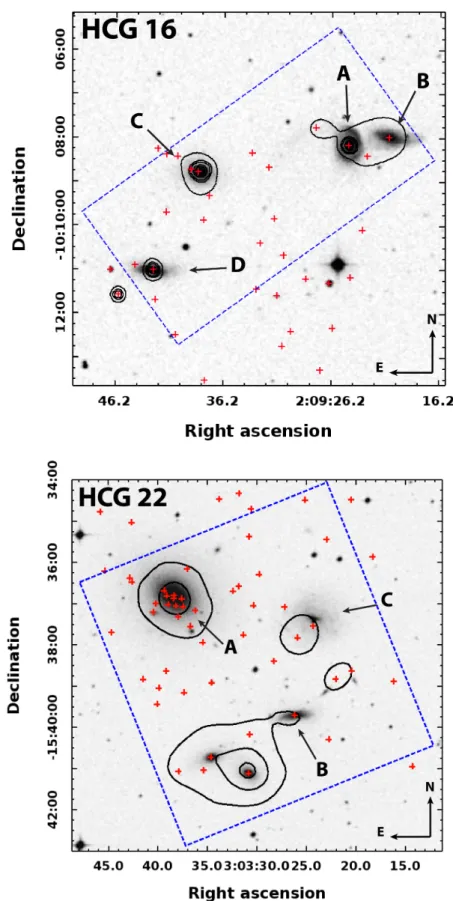
mechanism that started the star formation episode that currently su↵uses the group. Werk et al. (2010) present H↵ observations of HCG 16 from the National Optical
Astronomy Observatory (NOAO) Survey for Ionization in Neutral Gas Galaxies (SINGG;
Meurer et al. 2006) as part of a study in the outlying H ii regions of H i-rich galaxies. The authors found two extragalactic, spatially unresolved emission-line “dots” in the
system, one near a tidal tail to the NW of HCG 16A, and the other not located near
any galaxy associated with the group8, while a third source lied much farther south of
the group center. All three sources are within the large Hi envelope reported by Verdes-Montenegro et al. (2001). The authors suggest that, due to the large distance to HCG 16
(⇠54 Mpc), these sources are likely not single star clusters, but massive complexes or emerging dwarf galaxies.
While clearly not a large-scale mechanism for gas processing except in heavily
star-forming environments, ionization of cool gas by star formation to form H ii regions is an important phase change. The gas quickly changes from cold and molecular to atomic
and neutral, and finally to warm and ionized over relatively short timescales. In some
CGs, strong tidal interactions can induce star formation, as can be seen in the example
of HCG 31, and may quickly deplete these systems of their H2 gas.
1.3.4
Hot Gas
The first systems of galaxies to be extensively studied in X-rays were clusters due to their
bright X-ray luminosities and large angular extents. Early X-ray cluster observations
raised the question: how much mass is tied up in the hot, ionized gas? Futhermore, how
does the hot IGM originate and at what stage in the evolution of both the environment
and the galaxies does it form? Because groups represent the locations of most galaxies in
the Local Universe (e.g., Tully 1987; Small et al. 1999; Karachentsev 2005), and infalling
groups at higher redshifts are thought to be the origin of clusters in the current epoch
(e.g., Gonzalez et al. 2005; Kautsch et al. 2008; Tran et al. 2008), questions concerning
clusters were extended to low-mass groups as well. Due to the previously mentioned
increased probability of tidal encounters in CGs, wherein large quantities of gas may
be liberated from the galaxies and deposited into the IGM, these systems present ideal
environments in which to study the buildup of a hot, X-ray IGM through the processing
of cooler gas.
X-ray charge-coupled devices (CCDs; e.g., ROSAT Position Sensitive Proportional
Counter [PSPC],Chandra Advanced CCD Imaging Spectrometer [ACIS], XMM-Newton
European Imaging Photon Camera [EPIC]) function as imaging spectrometers9, i.e., they
record the position, time of impact, and energy of each incoming photon, and can do so
over relatively large fields of view compared to optical/infrared integral field
spectrom-eters (300 diameter in the case of EPIC). The energy of each incoming photon is known
because, unlike in optical CCDs, the incoming photon has enough energy to remove
mul-tiple electrons from the silicon layer in the CCD by means of the photoelectric e↵ect. Because the CCD records photon events by counting the electrons removed from the
silicon layer, two photons of relatively low energy can easily be mistaken for a single
(a) (b)
Figure 1.8: The X-ray scaling relations(a)LX and(b)LX T for hot, bremsstrahlung
continuum dominated gas in galaxy groups and clusters. The group data (filled black circles) come from Helsdon & Ponman (2000) and Xue & Wu (2000), while the clusters (filled black triangles) are taken from Wu et al. (1999). The solid line indicates the best fit to the cluster data from (Wu et al. 1999) (LX /T2.72±0.05 / 5.24±0.29, both of which
are slightly steeper than the expected values of LX / T2 / 4). Note that the lower
temperature and lower velocity dispersion groups mostly agree with theLX relation,
though with large scatter about the fit, while they systematically lie below the LX T
scaling law. This may indicate that energy from galaxy winds is responsible for heating the gas in groups (Ponman et al. 1996). Adapted from Figures 5 and 6 of Mulchaey (2000).
CCDs are quickly read out numerous times in a given observation (e.g., the Chandra
ACIS CCDs are nominally read out every 3.2 s10).
As discussed in Section 1.2.2, the main cooling mechanism at the high X-ray
tem-peratures of galaxy clusters is bremsstrahlung radiation, with line-cooling of heavy ions
(e.g., iron) playing a more dominant role at cooler temperatures observed in galaxy
groups. In studying di↵use X-ray emission, it is therefore common to fit the spectra with optically thin thermal plasma models (e.g., Kaastra & Liedahl 1995; Raymond & Smith
1977) that incorporate a bremsstrahlung continuum and line emission based on known
relative abundances (e.g., Anders & Grevesse 1989; Wilms et al. 2000; Lodders 2003).
Furthermore, studies use knowledge of the H i column density along the line of sight to