Electronic Thesis and Dissertation Repository
8-12-2019 10:00 AM
The Role of Auditory Feedback for Speech Intensity Regulation in
The Role of Auditory Feedback for Speech Intensity Regulation in
Parkinson’s Disease
Parkinson’s Disease
Dona Abeyesekera
The University of Western Ontario
Supervisor Adams, Scott G.
The University of Western Ontario
Graduate Program in Health and Rehabilitation Sciences
A thesis submitted in partial fulfillment of the requirements for the degree in Doctor of Philosophy
© Dona Abeyesekera 2019
Follow this and additional works at: https://ir.lib.uwo.ca/etd Part of the Speech Pathology and Audiology Commons
Recommended Citation Recommended Citation
Abeyesekera, Dona, "The Role of Auditory Feedback for Speech Intensity Regulation in Parkinson’s Disease" (2019). Electronic Thesis and Dissertation Repository. 6405.
https://ir.lib.uwo.ca/etd/6405
This Dissertation/Thesis is brought to you for free and open access by Scholarship@Western. It has been accepted for inclusion in Electronic Thesis and Dissertation Repository by an authorized administrator of
Hypophonia (low speech intensity) has been found to be the most common speech
symptom experienced by individuals with Parkinson’s disease (PD). Previous research
suggests that, in the PD population, there may be abnormal integration of sensory
information for motor production of speech intensity. In the current study, auditory
feedback was systematically manipulated during sensorimotor conditions that are known
to modulate speech intensity in everyday contexts. Twenty-six individuals with PD and
twenty-four neurologically healthy controls were asked to complete the following tasks:
converse with the experimenter with varying distances between the participant and
listener (near and far distances), vowel prolongation, read sentences at a comfortable
loudness, complete a magnitude production task (reading 2 times louder, 4 times louder,
maximum loudness), and complete an imitation task (50dB, 60dB, 70dB, 80dB), while
hearing their own speech intensity randomly altered. Altered intensity feedback
conditions included 5, 10 and 15dB reductions and increases in the feedback intensity.
Participants were also asked to read sentences with and without an instruction to attempt
to ignore the auditory feedback. Speech tasks were completed in no noise, background
noise, and a complete masking noise condition. Outcome measures included speech
intensity (dB) and loudness perception ratings obtained using a visual analogue scale.
Overall results indicate that individuals with PD display a reduced response to the altered
intensity feedback in all speech tasks, suggestive of abnormal of processing of auditory
feedback for speech intensity regulation. Specific deficits related to the perception of
ii
discussed as they relate to understanding specific deficits of auditory processing for
speech impairments in PD.
Keywords: Parkinson’s disease, movement disorders, sensorimotor integration, auditory
feedback, altered auditory feedback, auditory masking noise, speech intensity, loudness
iii
Summary for Lay Audience
Approximately 80% of individuals with Parkinson’s disease (PD) experience low
speech intensity. Previous researchers have shown this speech problem has a negative
impact on overall quality of life. The cause of this speech problem is unclear and this
prevents appropriate therapy development. Producing speech intensity that is appropriate
when communicating with others is a complex process, which involves regulating
self-produced speech intensity, monitoring ambient or background noise in the surroundings,
and maintaining speech loudness throughout a conversation. It is possible that the low
speech intensity produced by individuals with PD is caused by a problem related to how
they perceive the loudness of their own speech. To examine this potential cause, the
current study systematically manipulated how individuals hear their own speech by
altering auditory feedback. Testing involved making an individual’s speech sound louder
than was actually being produced and sometimes quieter than was actually being
produced. Previous research suggests that healthy speakers compensate for this type of
manipulation by producing speech in the opposite direction. For example, when an
individual’s speech is manipulated to sound louder than is actually being produced, the
speaker typically adjusts their speech to be quieter. This testing was conducted while
individuals were being asked to complete a variety of speech tasks typically encountered
in daily life, such as in conversation and while speaking in background noise. Results
from twenty-six individuals with PD and twenty-four neurologically healthy participants
found that individuals with PD made significantly smaller adjustments in their speech
intensity during altered auditory feedback conditions compared to the non-neurologically
iv
perception of the sound of their own speech and this abnormality may be related to the
cause of their low speech intensity. Findings from this study are anticipated to impact
how clinicians treat the speech problems in PD and may lead to the development of new
v
Acknowledgements
Dr. Scott Adams, for the incredible impact you have had on this thesis and my life. You
provided the perfect combination of support and independence, encouragement and
realism, energy and calm. Your expertise and insight have, and will continue to be,
inspirational. Your dedication while mentoring me is only a small testament to the
immense care, consideration, and kindness you show to all those around you.
Dr. Allyson Page, for being a valuable source of knowledge and guidance throughout my
PhD process.
Dr. Mandar Jog, thank you for being an inspiration of generosity, knowledge, and hard
work.
Dr. Julie Theurer, for your mentorship and friendship in navigating career and life.
Dr. Andrew Parrent and Dr. Quincy Almeida, for taking the time out of your busy
schedules to contribute your expertise and review this thesis as well as participate in my
PhD examination.
The Movement Disorders Laboratory at London Health Sciences Center, for your
invaluable collaborations.
Parkinson Canada, for your funding support and admirable contribution to the lives of
those with Parkinson’s disease.
The faculty and staff of Communication Sciences and Disorders and Health and
Rehabilitation Sciences, for the immeasurable support and learning experiences. Thank
you for being my second family and for helping to shape my clinical and research
perspective.
Cynthia Mancinelli, Thea Knowles, and Daryn Cushnie-Sparrow, the best lab mates.
Sharing information and resources, sharing moods, and sharing meals. You have all
vi
Thathi, Ammi, Aiya, Sangeetha, Adrian, Kieran, and Rylan, for the patience and
understanding you've showed through the many years I've spent far from home. For the
support, guidance, and encouragement through every step and misstep. Thank you for
helping me stay focused, for providing a source of distraction, and for knowing when
each was needed.
Aunty, Praveen, Michelle, and Simon, for your positivity, laughter, and meal support!
My dear friends, Julia, Suba, and Maria. Your enthusiastic support has pushed me
through my most difficult moments and raised me higher than I thought possible.
Gehan, my partner on so many of life's journeys. We've laughed through misery, we've
cried through joy. Walked hand in hand through a mirrored process. Yes, you not only
inspired my journey (there, I said it) but you pushed me the entire way. Thank you.
Grandpy, for being a constant source of writing inspiration.
My Nana, my source of calm and determination. My drive to contribute to the greater
society. Always.
To all individuals and families of those living with Parkinson’s disease, for the trust and
faith you put in research, coupled with your enthusiastic participation. This thesis is in
dedication to those who contributed their time to participate in this study. Your hope and
trust laid the foundation for this thesis and motivated it to completion. I hope to have
vii
Table of Contents
Abstract ... i
Summary for Lay Audience ... iii
Acknowledgements ... v
List of Tables ... xiii
List of Figures ... xviii
List of Appendices ... xxii
List of Abbreviations ... xxiii
Chapter 1: Introduction ... 1
1.1 Motor Deficit vs. Sensory/Somatosensory Deficit in PD ... 2
1.2 Sensorimotor Integration Deficit in PD ... 3
1.3 Speech in PD ... 5
1.4 Auditory Feedback for Speech Intensity Regulation in PD... 7
1.4.1 Speech Tasks ... 9
1.4.2 Interlocutor Distance ... 11
1.4.3 Background Noise and Lombard Effect ... 12
1.4.4 Magnitude Production Task ... 14
1.4.5 Imitation Tasks ... 15
1.4.6 Loudness Perception ... 16
1.5 Altered Auditory Feedback and Speech Intensity Regulation in PD ... 18
1.5.1 Altered Intensity Feedback (AIF) ... 19
1.5.2 Complete Masking of Auditory Feedback ... 21
viii
1.6 Auditory Feedback for Speech Intensity Regulation in PD: Theoretical Models .... 23
1.7 Neural Pathways for Auditory Feedback and Speech Intensity Regulation... 25
1.8 Rationale for Proposed Study... 29
1.9 Objectives ... 32
Chapter 2: Methods ... 35
2.1 Participants ... 35
2.2 Apparatus ... 37
2.3 Procedures ... 38
2.3.1 Altered Intensity Feedback (AIF) ... 40
2.3.2 Speech Tasks ... 40
2.3.3 Background Noise ... 41
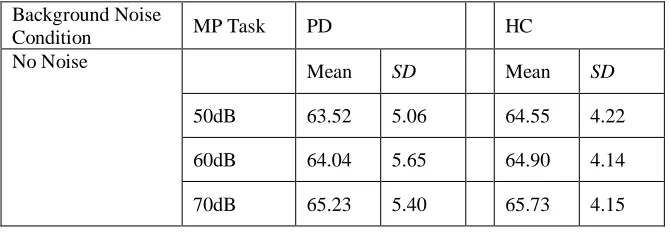
2.3.4 Magnitude Production Task ... 41
2.3.5 Imitation Task ... 41
2.3.6 Complete Masking Noise ... 42
2.3.7 Instruction to Ignore Auditory Feedback Task ... 42
2.3.8 Loudness Perception ... 42
2.4 Statistical Analysis ... 43
2.4.1 Sample Size Determination and Power Calculation ... 43
2.4.2 Statistical Analysis for Altered Intensity Feedback ... 44
2.4.3 Statistical Analysis for 65dB Background Noise ... 46
2.4.4 Statistical Analysis for Complete Masking Noise ... 47
2.4.5 Statistical Analysis for Self-Loudness Perception Ratings ... 48
Chapter 3: Results... 50
3.1 Altered Intensity Feedback (AIF) ... 50
ix
3.1.2 AIF slope analysis of PD and HC groups ... 55
3.2 Speech Tasks ... 56
3.2.1 Effect of speech tasks on speech intensity and the response to AIF in PD and HC
groups (Objective 2) ... 56
3.2.2 AIF slope analysis of speech tasks ... 62
3.3 Background Noise ... 65
3.3.1 The effects of background noise conditions on speech intensity and the response to
AIF in PD and HC groups (Objective 3) ... 65
3.3.2 AIF slope analysis of noise conditions ... 69
3.4 Magnitude Production (MP) Task ... 72
3.4.1 Effect of MP task on speech intensity and the response to AIF in PD and HC groups
(Objective 4) ... 72
3.4.2 The effect of background noise on the response to the MP task in PD and HC groups
(Objective 5) ... 76
3.5 Imitation Task (Objective 6-7) ... 79
3.5.1 Effect of imitation task on speech intensity and the response to AIF in PD and HC
groups (Objective 6) ... 79
3.5.2 The effect of background noise on the response to the imitation task in PD and HC
groups (Objective 7) ... 82
3.6 Complete Masking Noise (Objective 8-10) ... 84
3.6.1 Effect of complete masking noise and speech tasks on speech intensity in PD and HC
groups (Objective 8) ... 84
3.6.2 Effect of complete masking noise and MP task conditions on speech intensity in PD
and HC groups (Objective 9) ... 90
3.6.3 Effect of complete masking noise on speech intensity and performance on the intensity
x
3.7 Instruction to Ignore Auditory Feedback (Objective 11-12) ... 96
3.7.1 Effect of instructions to ignore auditory feedback on speech intensity and the response to AIF in PD and HC groups (Objective 11) ... 96
3.7.2 The effect of the instruction conditions on the response to background noise conditions in PD and HC groups (Objective 12) ... 98
3.8 Self-Loudness Perception (Objective 13-17) ... 99
3.8.1 Self-loudness perception ratings of speech intensity in the context of the MP Task and the response to AIF in PD and HC groups (Objective 13) ... 99
3.8.2 The effect of background noise on self-loudness perception ratings in the MP task by PD and HC groups (Objective 14)... 106
3.8.3 Self-loudness perception ratings of speech intensity in the context of the instructions to ignore auditory feedback and the response to AIF in PD and HC groups (Objective 15) .. 108
3.8.4 The effect of background noise on self-loudness perception ratings in the instruction to ignore auditory feedback conditions by PD and HC groups (Objective 16) ... 109
3.8.5 Self-loudness perception ratings of speech intensity in the context of complete masking noise in the MP task (Objective 17) ... 109
Chapter 4: Discussion ... 113
4.1 Altered Intensity Feedback (AIF) ... 115
4.1.1 Effect of AIF on Speech Intensity (Objective 1) ... 115
4.2 Speech Tasks ... 117
4.2.1 Effect of Different Speech Tasks on Speech Intensity and the Response to Altered Intensity Feedback (Objective 2)... 117
4.3 Background Noise ... 121
xi
4.4 Magnitude Production (MP) Task (Objective 4-5)... 123
4.4.1 Effect of MP Tasks on Speech Intensity and the Response to Altered Intensity
Feedback (Objective 4)... 123
4.4.2 Effect of Background Noise on the Response to the MP Task (Objective 5) ... 125
4.5 Imitation Task (Objective 6-7) ... 128
4.5.1 Effect of Imitation Task on Speech Intensity and the Response to Altered Intensity
Feedback (Objective 6)... 128
4.5.2 Effect of Background Noise on the Response to the Imitation Tasks (Objective 7) .. 129
4.6 Complete Masking Noise (Objective 8-10) ... 130
4.6.1 Effect of Complete Masking Noise on Speech Intensity during Different Speech Tasks
(Objective 8) ... 130
4.6.2 Effect of Complete Masking Noise on Speech Intensity during the Performance of the
MP Task (Objective 9) ... 131
4.6.3 Effect of Complete Masking Noise on Speech Intensity during the Performance of the
Imitation Task (Objective 10) ... 132
4.7 Instruction to Ignore Auditory Feedback (Objective 11-12) ... 133
4.7.1 Effect of Instruction to Ignore Auditory Feedback on Speech Intensity (Objective 11)
... 133
4.7.2 Effect of Background Noise on the Response to the Instruction to Ignore Auditory
Feedback (Objective 12)... 135
4.8 Self-loudness Perception (Objective 13-17) ... 135
4.8.1 Self-Loudness Perception Ratings of Speech Intensity in the Context of the MP Task
and the Response to AIF (Objective 13) ... 135
4.8.2 Effect of Background Noise on Self-Loudness Perception Ratings of Speech Intensity
xii
4.8.3 Self-Loudness Perception Ratings of Speech Intensity in the Context of the Instruction
to Ignore Auditory Feedback and the Response to AIF (Objective 15) ... 137
4.8.4 Effect of Background Noise on Self-Loudness Perception Ratings of Speech Intensity in the Context of the Instruction to Ignore Auditory Feedback (Objective 16) ... 138
4.8.5 Effect of Complete Masking Noise on Self-Loudness Perception Ratings of Speech Intensity in the Context of the MP Task (Objective 17) ... 139
4.9 Summary of Discussion ... 140
4.10 Study Limitations and Directions for Future Research ... 144
4.11 Theoretical and Clinical Implications ... 147
4.12 Conclusion ... 148
xiii
List of Tables
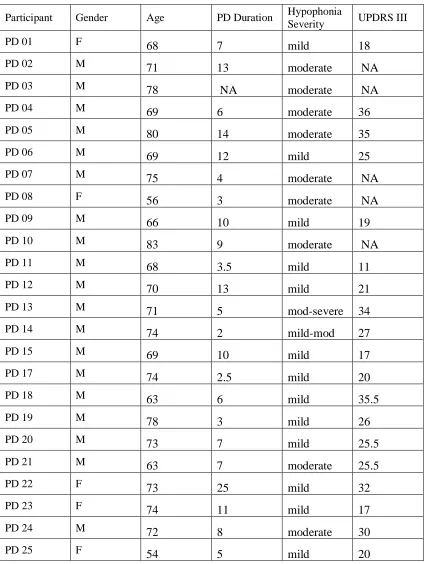
Table 1. PD patient demographic information. ... 36
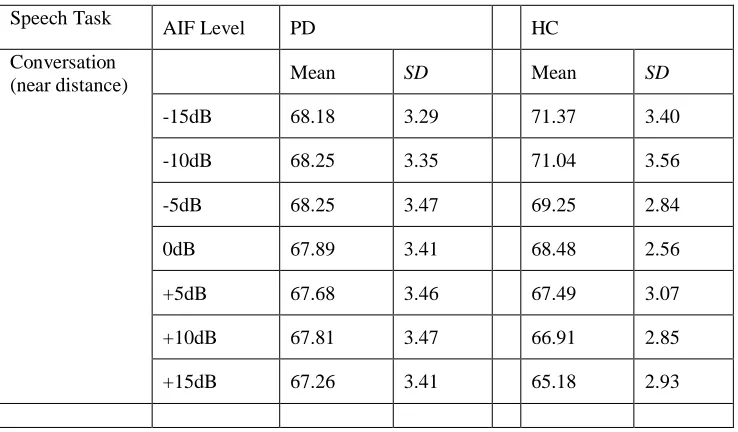
Table 2. Marginal means and standard deviations related to the 7 AIF conditions
obtained for the PD (n= 25) and HC (n=23) groups. ... 53
Table 3. Post-hoc results related to pairwise comparisons involving the marginal means
for the 7 AIF conditions (-15dB), (-10dB), (-5dB), (0dB), (+5dB), (+10dB), and (+15dB).
... 53
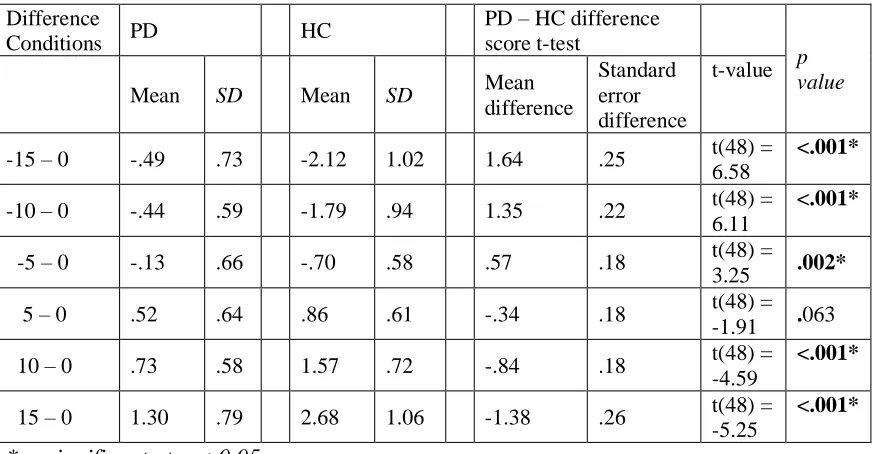
Table 4. Post-hoc comparisons related to difference scores (referenced to the 0 feedback
condition) for the 6 difference conditions (-15 – 0), (-10 – 0), (-5 – 0), (5 – 0), (10 – 0),
and (15- 0) obtained for the PD (n=26) and HC (n=24) groups. ... 54
Table 5. Post-hoc comparisons related to difference scores (referenced to the 0 feedback
condition) for the 3 difference conditions related to the negative versus positive feedback
conditions (-15 vs +15), (-10 vs +10), and (-5 vs +5) obtained for the PD (n=26) and HC
(n=24) groups. ... 55
Table 6. Descriptive statistics related to the slope values in the PD and HC groups. ... 56
Table 7. Descriptive statistics for the 4 speech tasks in the PD and HC groups.... 57
Table 8. Post-hoc results related to pairwise comparisons involving the marginal means
for the 4 speech tasks. ... 58
Table 9. Descriptive statistics for the 4 speech tasks and AIF levels in the PD and HC
xiv
Table 10. Post-hoc results related to pairwise comparisons involving the marginal slope
means for the 4 speech tasks. ... 63
Table 11. Descriptive statistics for the slope values of the 4 speech tasks in the PD and
HC groups. ... 64
Table 12. Interaction post-hocs involving a comparison of the two groups (PD vs. HC)
for each of the 6 pairwise difference scores related to the 4 speech tasks (convN – convF),
(conN – read), (convN – vowel), (convF – read), (convF – vowel), and (read – vowel). . 65
Table 13. Descriptive statistics of marginal means and standard deviations related to the
background noise conditions obtained for the PD (n= 25) and HC (n=23) groups. ... 66
Table 14. Descriptive statisticsof marginal means and standard deviations related to the
background noise conditions and AIF conditions obtained for the PD (n= 25) and HC
(n=23) groups. ... 69
Table 15. Interaction post-hocs involving a comparison of the two groups (PD vs. HC)
for each of the difference scores related to the two noise conditions (no noise – 65dB
noise). ... 71
Table 16. Post-hoc results related to pairwise comparisons involving the marginal means
for the 4 MP levels. ... 73
Table 17. Descriptive statistics of marginal means and standard deviations related to the
background noise conditions obtained for the PD (n= 26) and HC (n=24) groups in the
xv
Table 18. Descriptive statistics of marginal means and standard deviations related to the
background noise conditions and MP task obtained for the PD (n=26) and HC (n=24)
groups. ... 78
Table 19. Post-hoc results related to pairwise comparisons involving the marginal means
for the 4 imitation task levels. ... 80
Table 20. Descriptive statistics of marginal means and standard deviations related to the
background noise conditions obtained for the PD (n= 26) and HC (n=24) groups in the
context of the imitation task (50dB, 60dB, 70dB, 80dB). ... 83
Table 21. Descriptive statistics of marginal means and standard deviations related to the
background noise conditions and imitation task obtained for the PD (n=26) and HC
(n=24) groups. ... 83
Table 22. Descriptive statistics of marginal means and standard deviations related to the
masking noise conditions obtained for the PD (n= 26) and HC (n=23) groups. ... 85
Table 23. Post-hoc results related to pairwise comparisons involving the marginal means
for the 4 speech tasks (in no noise and complete masking noise). ... 86
Table 24. Descriptive statistics for the 4 speech tasks in the PD (n=26) and HC (n=23)
groups. ... 86
Table 25. Interaction post-hocs involving a comparison of the two groups (PD vs. HC)
for each of the 6 pairwise difference scores related to the 4 speech tasks (convN – convF),
(conN – read), (convN – vowel), (convF – read), (convF – vowel), and (read – vowel) in
xvi
Table 26. Descriptive statistics for the 4 speech tasks and masking noise conditions in the
PD and HC groups.... 90
Table 27. Descriptive statistics of marginal means and standard deviations related to the
masking noise conditions obtained for the PD (n= 26) and HC (n=24) groups in the MP
task. ... 91
Table 28. Post-hoc results related to pairwise comparisons involving the marginal means
for the 4 MP task conditions (in no noise and complete masking noise). ... 92
Table 29. Descriptive statistics for the 4 MP task conditions and masking noise
conditions in the PD (n=26) and HC (n=24) groups. ... 93
Table 30. Descriptive statistics of marginal means and standard deviations related to the
masking noise conditions obtained for the PD (n= 26) and HC (n=24) groups in the
imitation task. ... 95
Table 31. Post-hoc results related to pairwise comparisons involving the marginal means
for the 4 imitation task conditions (in no noise and complete masking noise). ... 95
Table 32. Descriptive statistics of marginal means and standard deviations related to the
background noise conditions obtained for the PD (n= 26) and HC (n=24) groups in the
instruction to ignore auditory feedback conditions (with and without instruction). ... 99
Table 33. Post-hoc results related to pairwise comparisons of loudness perception
ratings (mm on a 100mm visual analogue rating scale) involving the marginal means for
the 4 MP levels. ... 100
Table 34. Descriptive statistics for loudness perception ratings in the 4 MP task levels
xvii
Table 35. Descriptive statistics of loudness perception rating marginal means and
standard deviations related to the background noise conditions obtained for the PD (n=
26) and HC (n=24) groups in the context of the MP task (habitual loudness, 2x louder, 4x
louder, maximum loudness). ... 107
Table 36. Descriptive statistics of loudness perception rating marginal means and
standard deviations related to the complete masking noise conditions obtained for the PD
(n= 26) and HC (n=24) groups in the context of the MP task (habitual loudness, 2x
louder, 4x louder, maximum loudness). ... 111
Table 37. Post-hoc results related to pairwise comparisons of loudness perception
ratings involving the marginal means for the 4 MP levels in the context of the noise
xviii
List of Figures
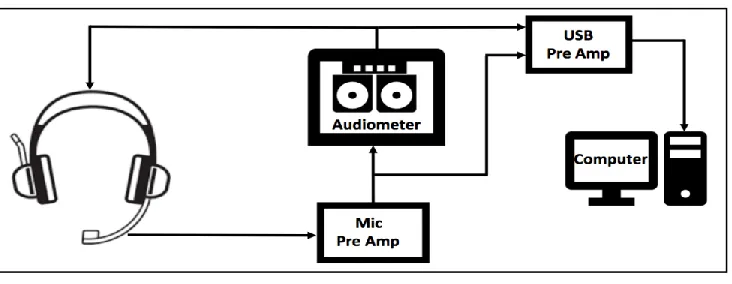
Figure 1. Schematic representation of the experimental setup. ... 38
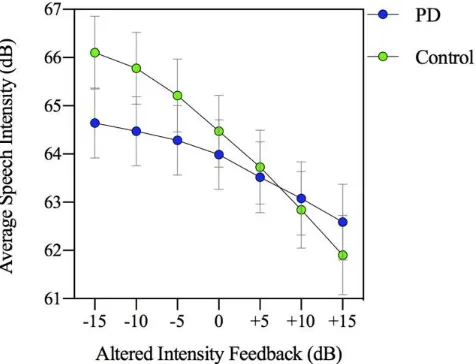
Figure 2. Marginal means for PD and HC groups and the 7 AIF conditions. ... 52
Figure 3. Difference values for PD and HC groups and 6 AIF conditions. ... 54
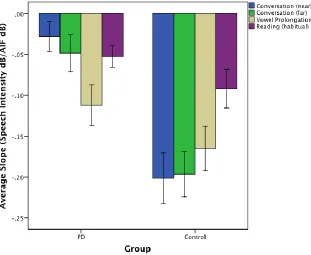
Figure 4. Average slope values in the PD and HC groups. ... 56
Figure 5. Marginal Means for the PD and HC groups across 7 AIF conditions in the conversation at a near distance speech task. ... 61
Figure 6. Marginal Means for the PD and HC groups across 7 AIF conditions in the conversation at a far distance speech task. ... 61
Figure 7. Marginal Means for the PD and HC groups across 7 AIF conditions in the vowel prolongation speech task. ... 62
Figure 8. Marginal Means for the PD and HC groups across 7 AIF conditions in the sentence reading (habitual speech intensity) speech task.... 62
Figure 9. Marginal slope mean for the 4 speech tasks by the PD and HC group. ... 64
Figure 10. Marginal Means for the PD and HC groups for the no noise condition across 7 AIF conditions. ... 68
Figure 11. Marginal Means for the PD and HC groups across 7 AIF conditions for the 65dB background noise condition. ... 68
xix
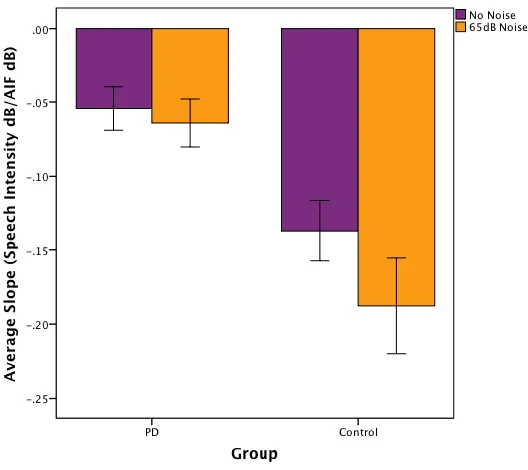
Figure 13. Marginal slope means for the 2 noise conditions in the PD and HC groups.
The dB/dB unit of the slope variable corresponds to the dB reduction in speech intensity
per dB increase in AIF. ... 71
Figure 14. Marginal means for PD and HC groups and the 4 MP task levels. ... 73
Figure 15. Marginal means for PD and HC groups and the 7 AIF conditions in the MP
task. ... 74
Figure 16. Marginal means for the PD and HC groups across 7 AIF conditions in the
reading at habitual loudness MP task. ... 75
Figure 17. Marginal means for the PD and HC groups across 7 AIF conditions in the
reading at 2x louder MP task.... 75
Figure 18. Marginal means for the PD and HC groups across 7 AIF conditions in the
reading at 4x louder MP task.... 76
Figure 19. Marginal means for the PD and HC groups across 7 AIF conditions in the
reading at maximum loudness MP task. ... 76
Figure 20. Marginal means for the PD and HC groups across 4 MP task conditions in no
noise and 65dB background noise. ... 79
Figure 21. Marginal means for PD and HC groups and the 4 imitation task levels. ... 81
Figure 22. Marginal means for PD and HC groups and the 7 AIF conditions in the
imitation task. ... 82
Figure 23. Marginal means for the 4 speech tasks by the PD and HC groups (no noise
xx
Figure 24. Marginal means for the PD and HC groups across 4 speech tasks in the no
noise condition. ... 89
Figure 25. Marginal means for the PD and HC groups across 4 speech tasks in the
100dB masking noise condition. ... 89
Figure 26. Marginal means for the PD and HC groups across 4 MP task conditions in the
no noise condition. ... 93
Figure 27. Marginal means for the PD and HC groups across 4 MP task conditions in the
100dB masking noise condition. ... 93
Figure 28. Marginal means for PD and HC groups and the 7 AIF conditions in the
reading with no instruction task. ... 97
Figure 29. Marginal means for PD and HC groups and the 7 AIF conditions in the
reading with an instruction to ignore auditory feedback task. ... 98
Figure 30. Marginal means for PD and HC groups and the 7 AIF conditions in the
instruction to ignore auditory feedback conditions (combined with and with no
instruction). ... 98
Figure 31. Loudness perception marginal means for PD and HC groups and the 4 MP
task levels. ... 101
Figure 32 (14). Marginal means for PD and HC groups and the 4 MP task levels. ... 101
Figure 33. Mean loudness perception ratings for PD and HC groups and the 3 AIF levels
xxi
Figure 34 (Modified Figure 15). Mean speech intensity for PD and HC groups and the 3
AIF levels in the MP task. ... 103
Figure 35. Loudness perception marginal means for the PD and HC groups across 3 AIF
conditions in the reading at habitual loudness MP task. ... 104
Figure 36. Loudness perception marginal means for the PD and HC groups across 3 AIF
conditions in the reading at 2x louder MP task. ... 104
Figure 37. Loudness perception marginal means for the PD and HC groups across 3 AIF
conditions in the reading at 4x louder MP task. ... 105
Figure 38. Loudness perception marginal means for the PD and HC groups across 3 AIF
conditions in the reading at maximum loudness MP task.... 105
Figure 39. Loudness perception marginal means for PD and HC groups and the 4 MP
xxii
List of Appendices
xxiii
List of Abbreviations
AIF Altered intensity feedback
BGN Background noise
ConvN Conversation at a near distance
ConvF Conversation at a far distance
dB Decibels
HC Healthy controls
MP Magnitude production
PD Parkinson’s disease
Read Reading task
SD Standard deviation
Chapter 1: Introduction
Parkinson’s disease (PD) is a neurodegenerative movement disorder (Duffy,
2013; Hobson, 2003). The percentage of individuals over the age of 50 years with PD is
4% or an estimated 4.1-4.6 million worldwide in 2005, and projection analysis yielding
an estimated 8.7-9.3 million by the year 2030 (Dorsey et al., 2007; Goetz & Pal, 2014). In
Canada, prevalence of PD is 0.2% of adults (over age 18 years) living in private
households or 55,000 people and 4.9% or 12,500 people living in long-term residential
care facilities (Statistics Canada, 2015).
PD is characterized by a progressive loss of dopaminergic neurons in the
substantia nigra pars compacta area of the brain (Brug, Singleton, Gasser, & Lewis,
2015). The dopaminergic cell loss in the substantia nigra pars compacta is associated with
decreased striatal dopamine concentrations, which results in disruption of the basal
ganglia-thalamocortical motor circuit. Specifically, abnormally high neural discharge
from the basal ganglia motor output nuclei, substantia nigra pars reticulate, and internal
segment of the globus pallidus are believed to cause hypokinesia or reduced force and
range of movement due to increased inhibition of motor cortical regions (Abbruzzese &
Berardelli, 2003). This disruption enables diagnosis of PD to be primarily based on
observable clinical signs. The major motor features of the disease include the symptoms
of rest tremor (3-5Hz frequency), rigidity (increased, sustained muscle tone), akinesia
(reduced number of spontaneous movements), bradykinesia (slowed movements),
hypokinesia (reduced range of movements), and postural instability. Other secondary
micrographia, shuffling gait, freezing of gait, festination, and dystonia. In addition,
non-motor symptoms of the disease include autonomic dysfunction, cognitive impairment,
sleep disorders, and sensory abnormalities (anosmia, ageusia, pain, paresthesias) (Duffy,
2013; Hobson, 2003; Jankovic, 2008).
Subtypes of PD have been identified with a classification based on age of onset
and motor symptoms (Ma, Chan, Gu, Li, & Feng, 2015). Age based subdivisions include
juvenile, young, and late onset groups, while motor subtypes include hypokinetic rigid,
tremor dominant, and postural instability-gait disorders (Ma et al., 2015). Although the
specific etiology of PD is unknown, several environmental risk factors have been
identified and some studies show that genetic factors may be contributing, particularly in
patients with young-onset PD (Olanow & Tatton, 1999). Autosomal dominant forms of
the disease have been identified since the late 1990’s, and today over a dozen genes
(including SNCA, PARK2, PINK1, and LRRK2) are implicated in familial PD and other
syndromes where Parkinsonism is a prominent symptom (Brug et al., 2015).
Treatments used to help control PD symptoms include drug therapy, behavioural
therapy, and surgery (deep brain stimulation, ablation) (Parkinson Society Canada, 2003).
The total cost for PD in Canada, including hospital care, drug therapy, and long-term
disability care, is around $558 million annually (Parkinson Society Canada, 2003).
1.1 Motor Deficit vs. Sensory/Somatosensory Deficit in PD
Many researchers believe that the degenerative process of PD is primarily based
evidence that non-motor symptoms including sensory or sensorimotor dysfunction may
be impacted as well (Abbruzzese & Berardelli, 2003; Patel, Jankovic, & Hallett, 2014;
Schneider, Diamond, & Markham, 1986; Tatton, Eastman, Bedingham, Verrier, & Bruce,
1984). The broad range of motor and non-motor symptoms can be attributed to striatal
dopamine deficiency along with central and peripheral dopaminergic and non-
dopaminergic pathways (Patel et al., 2014). Studies by Braak, Ghebremedhin, Rüb,
Bratzke, and Del Tredici (2004) have found neuropathological alterations outside of the
substantia nigra region which correlate with non-motor symptoms such as olfactory
dysfunction as well as autonomic and sleep disturbances.
Researchers have examined sensory and somatosensory deficits in PD as a
component of a largely motor-based disease. Visual-spatial and visual postural deficits
have been documented in PD (Boller et al., 1984; Bronstein, Hood, & Gresty, 1990).
Deficiencies in somatosensory tactile and proprioceptive mechanisms primarily occur
early in the disease progression (Conte, Khan, Defazio, Rothwell, & Berardelli, 2013;
Govil et al., 2013). It may be assumed that sensory abnormalities are mediated by the
basal ganglia circuitry. Some authors purport that sensory deficiencies underlie several of
the motor symptoms (Govil et al., 2013). In addition, it is important to note that the basal
ganglia are considered responsible for gating sensory input for motor control (Kaji, 2001;
Kaji, Urushihara, Murase, Shimazu, & Goto, 2005).
1.2 Sensorimotor Integration Deficit in PD
Voluntary movements depend heavily on peripheral sensory feedback. PD-related
of mechanocreceptor sensory inputs for movement production (Tatton et al., 1984).
Therefore, it may be possible to describe PD as involving a sensorimotor integration
deficit rather than a motor deficit with some sensory abnormalities. Sensorimotor
integration refers to a process by which peripheral sensory pathways convey information
to cortical motor pathways and this information is then integrated by the central nervous
system in order to complete motor program execution (Abbruzzese & Berardelli, 2003).
A deficit in sensorimotor integration involves abnormal processing of the sensory
information (afferent input or neural response to input) for motor execution.
Several studies have explored the sensorimotor integration deficit involved in PD
movement control (Almeida et al., 2005; Bronstein, Hood, & Gretsy, 1990; Klockgether
& Dichgans, 1994; Rinalduzzi et al., 2015). Methods of evaluating sensorimotor
integration processes include manipulating sensory feedback, such as visual feedback.
Individuals with PD have displayed overreliance on visual information during movement
towards a target and were more affected by absent visual feedback (walking in complete
darkness) than controls (Almeida et al., 2005). Klockgether and Dichgans (1994)
conducted a study on upper limb movements and found that when PD participants were
blocked from seeing their moving hand, movement accuracy (undershoot) and speed
were more severely impacted compared to controls. In addition, during postural stability
tasks, PD participants have shown overreliance on visual information causing instability
which control subjects were able to attenuate, indicating a potential sensorimotor
integration deficit (Bronstein et al., 1990; Rinalduzzi et al., 2015). A study by Teulings,
Contreras-Vidal, Stelmach, and Adler (2002) also found overreliance of visual feedback
that would update their original prediction using the manipulated visual feedback and
made corrections to their handwriting movements in the expected/opposite direction to
the perturbed error (Teulings et al., 2002).
1.3 Speech in PD
The speech characteristics of the PD population have been classified as
hypokinetic dysarthria (HKD) due to the hypokinetic symptoms of the speech system
(reduced force and amplitude of movement). Hypophonia or low speech intensity has
been found to be the most common speech symptom experienced by individuals with PD,
across age and disease duration (Adams & Dykstra, 2009; Darley, Aronson, & Brown,
1969; Duffy, 2013; Logemann et al., 1978; Wertheimer et al., 2014). The term
hypophonia has been in use since at least 1930, when Kennedy used it to describe the
“whispered or near-whispered” speech of certain individuals with mental illness (1930).
Many allied health professionals as well as researchers have used this term over the years,
however the definition of the term has varied. It has been used to describe a reduced
frequency of vocalizations, a reduced speech volume, and breathy phonation (Brin,
Blitzer, Fahn, & Lovelace, 1989; Langston, Forno, Rebert, & Irwin, 1984; Meissner,
Sapir, Kokmen, Stein, & Report, 1987). More recently it has been used to describe
overall reduced speech loudness (Duffy, 2013).
Despite differences in methods of measurement of intensity, researchers have
found a significant reduction in average speech intensity in participants with PD relative
to healthy control speakers (Adams et al., 2006; Adams et al., 2008; Adams, Winnell, &
Rosen et al., 2006). On average, individuals with PD have reduced average speech
intensity levels (2-4dB lower) compared to age-matched, healthy control speakers
(Adams, Haralabous, Dykstra, Abrams, & Jog, 2005; Clark, Adams, Dykstra, & Moodie,
2014; Fox & Ramig, 1997; Ho et al., 1999). Darley et al. (1969) described speech
loudness as a factor that impacts speech intelligibility. Speech intelligibility, when rated
as low by either a listener or the speaker, can have negative consequences for a number
of aspects of life. This could include overall quality of life, activity, and participation
(Dykstra, Hakel, & Adams, 2007). Reduced loudness and loudness variability
(monoloudness) have been implicated in reduced overall quality of life, withdrawal from
social interactions, and decreased participation (Miller, Noble, Jones, & Burn, 2006).
The relationship between the major motor symptoms of PD and speech symptoms
are unclear, suggesting that basal ganglia involvement in speech may be unique and more
complex. It has been argued that mechanisms of speech control are fundamentally
different than other motor movements, as a result of differences in neural control and
muscle fiber makeup (Kent, 2004). Consistent with this, Braak and colleagues (2004)
specified that striatal dopamine depletion likely occurs relatively later in disease
progression, whereas speech symptoms such as hypophonia tends to be one of the earliest
symptoms. This may be potentially related to vagal and glossopharyngeal nerve
involvement (non-dopaminergic neurotransmission) which is affected in early stages of
PD progression (Braak et al., 2004). The specific pathological mechanism causing speech
impairment in PD is unclear, however it is possible that sensory or sensorimotor
With regards to PD speech and the oral-motor system, there has been some
evidence for the implication of sensorimotor deficits on motor performance. A review by
Sapir (2014) concluded that PD related speech impairment is attributed to multiple
factors including sensory processing. A study on oral-lingual-facial sensory and motor
functions by Schneider, Diamond, and Markham (1986) found that individuals with PD
were more impaired in tests of sensory function and sensorimotor integration compared
to controls. Specifically, they found significant impairment in jaw proprioception, tactile
localization on the tongue, gums and teeth, as well as difficulty performing targeted head
movements on the basis of tactile sensory information despite having adequate motor
control of head movement (Schneider et al., 1986). In addition, Hammer and Barlow
(2010) found reduced vocal tract somatosensory feedback in PD, and Hegland, Troche,
and Brandimore (2019) found reduced perception of general airway somatosensation in
PD. These findings are important, as the vocal tract and respiratory system are integral
for speech production. Overall, PD speech has shown to be linked to multiple factors
including motor planning, initiation, as well as scaling, sensory processing, vigilance, and
even depression and cognitive-linguistic processing (Sapir, 2014).
1.4 Auditory Feedback for Speech Intensity Regulation in PD
Sensorimotor integration deficits for the regulation of speech intensity may
involve abnormalities in auditory perception during speaking tasks. The importance of
auditory processing for speech is evident during child development when acoustic input
heavily influences the speech patterns of pre-lingual children. Further evidence of the
that the low speech intelligibility of hearing-impaired speakers is a result of the of
auditory signal perception impairment. In addition, this is described in studies of
post-lingually deafened individuals who present with abnormalities in the loudness as well as
pitch and rate of speech (Waldstein, 1990).
Auditory-related dysfunction has been evaluated in PD and may be caused by loss
of dopaminergic neurons in the basal ganglia and subsequent projections to the inferior
colliculus, medial geniculate nucleus, and temporal cortex. Thus, in PD there may be
inefficient cortical control of the auditory system. In fact, auditory evoked potentials
(measured using EEG) have been demonstrated as abnormal in PD participants both “on”
and “off” medication suggestive of disrupted auditory processing in this population
(Lukhanina, Kapustina, Berezetskaya, & Karaban, 2009). Abnormal auditory perception
is further corroborated by Arnold, Gehrig, Gispert, Seifried, and Kell (2014) who
recruited a pre-symptomatic PD group who later went on to develop hypophonia. They
found decreased relative suppression of auditory cortex activity (while hearing one’s own
voice) compared to healthy controls during overt reading tasks (Arnold, et al., 2014). The
impact of increased activity in the auditory cortex during the reading task may translate to
abnormal perception of self-produced speech, however this hypothesis is speculative. In
addition, they found hypo-connectivity between the left dorsal premotor cortex and the
left auditory cortex, suggestive of a dysfunctional sensorimotor integration function in
PD (Arnold et al., 2014). A more detailed discussion of neural networks related to
auditory feedback is provided in Section 1.7.
Lower level auditory-perceptual processing deficits such as increased hearing
have been observed in PD populations, however only inconsistently (Lai, Liao, Lin, Lin,
& Sung, 2014; Murofushi, Yamane, & Osanai, 1992; Vitale et al., 2012; Yýlmaz et al.,
2009). The focus on higher level auditory processing of speech intensity information is
validated based of the observed perceptual deficits in this population.
Intensity regulation is impacted by a variety of external cues or conditions. In
typical conversational settings, the speaker must monitor the environment and their own
speech intensity levels in order to compensate for such factors as ambient or background
noise in their surroundings as well as how near or far their listener is situated. In addition,
the speaker must have a method of regulating their speech intensity while simultaneously
performing a separate task. In order to do these things, the speaker must be perceptive to
their surroundings, make the necessary alterations to their voice, and also have some sort
of sensorimotor monitoring process in place to maintain the adjustment. The varied
contexts that a speaker experiences necessarily means that processing of additional
factors such as distance, communicative intent, and cognitive load are all implicated in
the regulation of speech intensity in naturalistic contexts. In addition, abnormal
processing of auditory information during speech may involve deficits in loudness
perception.
1.4.1 Speech Tasks
Average speech intensity can be obtained across a vowel, sentence, and across a
breath group or utterance within speech (Adams et al., 2005; Huber & Darling, 2012;
Neel, 2009). The nature of the speech task has an influence on the regulation of speech
those that do not necessarily represent natural speaking intensity (e.g. vowel prolongation
compared to conversational tasks) (Rosen et al., 2005). Junqua, Finckle, and Field (1999)
found speech intensity increased more in background noise (Lombard effect) during
conversational speech than in a reading task. The effect of speech task on speech
intensity regulation is also exemplified by work conducted by Patel and colleagues
(2014). These researchers found healthy participants to regulate speech intensity (during
perturbed feedback) only in speaking contexts requiring a specific linguistic goal,
specifically relating to emphatic stress in a sentence. However, it is possible that
suprasegmental and segmental aspects of speech may be controlled by different
mechanisms for which auditory feedback plays different roles (Perkell et al., 2007).
Interestingly, PD participants have been shown to lack an automatic adjustment of
their speech intensity in conversational samples, unlike healthy controls (Ho et al.,1999).
Whereas healthy controls show a tendency to increase the intensity when speaking in
conversational tasks, particularly those with added cognitive requirements (speaking
about personal experiences), PD participants do not make a similar adjustment (Ho et al.,
1999; Winkworth, Davis, Ellis, & Adams 1994). In fact, Moon (2005) found a greater
reduction in speech intensity during conversational tasks compared to reading. The
content of the message may play a role in intensity adjustments. This includes
communicative intent and emotional content; high emotional content may produce wide
ranges of speech loudness, which may not exist in emotionally neutral conversation. In
addition, it has been hypothesized that the compounded attentional demands associated
with a conversation task may have an impact on speech intensity regulation (Adams &
The observed deficits in speech tasks and speech intensity modulating conditions
may be related to difficulties adapting to the social environment. In addition, because PD
is associated with dopamine depletion and this is an important neurotransmitter which
signals reward expectation in the striatum (Balleine, Delgado, & Hikosaka, 2007; Daniel
& Pollmann, 2014), it will be important to examine differences between speaking tasks.
Speech tasks may range in terms of the social rewards attributable to each. Therefore, it
may be critical to account for this when evaluating speech intensity regulation in PD
populations.
1.4.2 Interlocutor Distance
The talker to listener distance, or interlocutor distance can cause the healthy
speaker to increase their speech intensity with increasing distance (Cheyne, Kalgaonkar,
Clements, & Zurek, 2009; Traunmüller & Eriksson, 2000). We can examine the
interlocutor distance slope of the function by comparing changes in interlocutor distances
to speech intensity. Researchers have found that PD participants are able to regulate their
speech intensity at a similar rate to healthy controls, however PD speech intensity is at an
overall reduced level at each distance compared to control speakers (Adams, Winnell, &
Jog, 2010; Ho et al., 1999; McCaig, Adams, Dykstra, & Jog, 2015).
The difficulty with modulation of speech intensity for varying interlocutor
distances in PD may be related to a difficulty with processing visual distance information.
Individuals with PD have displayed overreliance on visual information during distance
judgement tasks and underestimations of distance compared to healthy controls (Almeida
deficits in speech intensity modulating tasks may be related to difficulties adapting to the
social environment. Theory of mind (ToM) is a concept related to social cognitive
domains. It involves the ability to attribute mental states including beliefs and intentions
to others in order to assist with predictions of their mental state and behaviour (Bora,
Walterfang, & Velakoulis, 2015). Individuals with PD were found to have significantly
impaired ToM compared to controls and this was consistent across a variety of ToM tasks
as well as among those in earlier stages of the disease (although significantly less severe
compared to later stages) (Bora et al., 2015). However, it may be argued that if distance
judgements or ToM were abnormal in the PD population, then the scaling of intensity
across distances would be more abnormal. However, the observed deficit in previous
research is suggestive of abnormal “gain-setting”. The relative influence of gain-setting
and visual distance judgements requires further examination.
1.4.3 Background Noise and Lombard Effect
The Lombard effect, first described by Lombard in 1911, is the phenomenon in
which a person increases their speech intensity when speaking in a noisy environment.
This observation remains consistent across reading and conversational tasks, with several
studies providing evidence of healthy speakers increasing their intensity with increasing
levels of background noise as well as decreasing their speech intensity once the noise is
stopped (Adams et al., 2006; Ho et al., 1999; Lane & Tranel, 1971; Pick, Siegel, Fox,
Garber, & Kearney, 1989). Garnier, Henrich and Dubois (2010) also found this effect to
be more robust when background noise was played through headphones compared to
when played through loudspeakers, however the ecological validity of this should be
Similar to findings from increasing interlocutor distance conditions, individuals
with PD-related hypophonia increase their speech intensity as the levels of background
noise increase, however their speech is consistently lower than controls across all
conditions (Adams & Lang, 1991; Adams et al., 2005). These studies utilized pink and
white noise as well as multi-talker background noise. It is interesting to note that these
studies found an “overall gain reduction” for speech intensity in PD (Adams et al., 2006;
Ho et al., 1999; Iulianella, Adams & Gow, 2008). This is because the PD speakers spoke
at a consistently lower intensity despite a fairly typical slope of the regression function
(increasing background noise levels produced sequentially increased intensity responses).
Adams et al. (2006; 2008) found a gradually decreasing signal-to-noise ratio with
increasing background noise, which is suggestive of a perceptual deficit related to the
ability to recognize and regulate speech intensity at a level that is appropriate for the
listener under these noise conditions.
Type of background noise presented does not appear to have an impact on this
Lombard effect in PD, with various intensities of pink noise and music presented in a
study by Adams and colleagues (2006). However multi-talker background noise did elicit
significantly higher intensity in both PD and controls (Adams et al., 2006). This is in
contrast to minimal differences between noise types found by Ho and colleagues (1999).
The intensity level of the background noise may also play an important role in the
Lombard effect displayed by PD participants. Lane and Tranel (1971) describe the
influence of floor and ceiling effects, whereby speech intensity cannot continue to
increase despite high levels of background noise and conversely speakers have a lower
reduced range of speech intensity production (Clark et al., 2014; De Keyser et al., 2016).
Background noise within a range of 50-90dB SPL has been used to depict the Lombard
effect in PD and is also comparable to everyday communication contexts (Adams & Lang,
1991; Adams et al., 2005).
1.4.4 Magnitude Production Task
A frequently used method of evaluating autophonic judgement (self-perceived
loudness) is through a magnitude production task (MPT). Using this method, the
participant initially produces a spoken-stimulus and this production is assigned a value
that serves as an anchor or modulus for all subsequent productions. The participant is
then asked to produce utterances that are ratios of the initial, anchor production (i.e. two
times louder, four times quieter, etc.). This approach is systematic in its method and is
based on previous psychometric research. The actual intensity of these autophonic
productions is compared to the intended or target intensity values, using regression
procedures, and an autophonic loudness function can be obtained (Lane, Catania, &
Stevens, 1961).
The MPT requires a scaling of speech intensity and therefore deliberate
monitoring of speech production intensity levels via sensory mechanisms. In other words,
the MPT involves the relationship between a speaker’s perception of their speech
loudness and the actual speech intensity produced. Healthy controls are able to produce
an autophonic function with a coefficient of 1.17 when obtained by this method (Lane et
al., 1961). This means that healthy speakers are able to estimate increases in their own
Previous work by Dromey and Adams (2000) did not find a significant difference
between mildly hypophonic PD participants and control subjects when asked to complete
this task. It is important to note that these researchers employed a vowel production task
(quasi-speech task). In contrast, Clark and colleagues (2014) found that those in the PD
group displayed a flatter slope of the loudness function compared to controls when
producing a sentence (moderately hypophonic PD participants). This suggests that a
scaling ability is present in the PD population, however it also depicts a more restricted
range in the perception of loudness.
Using this method there are potential confounds such as the executive functioning
ability necessary to remember the previous loudness and working memory to retain each
loudness-value match. Therefore, cognitive strength and weakness need to be considered
when evaluating the PD population.
1.4.5 Imitation Tasks
Imitation tasks of speech intensity stimuli require processing of an auditory
stimulus as well as planning and executing a corresponding speech intensity level. This
task allows for a controlled stimulus target, therefore enabling the more precise study of
sensorimotor integration for speech intensity. PD participants have been found to produce
lower speech intensities in imitation tasks compared to healthy controls (Adams et al.,
2006; Clark et al., 2014; De Keyser et al., 2016). Clark and colleagues (2014) and De
Keyser and colleauges (2016) found flatter slopes in the imitation function for PD
participants (using 60-80dB stimuli in 5dB increments). De Keyser and colleagues (2016)
was restricted to the higher intensity imitation condition only (80dB). Adams and
colleagues (2006) found 3-4dB differences in intensity (reduced) across the target
imitation levels (60, 70, 80dB). However, Adams and colleagues (2006) did not find
significantly different slope functions compared to healthy controls. Interestingly,
adequate intensity capacity was displayed by PD participants in these studies (as
evidenced during maximum intensity tasks), despite the reduced levels produced during
the imitation tasks (Adams et al., 2006; Clark et al., 2014; De Keyser et al., 2016). The
underestimation and reduced production observed in these studies is suggestive of
abnormal processing of sensory information or abnormal sensorimotor integration, or
both.
1.4.6 Loudness Perception
Loudness is a psychological characteristic of speech. It is the auditory sensation
of speech sounds, which can be ordered on a scale ranging from quiet to loud (American
National Standards Association, 1973). The measurement of loudness therefore begins
with our perception of loudness itself. It is suggested that our perception and
quantification of intensity begins with physical signals that are evaluated by the central
nervous system as magnitudes (Warren, 1973).
When estimations of the loudness of speech are examined, it is important to
consider who is responsible for the judgement. There are distinct variables to consider if
the speaker is making the judgement regarding their self-perceived loudness level
(autophonic judgement). This type of judgement presumably accounts for proprioception,
conduction (compared to extraphonic judgements of externally generated sounds which
are perceived through air conduction alone). Healthy speakers have a magnitude
estimation of the loudness function equal to 0.91 when asked to estimate the loudness of
their speech using autophonic and extraphonic judgements (Lane et al., 1961).
Anecdotal reports of individuals with PD-related hypophonia describe a lack of
awareness of their reduced speech intensity (Dromey & Adams, 2000; Duffy, 1995). A
variety of methodologies have been used to explore loudness perception in PD during
speaking tasks. Ho and colleagues (2000) found that individuals with PD overestimated
their own speech loudness during both immediate and playback conditions when reading
and during conversation (using a volume knob to replicate the loudness of the intended
stimuli) compared to healthy controls. However, this study did not examine whether this
abnormal perception of speech loudness is regarding external stimuli or of self-generated
speech loudness only. Conversely, a study by Dromey and Adams (2000) did not find a
significant difference between individuals with PD and healthy controls in the perception
of speech intensity (loudness estimates, magnitude production task). Kwan and Whitehill
(2011) provided evidence of a loudness perception deficit in self-generated speech only.
Studies have also provided evidence of abnormal perception of externally generated
speech, however to a lesser extent compared to self-generated speech (Clark et al., 2014;
Ho et al., 1999; De Keyser et al., 2016). Possible explanations for this difference may
relate to the inherent differences between autophonic and extrapohonic types of loudness
judgements.
Self-rating scales have also been used in autophonic loudness judgements or
their speech intensity by placing a dash along a visual analog scale or an equal appearing
interval scale to represent their perception of their speech at a certain point in time. The
scale may range from a complete presence of adequate speech volume to complete
absence of adequate speech volume. This type of measure has provided evidence that
individuals with PD perceive their self-generated speech as significantly more impaired
with regards to speech intensity compared to healthy controls (Fox & Ramig, 1997).
However, it is conceivable that individuals with PD may not accurately perceive the
severity of their hypophonia impairment.
1.5 Altered Auditory Feedback and Speech Intensity Regulation in PD
It is predicted that evidence for a sensorimotor integration deficit hypothesis for
speech production would be most apparent during an ongoing speech movement. If
during a speech movement one experiences unexpected alterations of the sensory
feedback (auditory, visual, proprioceptive) the system should be able to recognize the
incongruence from the efference copy (motor plan) and adjust or compensate accordingly.
For example, previous literature has described this type of compensatory response by
healthy speakers (pitch and formant structure perturbations) as an alteration in speech
production in the opposite direction to the perturbation (Purcell & Munhall, 2006;
Tourville, Reilly, & Guenther, 2008; Burnett, Freedland, Larson, & Hain, 1998). An
alternate method of manipulating auditory feedback is to completely mask perception and
evaluate performance in the absence of auditory feedback. In PD populations, it has been
suggested that hypophonia may be a result of auditory-motor integration deficits (Adams
intensity regulation in the absence of auditory feedback in PD populations may be
abnormal and further examination of this abnormality may provide insight into which
part of the process is disrupted. Finally, by instructing a speaker to ignore the auditory
feedback and measuring their accuracy during this task, it is possible to examine the
degree to which the role of auditory feedback for speech intensity regulation is under
deliberate and voluntary control.
1.5.1 Altered Intensity Feedback (AIF)
The role of sensorimotor integration for speech intensity regulation can be
examined by systematically altering sensory feedback. Abnormal responses during error
correction paradigms can indicate a dysfunctional sensorimotor integration system.
Altered intensity feedback is proposed to examine this. Findings from this research will
help elucidate whether the PD system has under-influence of sensory feedback during
speech, or overreliance on sensory feedback. Auditory feedback can be manipulated in a
predictable manner (for which Mollaei, Shiller, and Gracco in 2013 found that PD
participants responded with reduced magnitude), to explore error-based learning.
Conversely, unpredictable manipulations (as will be the focus here) may be used to
examine online sensorimotor control.
Perturbation studies involve the rapid response and compensation to a brief
(<200ms) perturbation to the speech signal (pitch, formant frequency, duration, intensity,
etc.). Healthy participants respond to unexpected brief perturbations of speech intensity
by compensating in the opposite direction to the feedback (Bauer, Mittal, Larson, & Hain,
formant frequency) have found that PD participants exhibit an abnormal response to
sensorimotor integration compared to the control groups (larger magnitude of
compensation, longer response peak and end durations) (Chen et al., 2013; Huang et al.,
2016; Mollaei et al., 2013, Mollaei, Shiller, Baum, & Gracco, 2016). Similarly, Liu,
Wang, Metman, and Larson (2012) found larger response magnitudes to intensity
perturbations by PD participants compared to healthy controls.
Altered intensity feedback (AIF) involves the presentation of one’s own speech
via headphones for the duration of the utterance. This type of manipulation causes the
participant to hear their speech at an altered (increased or decreased) intensity than is
actually produced. This results in a healthy speaker adjusting their intensity to speak at a
quieter loudness when hearing increased intensity feedback, as a presumed compensatory
measure (Ho et al., 1999; Lane, Tranel, & Sisson, 1969; Lane et al., 1961; Siegel & Pick,
1974). Few previous studies have examined responses to AIF in PD. Ho and colleagues
(1999) found that individuals with PD failed to adjust their volume in a conversation task,
implying a disrupted loudness perception. This study did not evaluate the response of PD
participants to decreased intensity feedback. Interestingly, separate results from syllable,
reading, and counting tasks depict the PD group responding similarly to controls (Brajot,
Shiller, & Gracco, 2016; Coutinho, Oliveira, & Behlau, 2009; Ho et al., 1999), suggestive
of a possible task effect. There is a dysfunctional system in PD as evidenced by abnormal
responses during error correction tasks. Due to limited previous research, the impact of
altered intensity feedback on speech intensity regulation in PD populations requires
1.5.2 Complete Masking of Auditory Feedback
Speaking in complete masking noise may also provide evidence of the role of
auditory feedback during speech. Researchers determined that vowel space decreased and
vowel dispersion measures increased when speaking in a high level masking noise
condition (which completely masked auditory feedback) (Lane et al., 2005). The
increased dispersion has been related to reduced vowel contrast and therefore results in
decreased speech intelligibility of the speaker. Other researchers have provided evidence
of minimal changes from background noise conditions to high level masking noise
conditions (2dB increase in speech intensity), leading to the hypothesis that speech task
may impact production change to a greater degree than noise levels alone (Van Summers,
Pisoni, Bernacki, Pedlow, & Stokes, 1988). This may relate to Lindblom’s notion of
economy of effort (1990), whereby it is possible that when speech is perceived through
the auditory system, speakers are better able to control and finely tune speech intensity
for the speaking task, however in the presence of a degraded sound environment such as
complete masking noise, intensity compensations or adjustments for the speech task may
be lowered in priority.
Researchers have examined differences between pre-lingually deafened and
post-lingually deafened individuals and have found that post-post-lingually deafened speakers rely
less on auditory feedback monitoring due to already established speech sound control
(internal representations). In addition, Black (1951) found linear increases in speech
intensity with exposure to noise-induced hearing loss. However, the impact on PD
speakers is worth investigating as it is unpredictable how perceptual mechanisms are
speech intensity regulation in the PD population is yet to be examined. If unable to
utilize auditory feedback mechanisms will individuals with PD be capable of regulating
speech intensity through previously learned speech sound control? Will these individuals
be more severely impacted compared to neurologically healthy speakers? To our
knowledge, no study to date has explored the impact of completely masked auditory
feedback on speech intensity regulation in PD populations.
1.5.3 Instruction to Ignore Auditory Feedback
Munhall, MacDonald, Byrne, and Johnsrude (2009) found that healthy subjects
compensated for altered feedback whether they were provided instructions to ignore the
feedback or not suggesting absence of conscious awareness of these compensations. The
degree to which the system relies on sensory feedback will also depend on the reliability
of the source (Shadmehr, Smith, & Krakauer, 2010; Sober & Sabes, 2005). Due to the
progressive nature of PD, some aspects of sensory processing may be weighted as less
reliable (unpredictable) or more reliable (predictable). For example, it is possible that the
acoustic reflex and/or auditory nerve are compromising the integrity of the auditory
system (Yylmaz et al., 2009; Gawel, Das, Vincent, & Rose, 1981). This may result in
under-reliance of auditory information during speaking tasks in individuals with PD.
Lametti, Nasir, and Ostry (2012) found that by applying two perturbations
simultaneously (one auditory one somatosensory; pitch perturbations and robotic arm
making subtle jaw displacements), subjects preferentially rely on one or the other. In
other words, the more they compensated for one perturbation, the less they compensated
for the other. Therefore, it may be possible to assume that with altered auditory feedback