Three-dimensional finite element analysis of maxillary sinus floor
augmentation with optimal positioning of a bone graft block
Peter Schuller-Götzburg1, Thomas Forte1, 2, Werner Pomwenger2, Alexander Petutschnigg3,
Franz Watzinger4, Karl Entacher2
1 Prosthetics, Biomechanics and Biomaterial Research, Paracelsus Medical University, Stubergasse 21, A-5020 Salzburg, Austria
2 Department of Information Technologies and System Management, Salzburg University of Applied Science, Urstein Süd 1, A-5412 Puch/Salzburg, Austria
3 Department of Forest Products Technology and Wood Construction, Salzburg University of Applied Sciences, Markt 136a A-5431 Kuchl, Austria
4 Department of Maxillofacial Surgery, Landesklinikum St. Pölten – Lilienfeld, Probst-Führer-Str. 4, A-3100 St. Pölten, Austria
Corresponding author:
DDr. Peter Schuller-Götzburg aHCM (MD, DDS) Paracelsus Medical University
Prosthetics, Biomechanics and Biomaterial Research Strubergasse 21
A-5020 Salzburg AUSTRIA
Phone: +43 676 533 98 32 Fax: +43 662 880769
Mail: [email protected]
2 Abstract
Purpose: The aim of the present experimental 3D-finite element study was to evaluate the influence of an augmented sinus lift with an additional inserted bone graft block. The bone graft block stabilizes the implant in addition to conventional augmented bone. We placed the block in three different positions. The implants were loaded with axial force and forces secondary to laterotrusion and protrusion.
Material and Methods: A simplified U-shaped 3D finite element model of the upper jaw and a more complex anatomical model of the left maxilla were created. The bone graft block was placed in three positions: in the lower third in contact with the sinus floor, the middle, and the upper third of the implant. Van Mises’ stress distribution was calculated and analyzed for the different models. We also compared the complex anatomical model with the simplified one. Results: The position of the bone graft block significantly influences the magnitude of stress distribution. A bone graft block positioned in the upper third or middle of the implant reduces the quantity of stress compared to the reference model without a bone graft block. The low bone graft block position is clearly associated with lower stress distribution in compact bone. We registered no significant differences in stress in compact bone with regard to laterotrusion or protrusion.
Conclusions: Maximum values of von Mises stresses in compact bone can be reduced significantly by using a bone graft block. The reduction of stress is nearly the same for positions in the upper third and the middle of the implant. It is much more pronounced when the bone graft block is in the lower third of the implant near the sinus floor, which appeared to be the best position in the present study.
3
Introduction
Finite element (FE) analysis is an engineering and mathematical tool for structural analysis of bone morphology, implants, and load transfer in order to optimize surgical methods, design, and the fixation of implants. Recent developments in the generation of finite element models, the quality of computed tomography (CT) imaging and segmentation algorithms, faster computers, and the accuracy of finite element modeling have greatly enhanced the simulation of the individual patient’s anatomy [1,2].
Successful dental implant rehabilitation of the molars in a partly edentulous or completely edentulous maxilla depends on the quantity and quality of available alveolar bone. Low bone height may result from several factors, such as alveolar bone resorption after tooth extraction, periodontal disease, pneumatization of the sinus, or sinus morphology. Conventional implant insertion may not be feasible in cases of bone thickness below 3 or 2 mm. The patients may require bone augmentation procedures. Sinus lift with elevation of the Schneiderian membrane and augmentation of the subantral space are commonly used in this setting [3, 4].
As sufficient primary stability could not be achieved in patients with alveolar bone less than 2 mm thick, we used a modified procedure in these cases. A cortical bone graft block from the retromolar region of the mandible was inserted into the sinus during sinus lift augmentation from a lateral window, using granulated autogenous/xenogeneic bone material. The bone graft block was anchored with two fixations screws (Figure 1). The latter permitted placement of the bone graft block in different positions in the sinus. The screws can be removed after four months; the screw holes serve as guidance for the insertion of dental implants. The method involves a two-step procedure: the first is augmentation while the second is the insertion of the implants after four months [5].
4 integration of the implants into bone. It also minimizes loss rates during post-surgical implant healing.
The aim of the present study was to evaluate the different positions of the bone graft block with regard to the stability of the implants in the augmented maxillary sinus, using 3D-FE models. We investigated the implants in the healing phase and after osseointegration.
The results of FE analysis depend significantly on the complexity and quality of the underlying models. One of the aims of the study was to analyze whether complex anatomical models are necessary or whether simplified 3D FE models are sufficient to obtain answers to the main questions of the study. Does one need to design an anatomical model? Two models - a simplified 3D U-shaped FE model and an anatomical 3D-FE model [8] – were generated to obtain results independent of geometric irregularities. The main purpose was to determine the most suitable position of the bone graft block with regard to compact bone, load directions as simulated by central, lateral and protrusive loading, and boundary conditions with a minimum of surrounding stresses. Three different positions of the bone graft block were studied.
Material and Methods
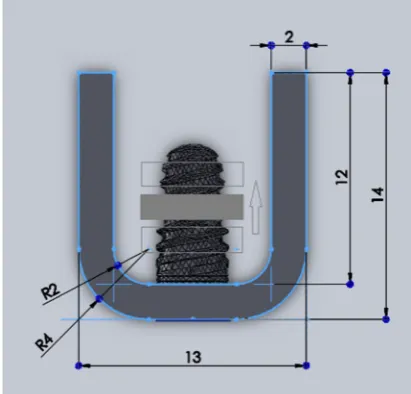
Finite element analyses were performed using two geometric models. M1 is a simplified U-shaped model with a compact bone thickness of 2 mm (Figure 2) while M2 is a 3D anatomical model based on CT data (Figure 3). Each model contains a bone graft block (2.0 x 6.0 x 8.0 mm) of compact bone with surrounding bone augmentation, and an implant of 4 mm diameter and 10 mm length (titanium grade 4, blueSky 4010, Bredent Medical, Germany). Three positions of the bone graft block were used: 2.60 mm, 5.27 mm, and 7.93 mm from the implant neck.
A so-called reference model was analyzed additionally, omitting the bone graft in both geometric models (Table 1).
5 Two types of contact between the implant and compact bone were used in the simplified M1 model. First, the contact between the implant and compact bone was bonded. This contact definition is used to simulate the osseointegrated state. Second, frictional contact (as in nature) with a friction coefficient of 0.3 was employed [9]. The friction coefficient was used according to previous studies [9]; it simulates the contact of the implant after insertion, at the beginning of the osseointegration process [10,11,12].
Young’s modulus for cancellous bone and bone augmentation is 1.4 GPa; Poisson’s ratio µ is 0.30. For cortical bone, compact bone and bone grafts, Young’s modulus is 14 GPa and Poisson’s ratio µ = 0.30. For titanium alloy, Young’s modulus is 103.4 GPa and Poisson’s ratio µ = 0.35 [21].
The implant was loaded mechanically (masticatory, protrusive and laterotrusive load at abutment position), 9.0 mm away from the implant neck, at the level of crestal bone.
Loads applied on the dental implant at the end of the simplified abutment, as measured by Mericske-Stern [13] were as follows:
- Fz = 96 N in the z-axis representing masticatory force,
- Py = 36 N in the y-axis presumed from protrusion, and
- Lx = 13 N in the x-axis from laterotrusion.
One load situation was defined for each load, as combinations can be easily calculated by superposition. This was done to analyze the effect of different bone graft positions on different load directions. The boundary conditions were defined as fixed supports in the cross-sectional areas of compact bone and augmentation – four surfaces in all – that constrain all vertical and translational degrees of freedom.
6 A local area net refinement around the shoulder of the implant was defined for meshing compact bone and augmentation. The number of nodes in compact bone were 41,700 in Model 1 and 88,400 in Model 2.
Results
Bone graft position
1.) Equivalent von Mises stresses for compact bone
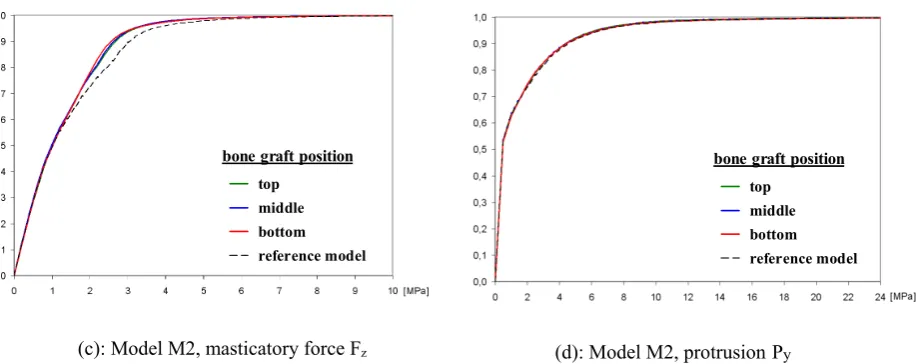
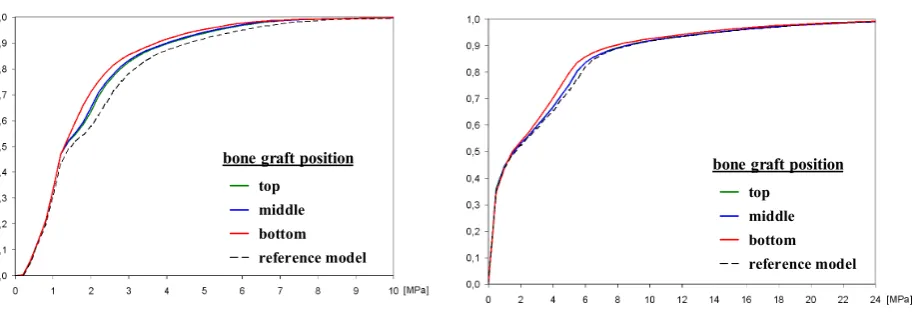
The diagrams in Figure 4 show cumulative distribution functions plots (CDF plots) of von Mises stress distribution values in compact bone, evaluated for masticatory force Fz and
protrusion load Py for the models M1 and M2. CDF plots serve as a simple method to visualize
significant shifts in distribution. Principally the stresses should be below 20 MPa because higher stresses cause resorption of the bone [24,25]. A shift of the CDF curve to the left indicates lower stresses in the augmented bone.
In comparison to Figure 4, the CDF plots for the models M1 and M2 with laterotrusion loading Lx qualitatively show the same behavior as for protrusion loading.
Model M1 – compact bone thickness 2 mm
For masticatory force Fz, the lowest bone graft block position had the lowest von Mises stress
distribution. The difference between the reference model and the M1 model is notable. In addition, there is a slight difference between the center and the top bone graft block position. The analysis with loads of protrusion Py and laterotrusion Lx revealed no significant differences
with regard to the distribution of von Mises stress in compact bone due to the position of the bone graft block. Von Mises stresses were higher for Py and Lx (up to 56.2 MPa for Py and 19.4
MPa for Lx) than for masticatory force Fz (max 15.3 MPa).
7 For masticatory force Fz, placing the bone graft block in the lowest position again resulted in
the lowest stress distribution for compact bone. Due to the more complex and larger geometry of compact bone – resulting in more numerous elements – the difference is not as significant as it is in the M1 model.
For Py (protrusion) and Lx (laterotrusion), we again registered non-significant differences in
the distribution of von Mises stress in compact bone due to the position of the bone graft block. Figure 5 shows representative von Mises stresses for the M2_c model (bone graft block in the center of the implant) that result from masticatory force Fz and protrusion load Py. Maximum
von Mises stresses occur in the lower part of compact bone for both loads. The stress values for Fz are approximately three times lower than those for Py.. In Figure 8 the von Mises stresses
increase to 15.5 MPa for masticatory force Fz,and reach 52.8 MPa for protrusion load Py. The
differently scaled color plots in Figure 5 show a smaller red area for Fz, which signals stresses
greater than 8 MPa compared to Py, where the red area represents stresses greater than 22 MPa.
The M1 and M2 models show the same trends for Py and Lx.
2.) Strain energy in model M1 – compact bone thickness of 2 mm
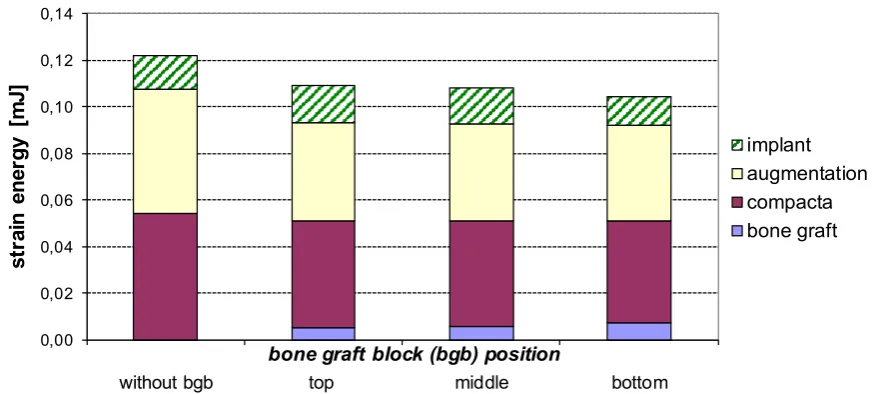
Subsequent strain energy in the bone graft block, in compact bone, the augmentation, and the implant are shown in the M1 model for masticatory load Fz (Figure 6, Table 2) and for
protrusion load Py (Figure 7, Table 3). For masticatory force Fz, the strain energy of compact
bone is reduced because of the bone graft block compared to the reference model. This occurs relatively independent of bone graft block position. Furthermore, a low bone graft block position reduces strain density for the implant and the augmentation to a slight extent.
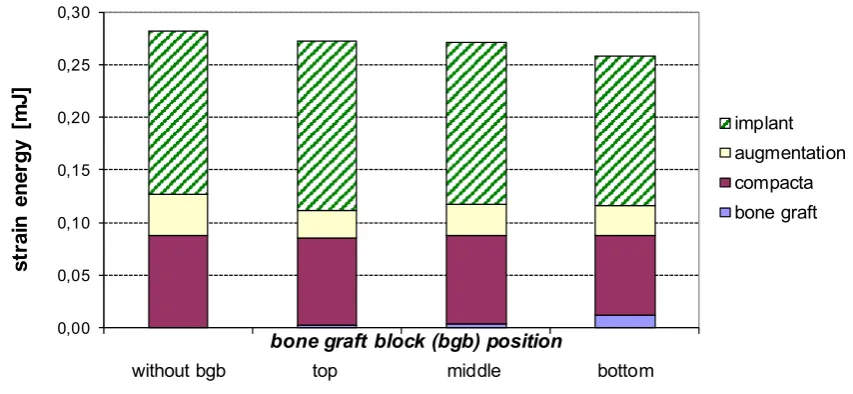
For protrusion load Py, a low bone graft position is able to reduce the strain energy of compact
8 graft block. The bone graft block and its position directly influence strain energy in compact bone for Py in the M1 model. The implant strain energy is slightly higher in the M1 model with
the bone graft block on the top, and slightly lower in the M1 model with the bone graft block below, compared to the reference model without a bone graft block. There is a slight decrease in the strain energy of the implant in the M1_t model with the bone graft block on the top compared to the M1_b model with the low bone graft block position. Figure 6 and Figure 7 show that the system turns stiffer in the presence of the bone graft block compared to the reference model for masticatory and protrusion loads Fz and Py.
The strain energy values of M1 are shown in Table 2 and Table 3.
Consideration of the friction coefficient in contact between the implant and compact bone
In the simplified M1 model, we defined a friction coefficient between the surfaces of the implant and compact bone in order to prevent high tensile stresses in this area. Further, the stress distribution is more realistic when using this contact definition, as shown in Figure 8. M1f - compact bone thickness of 2 mm
The stress gradient in compact bone for Fz shows very similar behavior as it does in bonded
contact. The consideration of a friction coefficient results in lower von Mises stresses in compact bone. An interesting difference is noted for Py compared to bonded contact. In terms
of bone graft block position, there is a gradual reduction of von Mises stresses starting from the reference model M1f_r without a bone graft block, to the top bone graft block position, to
the center position, and finally to the low position in the M1f_b model. Meanwhile, no
9 Strain energy in the M1f model
For masticatory force Fz, the strain energy distribution is similar in the bonded situation and
under consideration of a defined friction coefficient (Figure 10). The strain energy of compact bone was reduced because of the bone graft block compared to the reference model, while different bone graft block positions did not influence the strain energy of compact bone. Furthermore, a low bone graft block position slightly reduced the strain density for the implant and the augmentation, but did not affect the strain energy of compact bone. Figure 10 shows that the system turns stiffer in the presence of the bone graft block compared to the reference model.
When Py was applied, the overall strain energy was higher for a defined friction coefficient
than it was for bonded contact (compare Figure 7 with Figure 11). In other words, for Py the
M1f system is less stiff when using the definition of a friction coefficient. Implant deformation
does not increase due to the presence of the bone graft block.
Additional information
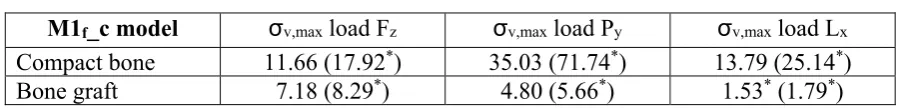
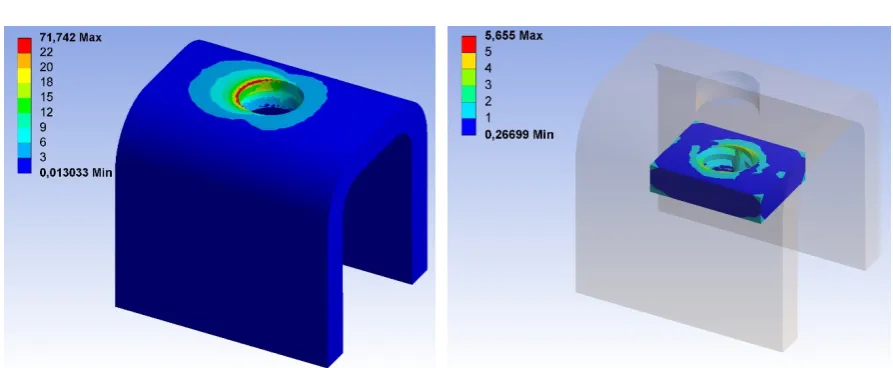
Maximum von Mises stresses in the bone graft block and in compact bone are listed for the M1f_c model in Table 4.
For masticatory force Fz, the maximum von Mises stress is considerably higher in compact
bone (17.92 N/mm²) than in the bone graft (8.29 N/mm²). High stress values occur in the area of transition between the bone graft block, the augmentation, and the implant. Maximum von Mises stresses for Py and for Lx may be regarded as local peak stress values. Neglecting the
peak values results in greater von Mises stresses in compact bone (71.74 N/mm² for Py and
25.14 N/mm² for Lx) than in the bone graft block (5.66 N/mm² for Py and 1.79 N/mm² for Lx).
10 protrusion load Py in the same model. Both figures were used to determine the values shown in
Table 4 above.
Discussion
Performing implantation in areas of the maxilla with small quantities of alveolar bone requires different methods of augmentation. Sinus lift surgery is a common and proven method for this purpose [3,4]. One method of augmentation in the presence of alveolar bone heights below 3 mm, contrary to conventional lateral wall sinus floor elevation, is the introduction of an additional cortical bone graft block [5,7,14] for greater stabilization of the implant.
This study describes the influence of the position of the bone graft block in a simplified U-shaped model and an anatomical model, using different loads, with the aid of the 3D finite-element (FE) method. Cumulative distribution functions (CDF’s) are used to interpret the results as well as visualize changes between distributions in the statistical analysis [5,11,15,16]. The finite element method is a common numerical stress analysis in engineering and biomechanics, used to resolve mechanical problems [1,10,13,17]. FE models with complex geometric structures can be easily modified to accommodate various assumptions. The quality of the FE model is determined by its concurrence with anatomical and natural conditions [2,11,18,19,20,21].
11 The main purpose of this study was to evaluate the ideal biomechanical position of the bone graft block on dental implants used for maxillary sinus floor elevation. Three positions of the bone graft block were used: the lower third, middle, and upper third of the implant. The position closest to compact bone resulted in the lowest von Mises stress distribution within compact bone. This behavior was observed for different model types (patient-specific anatomical model and simplified geometric model) as well as for different load directions and boundary conditions. Therefore, the bone graft block position closest to compact bone in the lower third of the implant is regarded as the best position.
The results indicated three global stress patterns: 1) Stress was highest in cortical bone, lower in the bone graft block, and lowest in the augmented bone (cancellous bone); 2) Stresses occurring at off-axial loads were higher in cortical bone and the bone graft block, and lower in augmented bone (cancellous bone) compared with axial loads; 3) High stress concentrations occur at the helical threads of the implant [28]. 4) The high von Mises stresses for protrusive load Py occur at the outermost edges between compact bone and implant and should be reduced
by adaption of the implant geometry to avoid first bone resorption and then bone-remodeling in these areas.
For masticatory force Fz, von Mises stresses within compact bone were significantly reduced
when using a bone graft block compared to the reference model without a bone graft block. The reduction was approximately the same for the bone graft block position in the upper third and the middle of the implant. The reduction of stresses was very pronounced with the bone graft block in the lower third of the implant.
12 For protrusive load Py and laterotrusive load Lx, only those models with friction contact
between the implant and compact bone showed significant differences in respect of von Mises stress distributions. A friction coefficient of 0.3 [9] was simulated for osseointegration as it occurs after implant insertion [12,29,30]. Duyck [10] reported no significant difference between higher friction coefficients. Specifically, the lowest position of the bone graft block resulted in the lowest stress distribution. There was no significant difference in the stress distribution of the bone graft block position in bonded contact models loaded with Py and Lx.
Even models with and without bone graft blocks showed no significant difference in regard of bonded contact. On the other hand, evaluating the strain energy of the individual parts shows that the bone graft block participates in load transfer to the greatest extent in the lower position and discharges maximum energy to compact bone by reducing its strain energy.
The 3D patient-specific anatomical model (M2) with geometric and natural irregularities from CT data is similar to the simplified U-shaped model (M1) for masticatory force Fz. Therefore,
a simplified model is advisable for exploring the optimal bone graft block position in general. Complex patient-specific 3D FE models with a large number of nodes are not necessary to assess implants in the distal region of the maxilla. Simple models with fewer nodes can be analyzed and compared easily with the same outcome as anatomical models [6].
Acknowledgments
The project was supported by the Austrian Science Fund FWF L526-B05 and by the RISE Project R-09/03/003-SCH at Paracelsus Medical University, Salzburg, Austria.
The study was approved by the Ethics Committee of Salzburg (Ethikkommission für das Bundesland Salzburg), Approval No. 415-E803/3-2007.
13
References
1. Poelert S, Valstar E, Weinans H, Zadpoor AA. Patient-specific finite element modeling of bones.
Proc Inst Mech Eng H 2013:227(4):464-478.
2. Zimmermann R, Seitz S, Vargas L. The use of virtual models to estimate the amount of grafting
material: a case study. Int J Oral Maxillofac Implants. 2015;30(3):e43-e44.
3. Boyne PJ, James RA. Grafting of the maxillary sinus floor with autogenous marrow and bone. J Oral
Surg 1980;38(8):613–616.
4. Guerrero JS, Al-Jandan BA. Lateral wall sinus floor elevation for implant placement: revisiting
fundamentals and the surgical technique. J Calif Dent Assoc 2013; 41(3):185-195.
5. Schuller-Götzburg P, Entacher K, Petutschnigg A, Pomwenger W, Watzinger F. Sinus lift with
cortical bone graft block: a patient-specific 3D-finite element study. Int J Oral Maxillofac Implants 2012;27:359-368.
6. Xu Yan, Xinwen Zhang, Weichao Chi, Hongjun Ai, Lin Wu. Comparing the influence of crestal
cortical bone and sinus floor cortical bone in posterior maxilla bi-cortical dental implantation: A three-dimensional finite element analysis. Acta Odontol Scand; in press.
7. Khoury F. Augmentation of the sinus floor with mandibular bone block and simultaneous
implantation: a 6-year clinical investigation. Int J Oral Maxillofac Implants. 1999;14(4):557-564.
8. Joda T, Bragger U, Gallucci G. Systematic literature review of digital three-dimensional
superimposition techniques to create virtual dental patients. Int J Oral Maxillofac Implants.
2015;30(2):330-337.
9. Lin CL, Chang SH, Chang WJ, Kuo YC. Factorial analysis of variables influencing mechanical
characteristics of a single tooth implant placed in the maxilla using finite element analysis and the statistics-based taguchi method. Eur J Oral Sci 2007;115(5):408–416.
10. Duyck J, Van Oosterwyck DJ, De Cooman H, Puers M, Vander Sloten R, Naert I.
Three-dimensional force measurements on oral implants: a methodological study. J Oral Rehabil 2000;27:744-753.
11.Tepper G, Haas R, Zechner W, Krach W, Watzek G. Three-dimensional finite element analysis of
implant stability in the atrophic posterior maxilla: a mathematical study of the sinus floor augmentation. Clin Oral Implants Res 2002;13(6):657–665.
12.Grant JA, Bishop NE, Götzen N, Sprecher C, Honl M, Morlock MM. Artificial composite as a model
of human trabecular bone: The implant-bone interface. J Biomech 2007;40:1158-1164.
13. Mericske-Stern R, Venetz E, Fahrlander F, Burgin W. In vivo force measurements on maxillary
implants supporting a fixed prosthesis or an overdenture: a pilot study. J Prosthet Dent 2000;84:535–547.
14.Jensen OT, Shulman LB, Block MS, Iacono VJ. Report of the Sinus Consensus Conference of 1996.
Int J Oral Maxillofac Implants 1998;13 Suppl:11-45.
15. Pesqueria A, Goiato M, Gennari-Filho H, Monteiro D, Dos Santos D, Haddad M, Pellizzer E. The
use of stress analysis methods to evaluate the biomechanics of oral rehabilitation with implants. J Oral Implantol 2012:Mar 1, in press.
16. Himmlová L, Dostálová T, Kácovsky A, Konvicková S. Influence of implant length and diameter
on stress distribution: a finite element analysis. J Prosthet Dent, 91(1):20–5, Jan 2004.
17. Koca OL, Eskitascioglu G, Usumez A. Three-dimensional finite-element analysis of functional
stresses in different bone locations produced by implants placed in the maxillary posterior region of the sinus floor. J Prosthet Dent, 93(1):38–44, Jan 2005.
18. Okumura N, Stegaroiu R, Kitamura E, Kurokawa K, Nomura S. Influence of maxillary cortical bone
14
19. Van Staden RC, Guan H, Loo YC. Application of the finite element method in dental implant
research. Comput Method Biomec 2006;9:257-270.
20. Li T, Yang X, Zhang D, Zhou H, Shao J, Ding Y, Kong L. Analysis of the biomechanical feasibility
of a wide implant in moderately atrophic maxillary sinusregion with finite element method. Oral
Surg Oral Med O 2012;114: e1-e8.
21. Fanuscu M.I, Vu HV, Poncelet B. Implant biomechanics in grafted sinus: a finite element analysis.
J Oral Implantol, 30(2):59–68, 2004.
22. Peterson J, Wang Q, Dechow PC. Material properties of the dentate maxilla. Anat Rec A Discov
Mol Cell Evol Biol 2006;288(9):962–972.
23. Garcia D, Zysset PK, Charlebois M, Curnier A. A three-dimensional elastic plastic damage
constitutive law for bone tissue. Biomech Model Mechanobiol 2009;8(2):149–165.
24. Wolf, J. Das Gesetz der Transformation der Knochen - 1892. Reprint: Pro Business, Berlin 2010.
25. Frost HM. From Wolff’s law to the Utah paradigm: Insights about bone physiology and its clinical
applications. The Anatomical Record, 262: 398-419, 2001.
26. Mullender MG and Huiskes R. Proposal for the regulatory mechanism of Wolff’s law. J Orthop Res
1995;13(4):503–12.
27. Shanbhag S, Shanbhag V, Stavropoulos A. Volume changes of maxillary sinus augmentations over
time: a systematic review. Int J Oral Maxillofac Implants. 2014;29(4):881-892.
28. Schuller-Götzburg P, Krenkel C, Reiter TJ, Plenk H. 2D-finite element analyses and
histomorphology of lag screws with and without a biconcave washer. J Biomech 1999:32:511-520.
29. Ding X, Zhu XH, Liao SH, Zhang XH, Chen H. Implant-bone interface stress distribution in
immediately loaded implants of different diameters: a three-dimensional finite element analysis. J Prosthodont, 18(5):393–402, Jul 2009.
30. Goiato MC, Bannwart LC, Pesqueria AA, Santos DM, Haddad MF, Santos MR, Castilho PU.
15 FIGURE CAPTIONS
Figure 1. CT of the augmented left maxillary sinus with two fixing screws and the bone graft block. Blue indicates segmented compact bone; green indicates segmented augmented bone.
Figure 2. Simplified U-shaped 3D FE model M1. Bone graft block in the center of the dental implant. The different positions of the bone graft block are shown.
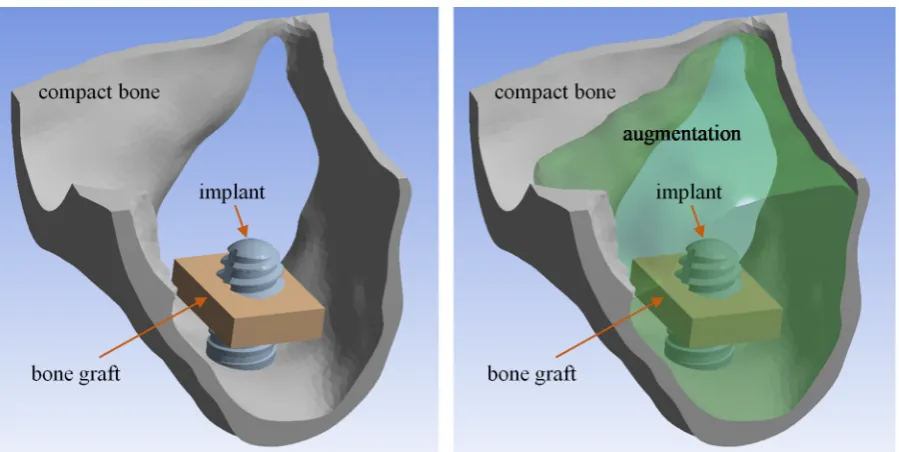
Figure 3. M2_c model. Left: compact bone, the implant and the bone graft in center position; right: compact bone with augmentation.
Figure 4. CDF plot of von Mises stress in compact bone for different models M1 and M2, masticatory force Fz compared to protrusion load Py.
Figure 5. Von Mises stress in compact bone in the M2_c model with the bone graft positioned in the center; Fz (masticatory force) on the left and Py (protrusion) on the right (augmentation as in Figure 2, but not shown here).
Figure 6. Strain energy in the M1 model, with Fz (masticatory force) applied.
Figure 7. Strain energy in the M1 model, with Py (protrusion) applied.
Figure 8. Von Mises stress distribution in compact bone due to load Py (protrusion), as seen from below; definitions of left bonded contact and right friction contact between the implant and compact bone.
Figure 9. CDF plot of von Mises stress in 2 mm compact bone for the M2f model, using different frictions and
loads.
Figure 10. Strain energy in the M1f model, with friction and Fz (masticatory force) applied.
Figure 11. Strain energy in the M1f model, with Py (protrusion) applied.
Figure 12. M1f_c model: von Mises stresses in compact bone (left) and the bone graft (right), with Fz (masticatory force) applied.
16 TABLE CAPTIONS
Table 1: Twelve analyzed FE models
M1 … 2 mm compact bone thickness
M2 … model from CT data with variable compact bone thickness t … position: on the top of the bone graft block
c … position: in the center of the bone graft block b … position: below the bone graft block
r … reference model without the bone graft block
f … ‘f ‘ refers to friction contact between the implant and compact bone
Table 2: Strain energy in the M2 model, with Fz (masticatory force) applied.
Table 3: Strain energy in the M2 model, with Py (protrusion) applied.
Table 4: Maximum von Mises stresses [N/mm²]; maximum values are given in parentheses.
17
Table 1
Bone graft position (main question)
Model (sub-question 1)
On the top (t)
In the center (c)
Below (b) Referenc e model (r)
Additional information
M1
M1_t M1_c M1_b M1_r Compact bone 2 mm
(osseointegrated phase) M1f_t M1f_c M1f_b M1f_r Compact bone 2 mm with
friction contact (healing phase)
M2 M2_t M2_c M2_b M2_r Model from CT data
(osseointegrated phase) Table 1. Twelve analyzed FE models
M1 … 2 mm compact bone thickness
M2 … model based on CT data with variable compact bone thickness t … top position of the bone graft
c … center position of the bone graft b … lower position of the bone graft r … reference model without a bone graft
f … ‘f ‘ refers to friction contact between the implant and compact bone
Table 2
M1_r M1_t M1_c M1_b
Bone graft 0.005 0.006 0.007 mJ Compact bone 0.054 0.046 0.045 0.044 mJ Augmentation 0.053 0.042 0.042 0.041 mJ Implant 0.014 0.016 0.015 0.012 mJ
Table 2. Strain energy [mJ] in the M1 model, with Fz (masticatory force) applied.
Table 3
M1_r M1_t M1_c M1_b
Bone graft 0.001 0.002 0.006 mJ Compact bone 0.077 0.073 0.074 0.070 mJ Augmentation 0.027 0.020 0.021 0.023 mJ Implant 0.090 0.094 0.090 0.083 mJ
Table 3. Strain energy [mJ] in the M1 model, with Py (protrusion) applied.
Table 4
M1f_c model σv,max load Fz σv,max load Py σv,max load Lx
Compact bone 11.66 (17.92*) 35.03 (71.74*) 13.79 (25.14*)
Bone graft 7.18 (8.29*) 4.80 (5.66*) 1.53* (1.79*)
18 Figure 1
Figure 1. CT of the augmented left maxillary sinus with two fixing screws and the bone graft block. Blue indicates segmented compact bone; green indicates segmented augmented bone.
Figure 2
19 Figure 3
Figure 3. M2_c model – left: compact bone, the implant and the bone graft in middle position; right: compact bone with augmentation.
Figure 4
(a): Model M1, masticatory force Fz (b): Model M1, protrusion Py
top middle bottom reference model
bone graft position
top middle bottom reference model
20
(c): Model M2, masticatory force Fz (d): Model M2, protrusionPy
Figure 4. CDF plot of von Mises stress in compact bone for the M1 and M2 models; masticatory force Fz compared to protrusion load Py.
Figure 5
Figure 5. Von Mises stress [MPa] in compact bone in the M2_c model, with the bone graft positioned in the center; Fz (masticatory force) on the left and Py (protrusion) on the right (augmentation as in Fig. 2, but not shown
here).
top middle bottom reference model
bone graft position
top middle bottom reference model
21 Figure 6
Figure 6. Strain energy in the M1 model, with Fz (masticatory force) applied.
Figure 7
Figure 7. Strain energy in the M1 model, with Py (protrusion) applied.
0,00 0,02 0,04 0,06 0,08 0,10 0,12 0,14
without bgb top middle bottom
st ra in e n er g y [m J]
bone graft block (bgb) position
implant augmentation compacta bone graft 0,00 0,05 0,10 0,15 0,20 0,25
without bgb top middle bottom
st ra in e n erg y [m J]
bone graft block (bgb) position
22 Figure 8
Figure 8. von Mises stress distribution [MPa] in compact bone due to load Py (protrusion), as seen from below;
left bonded contact M1_r and right friction contact M1f_r between the implant and compact bone.
Figure 9
(a): M1f model with masticatory force Fz applied (b): M1f model with protrusion Py applied
Figure 9. CDF plot of von Mises stress in 2 mm compact bone for the M1f model, with friction and different loads
applied.
top middle bottom reference model
bone graft position
top middle bottom reference model
23 Figure 10
Figure 10. Strain energy in the M1f model, with friction and Fz (masticatory force) applied.
Figure 11
Figure 11. Strain energy in the M1f model, with Py (protrusion) applied.
0,00 0,02 0,04 0,06 0,08 0,10 0,12 0,14
without bgb top middle bottom
st ra in e n erg y [m J]
bone graft block (bgb) position
implant augmentation compacta bone graft 0,00 0,05 0,10 0,15 0,20 0,25 0,30
without bgb top middle bottom
st ra in e n er g y [m J]
bone graft block (bgb) position
24 Figure 12
Figure 12. M1f_c model: von Mises stresses [MPa] in compact bone (left) and the bone graft (right), with Fz
(masticatory force) applied.
Figure 13
Figure 13.M1f_c model: von Mises stresses [MPa] in compact bone (left) and the bone graft (right), with Py