AUTHOR
PROOF
COPY
Not f
or
publica
tion
International Journal of Nanomedicine
Interaction between submicron COD crystals
and renal epithelial cells
Hua Peng1,2
Jian-Ming Ouyang1,2
Xiu-Qiong Yao1
Ru-E Yang1
1Department of Chemistry,
Jinan University, 2Institute of
Biomineralization and Lithiasis Research, Jinan University, Guangzhou, China
Correspondence: Jian-Ming Ouyang Department of Chemistry, Jinan University, Guangzhou 510632, China Tel +86-20-85223353
Email [email protected]
Objectives: This study aims to investigate the adhesion characteristics between submicron calcium oxalate dihydrate (COD) with a size of 150 ± 50 nm and African green monkey kidney epithelial cells (Vero cells) before and after damage, and to discuss the mechanism of kidney stone formation.
Methods: Vero cells were oxidatively injured by hydrogen peroxide to establish a model of injured cells. Scanning electron microscopy was used to observe Vero–COD adhesion. Inductively coupled plasma emission spectrometry was used to quantitatively measure the amount of adhered COD microcrystals. Nanoparticle size analyzer and laser scanning confo-cal microscopy were performed to measure the change in the zeta potential on the Vero cell surface and the change in osteopontin expression during the adhesion process, respectively. The level of cell injury was evaluated by measuring the changes in malonaldehyde content, and cell viability during the adhesion process.
Results: The adhesion capacity of Vero cells in the injury group to COD microcrystals was obviously stronger than that of Vero cells in the control group. After adhesion to COD, cell viability dropped, both malonaldehyde content and cell surface zeta potential increased, and the fluorescence intensity of osteopontin decreased because the osteopontin molecules were successfully covered by COD. Submicron COD further damaged the cells during the adhesion process, especially for Vero cells in the control group, leading to an elevated amount of attached microcrystals.
Conclusion: Submicron COD can further damage injured Vero cells during the adhesion process. The amount of attached microcrystals is proportional to the degree of cell damage. The increased amount of microcrystals that adhered to the injured epithelial cells plays an important role in the formation of early-stage kidney stones.
Keywords: cell modulation, crystal adhesion, calcium oxalate dihydrate, kidney stone, pathological mineralization
Introduction
Surgical treatment of kidney stones has made great progress. However, the incidence and recurrence rates of kidney stones are still high. The main component of kidney stones is calcium oxalate (CaOxa); its concentration in the urine of healthy people is four times higher than its solubility when no kidney stones are formed. Therefore, the supersaturation of urinary stone salts is a prerequisite, but not the only requirement,
for kidney stone formation.1,2
The time for urine to flow through the renal tubules can be calculated according to the tubular diameter and length as well as the flow rate of urine. Considering the growth speed
Dove
press
O R I G I N A L R E s E A R C H open access to scientific and medical research
Open Access Full Text Article
International Journal of Nanomedicine downloaded from https://www.dovepress.com/ by 118.70.13.36 on 23-Aug-2020
For personal use only.
Number of times this article has been viewed
This article was published in the following Dove Press journal: International Journal of Nanomedicine
of CaOxa in urine, free single microcrystals cannot grow into the size necessary to block the tubules within the short time of flowing through the tubules.3 Only the free urine microcrystals
that have been fixed onto the surface of renal tubular epithelial
cells can grow and form stones.4,5 Specifically, the adhesion
between urine microcrystals and renal tubular epithelial cells is a key process in kidney stone formation.
Renal tubular epithelial cell injury is an important
pre-requisite to promoting the adhesion of urine microcrystals.4,6
At the molecular and supramolecular levels, the structure of renal tubular epithelial cell membrane changes after injury caused by CaOxa microcrystals, high concentrations of oxalic acid, or other factors. For example, the negatively charged phosphatidylserine within the cell membrane will become valgus, and CD44 and hyaluronic acid will be expressed
on the cell surface.7–9 These changes provide effective sites
for the nucleation and growth of urine microcrystals, promote the formation of early microstones, and also enhance the adhesion between the cell membrane and urine microcrystals to accelerate the formation of kidney stones.
CaOxa monohydrate (COM) is the most
thermody-namically stable crystal form of CaOxa. However, Ca2+ and
Oxa2- often precipitate as CaOxa dihydrate (COD) in
super-saturated urine because of the stronger adhesion of COM with renal tubular epithelial cells, which poses more severe damage on cells. Therefore, the precipitation of relatively less harmful COD crystals in urine is a type of self-protection for organisms. This also reveals the existence of adhesion between COD microcrystals with renal tubular epithelial
cells in the human body.10
However, the current research on adhesion between renal tubular epithelial cells and crystals mainly focuses on micron
grade COM and COD crystals.6,11 Only a few studies about
nanocrystals in urine are available,12,13 and the interaction
between renal tubular epithelial cells and CaOxa crystals with a size of less than 200 nm has yet to be reported. In fact, numerous submicron microcrystals exist in urine, and these microcrystals are the basis for the formation of micron grade crystals. Therefore, this study investigated the
adhe-sion of COD microcrystals with a size of 150 ± 50 nm and
African green monkey renal epithelial cells (Vero cells) to understand further the molecular and cellular mechanism of kidney stone formation.
Materials and methods
Materials and apparatus
Vero cells were purchased from Shanghai Cell Bank, Chinese Academy of Sciences (donated by Professor Yi-Fei Wang
of Biomedical Research and Development Center of Jinan University, Guangzhou, China). Dulbecco’s modified Eagle medium: nutrient mixture F12 was from Thermo Scientific
HyClone (Logan, UT), and Gibco® newborn calf serum
was from Life Technologies (Carlsbad, CA). The primary antibody of osteopontin (OPN) and fluorescein isothiocyanate secondary antibody were from Santa Cruz Biotechnology (Santa Cruz, CA). Cell proliferation assay kit (Cell Counting Kit-8) was from Dojindo Laboratories (Kumamoto, Japan). The MDA kit was from Jiancheng Institute of Biotechnology (Nanjing, China). The Iwaki® cell culture plate was from
AGC Techno Glass (Chiba, Japan). All other reagents were of analytically pure grade.
The XL-30 environmental scanning electron microscope (SEM) was from Philips (Eindhoven, the Netherlands). The
nanoparticle size zeta potential analyzer (Zetasizer® Nano
ZS) was from Malvern Instruments Ltd (Malvern, United Kingdom). The laser confocal microscope (LSM; 510 META duo scan) was from Carl Zeiss AG (Oberkochen, Germany). The enzyme mark instrument Safire™ was from Tecan Group Ltd (Mannedorf, Switzerland). The Optima™ 2000 DV inductively coupled plasma emission spectrometer (ICP) was from PerkinElmer (Waltham, MA). Powder X-ray
diffraction (XRD) results were recorded on a D/max-γA
X-ray diffractometer (Rigaku Corporation, Tokyo, Japan)
using nickel-filtered copper Kα radiation (λ= 1.54 Å) and
a scanning rate of 2 degrees/minute at 40 kV, 30 mA. The divergence and scattering slit was 1 degree for the range of 5 degrees to 60 degrees 2θ. The IFS25 Fourier trans-form infrared spectrometer (FT-IR) was from Bruker SA
(Wissembourg, France). Scan range was 4000–400 cm-1
and the resolution was 0.5 cm-1. The morphology of CaOxa
was identified according to King et al,14 and COD was
compared with American Society for Testing and Materials card number 17-541. The centrifuge was from Eppendorf (5804 R, Germany).
Experimental methods
Preparation of submicron COD crystals and COD suspension
Submicron COD crystals were prepared through the complex precipitation method using nitrilotriacetic acid as complexant. That is, 0.3 mol/L calcium chloride was mixed with an equal amount of nitrilotriacetic acid, and then 0.3 mol/L potas-sium oxalate was added at 1 mL/minute with fast agitation at 75°C. After standing for 30 minutes, the precipitation was separated via centrifugation, washed twice with dis-tilled water, and vacuum dried. The characteristics of the
Dovepress
Peng et al
International Journal of Nanomedicine downloaded from https://www.dovepress.com/ by 118.70.13.36 on 23-Aug-2020
products were determined through SEM, XRD, and FT-IR. The average dimension of the COD microcrystals was
150 ± 50 nm. COD suspension was prepared using serum-free
medium with a final concentration of 100 µg/mL.
Vero cell culture, damage, and adhesion with COD microcrystals
The experiments were performed as described previously.15
The cell suspension was inoculated in suitable plates and incubated at 37°C for 24 hours, with 5% carbon dioxide and saturated humidity. After 24 hours, the media were changed to serum-free culture media and the cells were bated for 12 hours to achieve synchronization (the total incu-bation time was 36 hours). The cells were then divided into groups A and B. The cells in group A (control group) were exposed to serum-free culture medium only, whereas the cells in group B (injury group) were injured with 0.3 mmol/L hydrogen peroxide. Serum-free culture media containing
COD microcrystals (with 100 µg/mL concentration) were
added to the two groups. After 2, 6, 12, 18, and 24 hours of adhesion, cell viability was determined using the Cell Counting Kit-8 method. Malonaldehyde (MDA) content was measured with an MDA test kit. OPN expression on the cell surface was determined through the fluorescence quantita-tive method. The zeta potential of the COD crystals was determined using a nanoparticle size analyzer. Vero–COD adhesion was observed via SEM, and the amount of adhered COD microcrystals was quantitatively analyzed via ICP.
sEM observation and ICP detection of the adhered COD microcrystals
Cells (2 × 10⁵ cell/mL) were plated in twelve-well plates
(1 mL/well) with cover slips at the bottom. After cocultured with COD suspension for different culture times, the cover slips were removed, and the nonadherent crystals were washed away with D-Hank’s solution.
For SEM observation, the cells and crystals on the
cover slips were fixed with 2.5% glutaraldehyde at 4°C for
24 hours, dehydrated in an ethanol gradient (30%, 50%, 70%, 90%, and 100%), refixed with isoamyl acetate, dried under the critical point of carbon dioxide, and then treated with gold sputtering. Adhesion between cells and crystals was observed via SEM.
For ICP detection, the cover slips were taken out and placed in 25 mL beakers. Then, 10 mL nitric acid and 0.5 mL perchloric acid were added, and the samples were digested on an electric stove until a clear solution was formed. The samples were continuously heated until the perchloric acid
was boiling, smoking, and nearly dried. The residual heat of the electric stove was used to dry the samples, which were then allowed to cool down at room temperature. Thereafter 3 mL water was added to the beaker to dissolve the residue. The concentration of Ca2+ in the solution was measured
using the ICP method. The number of associated COD
microcrystals was calculated from the concentrations of Ca2+
ions, and the results were expressed in µg/cm2.
Zeta potential measurement
Vero cells (4 × 10⁵ cells/mL) were plated in six-well plates
(2 mL/well) and then cocultured with COD suspension for different times. Nonadherent crystals were washed away with D-Hank’s solution, and 0.25% trypsin containing 0.02% ethylenediaminetetraacetic acid digestion solution was added. The cells were blown well to form a single cell suspension and then centrifuged at 1000 rpm for 3 minutes. The supernatant was removed, and then the cells and crystals were resuspended
in 1000 µL D-Hank’s solution (pH 7.86). Approximately
800 µL suspension fluid was injected into the sample pool to
measure zeta potential using a nanoparticle analyzer.
Quantitative detection of OPN fluorescence
Vero cells were plated in six-well plates (4 × 10⁵ cell/mL,
2 mL/well) with cover slips at the bottom and then incubated with COD suspension for different times. OPN expression was observed via LSM with OPN primary antibody and fluorescein isothiocyanate secondary antibody as previously described.15
statistical method
The experimental results were analyzed statistically using
IBM® SPSS 16.0 software (SPSS Inc, Chicago, IL). The
dif-ference in means between the experimental groups and the control group were analyzed using Tukey’s test. The difference was significant if P, 0.05, extremely significant if P, 0.01,
and nonsignificant if P. 0.05. All experiments were performed
at least three times independently, except ICP detection.
Results and discussion
Characterization of COD microcrystals
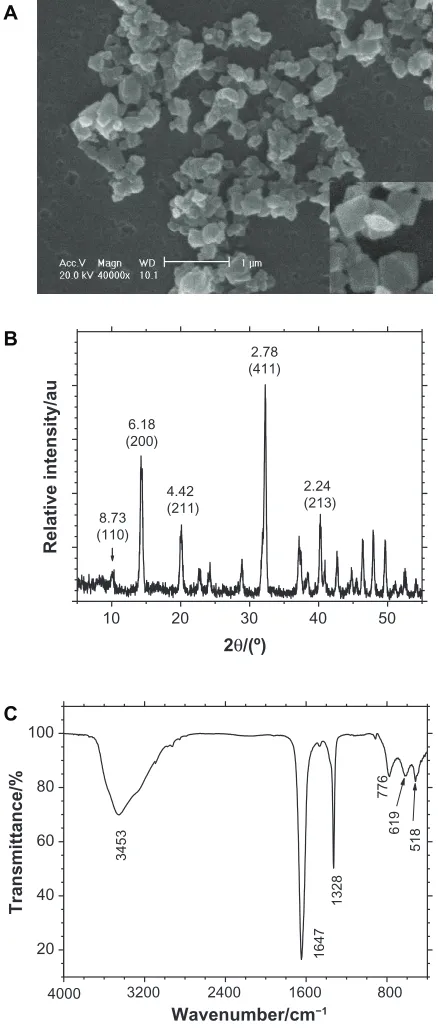
Figure 1A shows the SEM images of submicron COD crystals. Different from the micron-sized COD, some submicron COD did not display the typical morphology of double pyramids with four corners. The dimension of COD ranged from 100–200 nm with an average of approximately 150 nm.
The composition of the prepared crystals was confirmed through XRD and FT-IR. The XRD patterns (Figure 1B)
Dovepress submicron COD and renal epithelial cells
International Journal of Nanomedicine downloaded from https://www.dovepress.com/ by 118.70.13.36 on 23-Aug-2020
demonstrated that the crystals were COD crystals. The crystal plane spacings (d value) in the pattern were 0.873, 0.618, 0.442, 0.278, and 0.224 Å, which correspond to the (110),
(200), (211), (411), and (213) planes of COD, respectively.14
The FT-IR spectra (Figure 1C) of the crystals showed a strong
single absorption peak at 3453 cm-1, which was significantly
different from the multiple peaks of the COM crystals that
appeared within the 3000 cm-1 to 3600 cm-1 region with
multiple peaks.16 The asymmetrical stretching vibration
uas(COO-) of carbonyl appeared at 1647 cm-1, whereas
us(COO-) appeared at 1328 cm-1. Both peaks indicated the
presence of only COD crystals. That is, the XRD and FT-IR results proved that the prepared crystals were pure COD and without any COM.
Morphology change in Vero cells
before and after injury
Vero cells were injured by oxidative damage after being incubated with 0.3 mmol/L hydrogen peroxide for 1 hour, causing morphological changes. Most of the Vero cells in the control group exhibited a typical spindle shape with full intact morphology and microvilli (Figure 2A). However, the cells shrank after injury by hydrogen peroxide, with abscission of microvilli (Figure 3A). After the injury, the cell viability decreased from 100% (control group) to 70.5% (P, 0.05).
Junction complexes were not observed in the SEM illustrations. This result may be attributed to the follow-ing reasons. First, after a series of washfollow-ing, dehydration, and drying during the sample preparation process, the samples experienced cell loss and cell size reduction. Some tight junctions were also fractured. Second, to clarify the details on cell–crystal adhesion, some areas where the cells were relatively sparse were factitiously selected and then photographed. Third, endocytosis occurred as early as 30 minutes after exposure of the cells to the crystals.17 During
endocytosis, the formed cell–crystal complexes appeared to separate from the monolayer, and large gaps appeared at cell–cell contact regions.18
Changes in Vero cell viability during
crystal adhesion
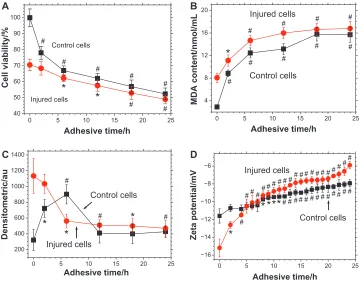
Figure 4A shows the changes in cell viability during the pro-cess of adhesion between Vero cells and submicron COD. As the adhesion time increased from 0 hours to 24 hours, Vero cell viability in the control group decreased from 100% to
52.4% (P, 0.01), whereas the viability of injured Vero cells
decreased from 70.5% to 49% (P, 0.01). This result indicated
that COD microcrystals caused further damage to the cells during the adhesion process, thus decreasing cell viability. Particularly, the viability of Vero cells in the control group decreased promptly during 0–6 hours, indicating that COD posed severe injury on Vero cells of the control group.
However, previous reports showed that COD micro-crystals only produce slight damage or no damage to cells
10 20 30 40 50
2.24 (213) 2.78 (411)
4.42 (211) 6.18 (200)
8.73 (110)
Relative intensity/au
2θ/(º)
4000 3200 2400 1600 800
20 40 60 80
100
(c)
Transmittance/%
3453
776
61
9
51
8
1328
1647
Wavenumber/cm−1
A
B
C
Figure 1 Morphology and composition analysis of ultrafine calcium oxalate dihydrate
microcrystals by (A) scanning electron microscopy (scale bar = 1 µm), (B) X-ray diffraction, and (C) Fourier transform infrared spectroscopy.
Dovepress
Peng et al
International Journal of Nanomedicine downloaded from https://www.dovepress.com/ by 118.70.13.36 on 23-Aug-2020
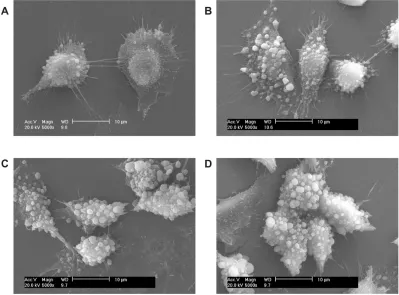
Figure 2 scanning electron microscope images (scale bar = 10 µm) after the adhesion of calcium oxalate dihydrate with African green monkey kidney epithelial cells in the control group at (A) 2 hours, (B) 6 hours, (C) 12 hours, and (D) 24 hours.
Figure 3 scanning electron microscope images (scale bar = 10 µm) after the adhesion of calcium oxalate dihydrate with African green monkey kidney epithelial cells in the injury group at (A) 2 hours, (B) 6 hours, (C) 12 hours, and (D) 24 hours.
Dovepress submicron COD and renal epithelial cells
International Journal of Nanomedicine downloaded from https://www.dovepress.com/ by 118.70.13.36 on 23-Aug-2020
0 5 10 15 20 25 40 50 60 70 80 90 100 A B C D # # # # # # #
*
*
Injured cells Control cells Cell viability/% Adhesive time/h0 5 10 15 20 25 200 400 600 800 1000 1200 1400
*
# # #*
*
Injured cells Control cells Densitometric/a u Adhesive time/h0 5 10 15 20 25 4 8 12 16 20 # # # # # # # # #
*
Injured cells Control cells MDA content/nmol/m L Adhesive time/h0 5 10 15 20 25 −16 −14 −12 −10 −8 −6 # # # # # # # # # # # # # # # # # # # # # # # # # # # # # # # # # #
*
*
*
*
*
Control cells Injured cells Zeta potential/m V Adhesive time/hFigure 4 Changes in (A) cell viability, (B) malonaldehyde content, (C) osteopontin expression, and (D) zeta potential during the adhesion process between calcium oxalate dihydrate microcrystals and African green monkey kidney epithelial cells in both the control and injury groups.
Notes: *P,0.05;#P, 0.01 compared with cells not exposed to calcium oxalate dihydrate microcrystals.
Abbreviations: h,hour; MDA, malonaldehyde.
and that COD could even promote cell proliferation.19,20
In these reports, the cell viability at 0 hours was selected as the blank value. Owing to the strong self-repair ability and self-proliferation capability of the cells (including control group and injury group), the cell viability value of self-proliferation was increased with increasing adhesion time. It became even larger than the reduced viability value caused by COD-induced cell damage. This phenomenon resulted in unexpected stronger cell viability after adhesion to COD for a set time, leading to the conclusion that “COD microcrys-tals could promote cell proliferation.”19,20 In fact, studies on
COM microcrystals also showed similar results.19,21
However, in this study, the blank values of cell viability were those after 24 hours of incubation without microcrystal addition. The experiments for different adhesion times (24, 18, 12, 6, and 2 hours) started at 0, 6, 12, 18, and 22 hours, respectively. At 24 hours, all adhesion experiments were ter-minated, and the cell viability of each group was determined simultaneously. With this design, the results could reflect the effect of COD microcrystals on cell viability because the effect of cell self-proliferation was largely eliminated.
The difference between the results of the current study and those of previous studies19,20 may be also ascribed to
other grounds. For example, different cell lines might behave differently when they interact with CaOxa crystals. In previ-ous studies, human kidney-2 cells and Madin–Darby canine kidney cells were used,19,20 whereas Vero cells were used in the
current study. Moreover, different sized CaOxa crystals were used. The average size of the crystals used in previous studies was more than 20 µm and 0.7 (0.4–2.0) µm, respectively,19,20
both of which were much larger than that of the submicron crystals used in the current study. Thus, the experimental results (Figure 4A) of the current study are entirely different
from the conclusions in previous reports.19,20
Change in MDA content during adhesion
of COD and Vero cells
The measurement of MDA content during adhesion further supported the conclusion that COD microcrystals could damage Vero cells. The results are shown in Figure 4B.
Before adhesion (ie, at 0 hours), the MDA content released by Vero cells in the control group was 2.91 nmol/mL, whereas it increased to 8.06 nmol/mL in the injury group (P, 0.01). Elevated MDA content is an obvious sign of cell oxidative damage.22,23 This result was consistent with
that of cell viability determination (Figure 4A), which was Dovepress
Peng et al
International Journal of Nanomedicine downloaded from https://www.dovepress.com/ by 118.70.13.36 on 23-Aug-2020
demonstrated via the evident injury effect of hydrogen peroxide on Vero cells.
For Vero cells in the injury group, the MDA content augmented constantly during adhesion to COD microcrystals, suggesting that submicron COD could continually produce new damage to cells.
For Vero cells in the control group, after adhesion to COD microcrystals for 2 hours, the MDA content increased rapidly
from 2.91 nmol/mL to 8.85 nmol/mL (P, 0.01). This finding
indicated that COD microcrystals caused noticeable damage to Vero cells in the control group. After 2 hours, the MDA content slowly rose, and the changing trend was similar to that in the injury group. These data revealed that after 2 hours, the adhesion process between COD and Vero cells in the control group was similar to that in the injury group.
During adhesion to COD microcrystals, the MDA con-tent in the injured Vero cells was generally higher than that in the control group. This result suggested that the injured Vero cells were damaged more severely and suffered from a stronger oxidative stimulation.
Quantitative detection of OPN
expression during the adhesion process
OPN is a phosphorylated glycoprotein with rich saliva acid
and a molecular weight of 60–80 kDa.24,25 OPN is one of the
important organic matrices in kidney stones. Both animal experiments and cell model experiments have shown that OPN
expression could promote the formation of kidney stones.24
The expression of OPN during the Vero–COD adhesion process was observed via LSM. The LSM images were the overall average results of the experiments in duplicate with three repetitions. The representative LSM images are shown in Figures 5 and 6, and the quantitative analysis results are shown in Figure 4C.
More OPN molecules were expressed by Vero cells in the injury group before adhesion (Figures 5A and 6A), with
a relative expression level of 1134 (P, 0.01), which was
much higher than 321, the relative OPN expression level of Vero cells in the control group.
Adhesion between Vero cells in the control group and COD microcrystals
As shown in Figure 5, the fluorescence intensity of OPN on the cell surface at 0–6 hours increased with adhesion time and
reached the maximum 902 (P, 0.01) at 6 hours. This finding
may be attributed to the high level of COD-induced injury at the beginning of adhesion that led to the elevated expression of OPN molecules on Vero cells and enhanced fluorescence intensity.
This result was consistent with that of cell viability (Figure 4A) and MDA measurements (Figure 4B).
At 6–24 hours, the fluorescence intensity of OPN decreased (Figure 4C) because the OPN molecules enriched on the Vero cell surface adhered to COD, resulting in the
Figure 5 Laser scanning confocal microscope images (630×) showing fluorescent
changes in osteopontin on African green monkey kidney epithelial cells after the adhesion of calcium oxalate dihydrate with the epithelial cells in the control group at (A) 0 hours, (B) 6 hours, (C) 12 hours, and (D) 24 hours.
Note: Thenucleus is blue, and the expressed osteopontin is green.
Figure 6 Laser scanning confocal microscope images (×630) showing fluorescent
changes of osteopontin on African green monkey kidney epithelial cells after the adhesion of calcium oxalate dihydrate with the epithelial cells in the injury group at (A) 0 hours, (B) 6 hours, (C) 12 hours, and (D) 24 hours.
Note: Thenucleus is blue, and the expressed osteopontin is green.
Dovepress submicron COD and renal epithelial cells
International Journal of Nanomedicine downloaded from https://www.dovepress.com/ by 118.70.13.36 on 23-Aug-2020
reduced binding of OPN molecules to the fluorescent antibody and thus weakening OPN fluorescence intensity.
Adhesion between Vero cells in the injury group and COD microcrystals
As shown in Figure 6, at 0–6 hours, the fluorescence intensity of OPN on the cell surface gradually weakened and reached
602 (P, 0.05) at 6 hours, which was completely opposite to
the changing trend in the control group. The reason for this finding was that the highly expressed OPN molecules by the injured cells had very strong adhesion ability and could fully adhere with COD in a relatively short time (6 hours) to a state of saturated adhesion. When OPN molecules were adhered by COD, the exposed OPN molecules that could bind to the fluorescent antibody would decrease, causing weakened fluorescence. The reduction in OPN production was also
caused by cell death, which could not perform properly.26 The
apoptosis and necrosis rates of the injured cells were con-firmed to be 4.6% and 1.4%, respectively. These data were all
higher than those of the control cells (2.8% and 1.31%).27
The results of cell viability, MDA content, and OPN expression level showed that submicron COD can severely damage Vero cells during the first 6 hours of adhesion process. This finding is inconsistent with previous reports.19–21
Exposure of renal epithelial cells to CaOxa crystals increases the synthesis of monocyte chemoattractant protein-1 and prostaglandin, both of which are known to participate in
inflammatory processes.28 Therefore, aside from the
afore-mentioned selection of different blank values, this inconsis-tency can also be attributed to the strong endocytosic ability
of Vero cells to submicron COD (150 ± 50 nm) that can
easily induce the inflammation response. As the adhesion time prolonged, the submicron COD gradually gathered into micron-level crystals (Figures 2 and 3), thereby reducing their cell damage effects.
Change in zeta potential on the cell
surface during adhesion of COD
microcrystals
Zeta potential is a key parameter for cell–cell and cell–external particle interactions. The degree of interac-tion between cells and external particles can be determined
through zeta potential measurement.29,30 However, only a few
studies investigated the interaction between cells and CaOxa
using zeta potential measurement.15
Figure 4D shows the zeta potential change in cell surface during the adhesion process of Vero cells and COD microcrystals. Before adhesion (ie, at 0 hours), the zeta
potential of Vero cells in the control and injury groups
was -11.6 mV and -15.2 mV (P , 0.01), respectively.
This finding might be attributed to two reasons. First, the concentrations of negatively charged molecules such as phos-phatidylserine, OPN, and hyaluronic acid on the cell surface increased after injury. Second, after oxidative damage, some unsaturated fatty acids on the cell membrane were oxidized to derivatives with hydroxyl and carboxyl groups, increasing the negative charge density on the cell surface. Hence, the charge of zeta potential on the injured cell surface was more negative than that in the control group.
For Vero cells of both the control and injury groups, the cell surface zeta potential showed an ascendant trend during the whole process of crystal adhesion. This finding indicated that the quantity of COD microcrystals that adhered to the cell surface is positively correlated with adhesion time. The more COD microcrystals that adhered to the cell surface, the higher the quantity of the covered negatively charged molecules (such as the OPN molecules shown in Figures 5 and 6) and the lower the density of negative charge on the cell surface. Therefore, zeta potential would be higher.
The increase in zeta potential on Vero cells in the injury group was faster than that in the control group, especially at 0–6 hours. This finding indicated the faster binding speed between COD and injured Vero cells and the larger adhered quantity of COD microcrystals on injured Vero cells. Particularly, during the first 6 hours of adhesion, the adhered quantity of COD microcrystals on injured Vero cells was significantly higher than that on Vero cells in the control group, which was consistent with the results of SEM observation (Figures 2 and 3).
sEM observation of Vero–COD adhesion
The adhesion of COD microcrystals on Vero cells of both the control and injury groups was observed via SEM. The results are shown in Figures 2 and 3.
Adhesion between Vero cells in the control group and COD
At 2–6 hours, only a small amount of COD microcrystals adhered to the cell surface (Figure 2A and B). In addition, a slight change in cell shape was observed, although the spindle shape was retained. This finding indicated that the adhesion ability between COD microcrystals and Vero cells in the control group was very weak.
However, at 12 hours (Figure 2C) and 24 hours (Figure 2D), the adhesion quantity of COD microcrystals significantly increased, and the cells began to shrink.
Dovepress
Peng et al
International Journal of Nanomedicine downloaded from https://www.dovepress.com/ by 118.70.13.36 on 23-Aug-2020
Adhesion between Vero cells in the injury group and COD
The adhesion ability between Vero cells in the injury group and COD microcrystals was obviously stronger than that in the control group. With increasing adhesion time, the adhesion quantity increased rapidly (Figure 3). Particularly, at 12 hours (Figure 3C) and 24 hours (Figure 3D), numer-ous COD microcrystals adhered to the surface of injured Vero cells.
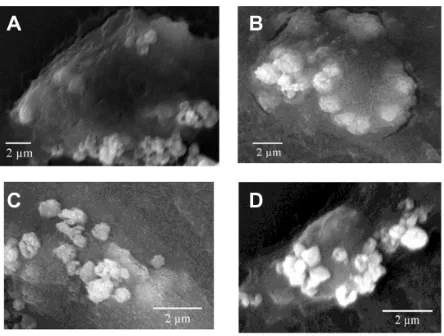
COD crystal endocytosis by Vero cells in the control and injury groups
Figure 7 showed the SEM images of the COD crystals endocytosed by Vero cells in the control and injury groups after adhesion for different times. The results showed that normal Vero cells had stronger phagocytotic ability. However, the ability of the injured Vero cells to adhere microcrystals enhanced. Moreover, their ability to uptake microcrystals weakened.
The injury of renal tubular epithelial cells could enhance the adhesion of renal tubular epithelial cells with urine micro-crystals.31 However, renal tubular epithelial cells did not
pas-sively accept the injury. Renal tubular epithelial cells could internalize some of the adhered crystals. Once inside a cell, the crystals would no longer be exposed to supersaturated tubular fluid or serve as a potential site for crystal aggrega-tion, which was viewed as a separate defense against stone
formation.32,33 Lieske et al demonstrated through SEM and
TEM that after COM crystals adhered to the microvilli on the apical surface of BSC-1 cells (an epithelial cell line of African green monkey kidney origin), endocytosis occurred
as early as 30 minutes after exposure of cells to crystals.17
Many studies showed that cell injury could be triggered by crystal endocytosis.17,18,34 COM crystals could be actively
endocytosed individually or as aggregates by Madin–Darby
canine kidney cells.22 The crystals were intermingled with
microvilli and cilia at the surface, and adjacent cells were structurally altered.
Quantitative analysis of the amount
of adhered COD microcrystals
The amount of COD microcrystals that adhered to the cell surface at different adhesive time points was measured by ICP (Figure 8). The microcrystal amount adhered to the injury group was significantly higher than that adhered to the control group. Especially after 12 hours, the gap further increased. Moreover, the amount of COD micro-crystals adhered to the control group slowly increased with
the adhesive time, while the amount of COD microcrystals adhered to the injury group rapidly increased with time.
Comparison of MDA content, OPN expression, and adhered microcrystal amount on SEM images and by ICP results during the adhesion process between COD and Vero cells in the control group showed that at the early stage of adhesion (2–6 hours), the MDA content (Figure 4B) and OPN expression (Figure 4C) increased rapidly. By contrast, the adhesion quantity of COD on the Vero cell surface increased significantly only after 12 hours (Figures 2C, D, and 8). The reason for this result is that the cells in the control group were injured apparently after 6 hours of interaction with COD microcrystals, leading to elevated MDA content and OPN molecule expression. However, the adhesion between COD and Vero cells was a process from quantitative to
Figure 7 scanning electron microscope images (scale bar = 2 µm) of the calcium oxalate dihydrate crystals endocytosed by African green monkey kidney epithelial cells in the (A and B) control group and (C and D) injury group after adhesion at (A and C) 6 hours and (B and D) 24 hours.
0 4 8 12 16 20 24
20 40 60 80
Injured cells
Control cells
Crystals adherence
/
µ
g/cm
2
Adhesive time/h
Figure 8 The amount of calcium oxalate dihydrate microcrystals that adhered on the cell surface at different adhesive times.
Abbreviation: h,hour.
Dovepress submicron COD and renal epithelial cells
International Journal of Nanomedicine downloaded from https://www.dovepress.com/ by 118.70.13.36 on 23-Aug-2020
qualitative change. After the cells were injured, adhesive molecules (such as OPN and phosphatidylserine) were expressed. However, these decentralized OPN and phos-phatidylserine molecules on the cell surface were not easily adhered to the COD microcrystals. Only when these nega-tively charged molecules gather together and form a negative charge region with high density could they effectively bind
COD crystals.25 Meanwhile, the increase in adhesion
quan-tity was delayed because these molecules took some time to gather together.
The expression of OPN and other negatively charged mol-ecules was an important reason for the enhancement of the adhesion ability for injured Vero cells. The molecular chain of OPN contained an aspartic acid-rich region, called poly-Asp86-93 domain. Chien et al reported that poly-poly-Asp86-93 domain was the center for the interaction of OPN molecule
and COD crystals.35 Poly-Asp86-93 peptides with high charge
density were linear and unstructured in solution, and their functional side chain had no particular direction. However, poly-Asp86-93 peptides might adhere to the crystal surface with various conformations after they were adsorbed on the
(110) face, a Ca2+-rich crystal plane of COD crystals. This
adhesion was mainly mediated through the strong electro-static combination between four or five carboxyls in aspartic acid and Ca2+ ions on the crystal surface. Their lattice
match-ing degree was also very high.
In the urine of normal individuals without urolithiasis, the adhesion capacity of the cell surface to COD microcrystals was very weak because their tubular epithelial cells were not injured. However, the tubular epithelial cells of patients suffering from kidney stones were often injured. As a result, the adhesion between microcrystals and injured cells was greatly enhanced. The adhered crystals would produce further damage to tubular epithelial cells, thus increasing the risk of kidney stone formation.
Conclusion
The adhesion ability between submicron COD with a size
of 150 ± 50 nm and Vero cells in the injury group was
sig-nificantly stronger than that between COD and Vero cells in the control group, especially in the first 6 hours. As a result, the amount of COD microcrystals that adhered to the cell surface obviously increased, the zeta potential was elevated, and the fluorescence intensity was decreased because OPN molecules were covered by COD and dying cells could not perform properly. During the adhesion process, COD microcrystals could produce further injury to both the control and injured Vero cells. As a result, the amount of
COD microcrystals that adhered to the injured epithelial cells increased, which was important in the formation of early-stage kidney stones. The results of the current study demonstrate an effective way to take intervening measures to prevent or alleviate renal tubular cell damage for the preven-tion of early kidney stone formapreven-tion.
Acknowledgments
This work was supported by the National Natural Science Foundation of China (20971057).
Disclosure
The authors report no conflicts of interest in this work.
References
1. Al-Atar U, Bokov AA, Marshall D, et al. Mechanism of calcium oxalate
monohydrate kidney stones formation: layered spherulitic growth. Chem
Mater. 2010;22(4):1318–1329.
2. Daudon M, Jungers P. Clinical value of crystalluria and quantitative
morphoconstitutional analysis of urinary calculi. Nephron Physiol.
2004;98(2):31–36.
3. Robertson WG. Kidney models of calcium oxalate stone formation.
Nephron Physiol. 2004;98(2):21–30.
4. Tsujihata M. Mechanism of calcium oxalate renal stone formation and
renal tubular cell injury. Int J Urol. 2008;15(2):115–120.
5. Yu SL, Gan XG, Huang JM, et al. Oxalate impairs aminophospholipid translocase activity in renal epithelial cells via oxidative stress: implications
for calcium oxalate urolithiasis. J Urol. 2011;186(3):1114–1120.
6. Khaskhali MH, Byer KJ, Khan SR. The effect of calcium on calcium
oxalate monohydrate crystal-induced renal epithelial injury. Urol Res.
2009;37(1):1–6.
7. Asselman M, Verhulst A, De Broe ME, Verkoelen CF. Calcium oxalate crystal adherence to hyaluronan-, osteopontin-, and CD44-expressing
injured/regenerating tubular epithelial cells in rat kidneys. J Am Soc
Nephrol. 2003;14(12):3155–3166.
8. Kocak B, Orug T, Turhan N, Ozcay N, Gonenc F. CD44
expres-sion in renal ischemia-reperfuexpres-sion injury in rats. Int Urol Nephrol.
2009;41(4):791–794.
9. Borges FT, Michelacci YM, Aguiar JA, Dalboni MA, Garofalo AS, Schor N. Characterization of glycosaminoglycans in tubular epithelial
cells: calcium oxalate and oxalate ions effects. Kidney Int. 2005;68(4):
1630–1642.
10. Grohe B, O’Young J, Ionescu DA, et al. Control of calcium oxalate crystal growth by face-specific adsorption of an osteopontin
phosphopeptide. J Am Chem Soc. 2007;129(48):14946–14951.
11. Wang T, Thurgood LA, Grover PK, Ryall RL. A comparison of the binding of urinary calcium oxalate monohydrate and dihydrate crystals
to human kidney cells in urine. BJU Int. 2010;106(11):1768–1774.
12. He JY, Deng SP, Ouyang JM. Morphology, particle size distribution, aggregation, and crystal phase of nanocrystallites in the urine of
healthy persons and lithogenic patients. IEEE Trans Nanobioscience.
2010;9(2):156–163.
13. Gui BS, Huang ZJ, Xu XJ, Li MR, He JY, Ouyang JM. Measurement of urine crystallites and its influencing factors by nanoparticle size
analyzer. J Nanosci Nanotechnol. 2010;10(8):5232–5241.
14. King M, McClure WF, Andrews LC, et al. Powder Diffraction File
Alphabetical Index:Inorganic Phases. Swarthmore, PA: International
Centre for Diffraction Data; 1992.
15. Ouyang JM, Yao XQ, Tan J, Wang FX. Renal epithelial cell injury and
its promoting role in formation of calcium oxalate monohydrate. J Biol
Inorg Chem. 2011;16(3):405–416.
Dovepress
Peng et al
International Journal of Nanomedicine downloaded from https://www.dovepress.com/ by 118.70.13.36 on 23-Aug-2020
International Journal of Nanomedicine
Publish your work in this journal
Submit your manuscript here: http://www.dovepress.com/international-journal-of-nanomedicine-journal
The International Journal of Nanomedicine is an international, peer-reviewed journal focusing on the application of nanotechnology in diagnostics, therapeutics, and drug delivery systems throughout the biomedical field. This journal is indexed on PubMed Central, MedLine, CAS, SciSearch®, Current Contents®/Clinical Medicine,
Journal Citation Reports/Science Edition, EMBase, Scopus and the Elsevier Bibliographic databases. The manuscript management system is completely online and includes a very quick and fair peer-review system, which is all easy to use. Visit http://www.dovepress.com/ testimonials.php to read real quotes from published authors. 16. Yao XQ, Ouyang JM, Peng H, Zhu WY, Chen HQ. Inhibition on calcium
oxalate crystallization and repair on injured renal epithelial cells of
degraded soybean polysaccharide. Carbohydr Polym. June 5, 2012..
[Epub ahead of print.]
17. Lieske JC, Deganello S, Toback FG. Cell–crystal interactions and
kidney stone formation. Nephron. 1999;81(Suppl 1):8–17.
18. Hackett RL, Shevock PN, Khan SR. Madin–Darby canine kidney cells
are injured by exposure to oxalate and to calcium oxalate crystals. Urol
Res. 1994;22(4):197–203.
19. Yuen JW, Gohel MD, Poon NW, Shum DK, Tam PC, Au DW. The initial and subsequent inflammatory events during calcium oxalate
lithiasis. Clin Chim Acta. 2010;411(15–16):1018–1026.
20. Kohjimoto Y, Ebisuno S, Tamura M, Ohkawa T. Interactions between calcium oxalate monohydrate crystals and Madin–Darby canine
kid-ney cells: endocytosis and cell proliferation. Urol Res. 1996;24(4):
193–199.
21. Pedraza CE, Chien YC, McKee MD. Calcium oxalate crystals in fetal bovine serum: implications for cell culture, phagocytosis and
biomin-eralization studies in vitro. J Cell Biochem. 2008;103(5):1379–1393.
22. Huang HS, Ma MC, Chen CF, Chen J. Lipid peroxidation and its cor-relations with urinary levels of oxalate, citric acid, and osteopontin
in patients with renal calcium oxalate stones. Urology. 2003;62(6):
1123–1128.
23. Tungsanga K, Sriboonlue P, Futrakul P, Yachantha C, Tosukhowong P. Renal tubular cell damage and oxidative stress in renal stone patients
and the effect of potassium citrate treatment. Urol Res. 2005;33(1):
65–69.
24. Wesson JA, Johnson RJ, Mazzali M, et al. Osteopontin is a critical inhibitor of calcium oxalate crystal formation and retention in renal
tubules. J Am Soc Nephrol. 2003;14(1):139–147.
25. Evan AP, Bledsoe SB, Smith SB, Bushinsky DA. Calcium oxalate crystal localization and osteopontin immunostaining in genetic hypercalciuric
stone-forming rats. Kidney Int. 2004;65(1):154–161.
26. Shin YJ, Kim HL, Park JM, et al. Overlapping distribution of osteo-pontin and calcium in the ischemic core of rat brain after transient focal
ischemia. J Neurotrauma. 2012;29(7):1530–1538.
27. Zhang S, Su ZX, Yao XQ, Peng H, Deng SP, Ouyang JM. Mediation of calcium oxalate crystal growth on human kidney epithelial cells with
different degrees of injury. Mater Sci Eng C Mater Biol Appl. 2012;
32(4):840–847.
28. Escobar C, Byer KJ, Khaskheli H, Khan SR. Apatite induced renal
epithelial injury: insight into the pathogenesis of kidney stones. J Urol.
2008;180(1):379–387.
29. Zhang Y, Yang M, Portney NG, et al. Zeta potential: a surface electrical characteristic to probe the interaction of nanoparticles with normal
and cancer human breast epithelial cells. Biomed Microdevices. 2008;
10(2):321–328.
30. Lin DQ, Zhong LN, Yao SJ. Zeta potential as a diagnostic tool to evalu-ate the biomass electrostatic adhesion during ion-exchange expanded
bed application. Biotechnol Bioeng. 2006;95(1):185–191.
31. Farell G, Huang E, Kim SY, Horstkorte R, Lieske JC. Modulation of proliferating renal epithelial cell affinity for calcium oxalate
monohy-drate crystals. J Am Soc Nephrol. 2004;15(12):3052–3062.
32. Lieske JC, Walsh-Reitz MM, Toback FG. Calcium oxalate monohydrate crystals are endocytosed by renal epithelial cells and induce proliferation.
Am J Physiol. 1992;262(4 Pt 2):F622–F630.
33. Lieske JC, Swift H, Martin T, Patterson B, Toback FG. Renal epithelial cells rapidly bind and internalize calcium oxalate monohydrate crystals.
Proc Natl Acad Sci U S A. 1994;91(15):6987–6991.
34. Ebisuno S, Kohjimoto Y, Tamura M, Inagaki T, Ohkawa T. Histological observations of the adhesion and endocytosis of calcium oxalate
crystals in MDCK cells and in rat and human kidney. Urol Int.
1997;58(4):227–331.
35. Chien YC, Masica DL, Gray JJ, Nguyen S, Vali H, McKee MD. Modulation of calcium oxalate dihydrate growth by selective crystal-face binding of phosphorylated osteopontin and polyaspartate peptide
showing occlusion by sectoral (compositional) zoning. J Biol Chem.
2009;284(35):23491–23501.
Dovepress
Dove
press
submicron COD and renal epithelial cells
International Journal of Nanomedicine downloaded from https://www.dovepress.com/ by 118.70.13.36 on 23-Aug-2020