Review Articles
A Survey of Graph Based Complex Brain Network Analysis
Using Functional and Diffusional MRI
1Md Rafiqul Islam, 1Xiaoxia Yin, 2Anwaar Ulhaq, 1
Yanchun Zhang, 1Hua Wang, 3Noreen Anjum and 4Tomas Kron 1
Centre for Applied Informatics (CAI), Victoria University, Melbourne, Australia
2
College of Engineering and Science, Victoria University, Melbourne, Australia
3
Preston University, Islamabad, Pakistan
4
Peter Maccallum Cancer Centre, Melbourne, Australia
Article history Received: 06-11-2017 Revised: 22-12-2017 Accepted: 30-12-2017
Corresponding Author: Md Rafiqul Islam
Centre for Applied Informatics (CAI), Victoria University, Melbourne, Australia Tel: +610470689925
Email: [email protected]
Abstract: The brain network is the function of a structurally and
functionally organized complex system. Its structure and activity analysis is one of the most significant challenges. The graph based techniques of brain complex networks have been successfully used in various types of image and medical data analysis. In this survey paper, we focus on a comprehensive study of the analytical methods for complex brain network based on graph theory. This review paper is intended to provide automated brain disease diagnosis based on functional and diffusional MRI modalities. Furthermore, we discuss subjective and objective quality evaluations of complex brain networks, important tools for automated brain disease diagnosis, challenging issues and future research directions in this increasingly evolving research field.
Keywords: Functional MRI, Diffusion MRI, Graph Theory, Complex
Network, Modality
Introduction
Our brain is a function of complex networks because its function is connected within different neural networks and brain regions. Almost everything we think, say and do is controlled by our brain, so when our brain is damaged, it is possibility to affect every aspect of our life (Bullmore and Sporns, 2012).
In the field of mathematics, graph theory is a major area to model relations between objects and to represent a connected network structure. Researchers are using graph theory to quantify aspects such as similarity, hierarchy and network efficiency of complex network structure in many other fields. Recently neuroscience researchers are proposed to use graph theory analysis to identify topological properties of complex brain network structure (Thirion et al., 2006; Bullmore and Sporns,
2009). A few years back, Grady and Polimeni (2010) published a book related to discrete calculus on graphs and described discrete calculus, matrix algebra briefly. In recent years, various researchers suggested that the combination of discrete calculus, matrix algebra on graph provides the extremely powerful computational toolbox for the analysis of human brain functions and structure. However, the ability to perform these
computations on graphs was not possible even in recent history of the field.
Over the last decade, researchers have tried to improve their understanding of the functionality of human brain and machine diagnosis of mental illness. A large number of technique have been applied to learn about complex brain system and these techniques were intended to aid diagnosis and assessment of the extent of brain damage. Though hese techniques are able to detect damage to the brain, they are unable to provide the clear image in some circumstances. They have not the capacity to cover the entire brain rather provide a limited coverage of its parts. However, in the field of medical science especially in brain diagnosis research, there are various prominent techniques which have been studied and investigated to present promising diagnosis result. Functional and Diffusional magnetic resonance imaging are non-invasive techniques. These (fMRI and DMRI) advanced techniques have been used to investigate physiological disturbances and now developing leads to manifest psychiatric illness.
detection with an exact application on complex brain network. In this review, we do not consider any specific brain disorders. Rather, we aimed to identify the prominent techniques which have been applied to analyse complex brain networks based on the graph theory However, we found that many relevant tasks were mostly published in the area of neuroscience that we have focussed below. Therefore, we have elected to limit the scope of our review that can be focussed in future of neuroscience research.
The paper is organized as follows: Section 2 presents the review of related works and contributions, while the analysis of graph based complex brain network is discussed in section 3. We focus on Functional MRI as well as Diffusional MRI techniques in section 4. Finally, the guidance of future research directions and conclusion is provided in section 5.
Literature Review
Van der Horn et al. (2017) Illustrated on mild
Traumatic Brain Injury (mTBI) that is one of the most widespread disorders in neuroscience. They found that although the complaints of post-traumatic injury are reported frequently, a consistent solution has not yet been found. To gain a comprehensive understanding, they used graph theory analysis of complex interactions between complaints, functional brain networks, depression and anxiety in the sub-acute phase after mTBI. Several recent studies present a review of advances in neuroscience focusing on the graph based research on exact areas of brain connectivity. Del Etoile and Adeli (2017) presented a detailed outline of brain connectivity and graph theory analysis as a great solutions of Alzheimer’s disease. McColgan et al. (2017)
proposed that functional and structural brain network correlates as a possible solutions of Huntington's disease. Using resting state fMRI data they examined how different functional and structural brain networks chronicle to depressive affection in premanifest HD and advantageous controls and finally got significant results. Hart et al. (2016) discussed about human brain as the
most powerful complex system and recently this idea of complex brain networks with graph theory has entered a new era in neuroscience. Using resting state fMRI they provided new ideas in brain mapping with graph applied to neurosurgery especially to traumatic brain injury.
Bullmore and Sporns (2009) reviewed and told that recent development of graph theory analysis has changed the dimension of complex brain network research. To achieve a complete understanding of complex brain network, they provided important information of measuring the brain network organization using functional MRI, structural MRI, diffusion MRI, EEG, MEG. Chen and Glover (2015) described functional MRI shown great direction to understand cognition in
both healthy and dysfunctional brain. (Hart et al.,
2016) used functional MRI with BOLD contrast imaging to generate better-recorded images. Bullmore and Sporns (2009) explained the quantitative analysis of complex networks using graph theory to improve the patterns of human brain complex networks.
Fox and Raichle (2007) believed that resting-state BOLD fMRI studies accept broadly acclimated functional connectivity to explore the alignment of functional networks. It can accomplish admitting indirect, strong, inferences about the functional access. Song et al. (2008; van den Heuvel et al., 2009; Zhou et al.,
2007) examined that Many exploratory readings have inspected the record between the structures of the brain network from the point of appearance of graph theory and multiplicities of behavioural phenotypes in health and disease, including calibration scores, affliction continuance and genotypic variations (Liu et al., 2010;
Glahn et al., 2010). Iannetti and Wise (2007; Honey et al.,
2009) discussed that the functional connectivity from diffusion MRI will provide good complements for modelling functional networks. Moreover, they believed that although resting-state functional connectivity is mutable and is frequently present between regions without direct structural links, its strength, spatial statistics and tenacity are nevertheless controlled by the large-scale functional structure of the human cerebral cortex.
The major contributions of our survey paper are as follows, we aim to familiarize graph based study of complex brain network. We describe brain as a complex network and graph based methods can be applied to extract the features. In addition, we discuss many of the relevant works on graph based complex brain network that has been used to "real-world" scenarios for brain disorders. Finally, with these ideas established we then explain the contributions of functional and Diffusion MRI with brain connectivity. We discuss how these technologies can help ameliorate the future guidance of complex brain network research.
Complex Brain Network Analysis
Brain network consists of a number of elements including nodes and edges that are mutually interconnected to each other (Kabbara et al., 2016a). These systems are not
monitored centrally rather it presents collective dynamics with self-organization (Fig. 1). Overall, a network is any system with sub-units that are linked into a whole.
For example, in social relationships, individual people indicates as nodes and it expresses as V and the joint relations between two nodes are indicating whether the corresponding peoples are accompanied or not. It's artlessly accurate as a bend as E. The groups of nodes
and edges indicate together as a graph: G = (V, E)
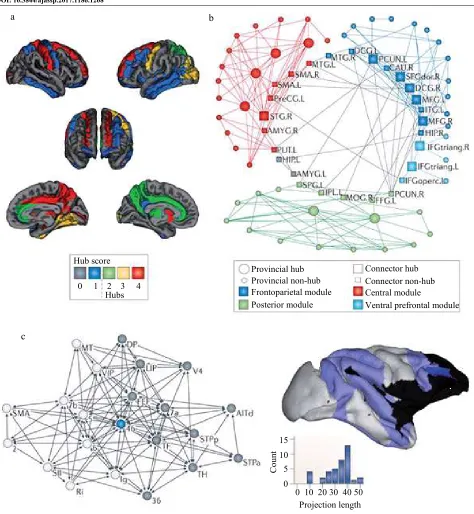
Fig. 1: Complex brain network: Hubs and modules in the brain. Image courtesy of Bullmore and Sporns (2012)
The human brain is organized into complex system allowing within individual components by structurally and functionally. But compassionate its structure and action one of the absolute accurate challenges in neuroscience. To overcome the challenges in neuroscience, many techniques have developed and already applied to make sense of the bewildering complexity of this most mysterious structure.
From past decade, many researchers tried to find the patterns of structural and functional connectivity of brain network by accumulation an array of different imaging technologies like EEG, MEG and structural, functional, Diffusion MRI with adult analytic strategies such as vivo imaging, activating causal modelling, fractional atomic squares and structural graph modelling (Table 1) (Bullmore and Sporns, 2012).
a b
c
Hub score
0 1 2 3 4 Hubs
Provincial hub Provincial non-hub Frontoparietal module Posterior module
Connector hub Connector non-hub Central module
Ventral prefrontal module
15 10 5 0
C
ou
nt
0 10 20 30 40 50 Projection length
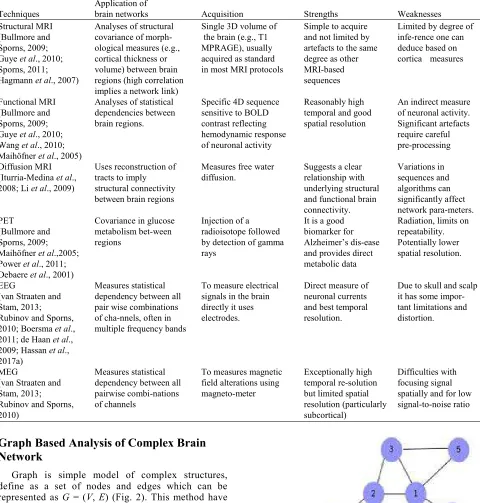
Table 1: Reviews of different automated disease diagnosis techniques applied to implement complex brain network analysis Application of
Techniques brain networks Acquisition Strengths Weaknesses Structural MRI Analyses of structural Single 3D volume of Simple to acquire Limited by degree of (Bullmore and covariance of morph- the brain (e.g., T1 and not limited by infe-rence one can Sporns, 2009; ological measures (e.g., MPRAGE), usually artefacts to the same deduce based on Guye et al., 2010; cortical thickness or acquired as standard degree as other cortica measures Sporns, 2011; volume) between brain in most MRI protocols MRI-based
Hagmann et al., 2007) regions (high correlation sequences implies a network link)
Functional MRI Analyses of statistical Specific 4D sequence Reasonably high An indirect measure (Bullmore and dependencies between sensitive to BOLD temporal and good of neuronal activity. Sporns, 2009; brain regions. contrast reflecting spatial resolution Significant artefacts
Guye et al., 2010; hemodynamic response require careful
Wang et al., 2010; of neuronal activity pre-processing
Maihöfner et al., 2005)
Diffusion MRI Uses reconstruction of Measures free water Suggests a clear Variations in (Iturria-Medina et al., tracts to imply diffusion. relationship with sequences and 2008; Li et al., 2009) structural connectivity underlying structural algorithms can
between brain regions and functional brain significantly affect connectivity. network para-meters. PET Covariance in glucose Injection of a It is a good Radiation, limits on (Bullmore and metabolism bet-ween radioisotope followed biomarker for repeatability. Sporns, 2009; regions by detection of gamma Alzheimer’s dis-ease Potentially lower Maihöfner et al.,2005; rays and provides direct spatial resolution.
Power et al., 2011; metabolic data
Debaere et al., 2001)
EEG Measures statistical To measure electrical Direct measure of Due to skull and scalp (van Straaten and dependency between all signals in the brain neuronal currents it has some impor- Stam, 2013; pair wise combinations directly it uses and best temporal tant limitations and Rubinov and Sporns, of cha-nnels, often in electrodes. resolution. distortion. 2010; Boersma et al., multiple frequency bands
2011; de Haan et al., 2009; Hassan et al., 2017a)
MEG Measures statistical To measures magnetic Exceptionally high Difficulties with (van Straaten and dependency between all field alterations using temporal re-solution focusing signal Stam, 2013; pairwise combi-nations magneto-meter but limited spatial spatially and for low Rubinov and Sporns, of channels resolution (particularly signal-to-noise ratio
2010) subcortical)
Graph Based Analysis of Complex Brain
Network
Graph is simple model of complex structures, define as a set of nodes and edges which can be represented as G = (V, E) (Fig. 2). This method have
become a great tool in the field of technological, biological and amusing sciences such as the science of ecological networks, the World Wide Web, amusing networks and neuroscience. Onias et al. (2014)
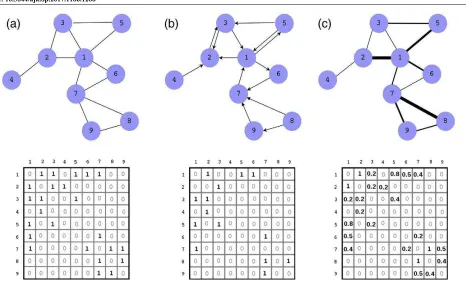
described that a network is a way to code a set of elements together with their connections. The elements are identified as nodes and their connections are identified as edges. When two nodes are connected by an edges, they are considered neighbours. In addition, edges can be categorized as
directed , undirected and weighted (Fig. 3 and Fig. 4). Fig. 2: Graphical representation of graph
Node
Fig. 3: Examples of (a) undirected, (b) directed and (c) weighted networks (top row) and their corresponding adjacency matrices, coded with a gray-scale colour map (bottom row). Image courtesy of (Onias et al., 2014)
Fig. 4: Examples of complex brain network based on graph. Image courtesy of (Boccaletti et al., 2006; Fallani et al., 2014)
Moreover, a network framework with N nodes is said to accept labels N that assigns a representation (weight) to each link is called weighted network. Otherwise, if the links of a network do not accept labels, the system is named unweighted network. Previously described that the brain can be seen as a complex network: An affiliated network area where nodes represent different specialized regions and edge represent advice pathways. From the functional viewpoint, communication is coded by temporal dependence between the activities of different brain areas. The use of graph based technique in translational neuroscience has become great to measure brain dysfunctions in agreement of anomalous reconfiguration of brain networks. Besides, graph theory analysis of brain
networks can be blindly activated to brain signals. The adversity with integrating data from multiple modalities is that it is computationally actual ambitious to analyse and it is acutely difficult to anticipate anticipate the relationships between objects in the data (Fallani et al., 2014).
Brain Network Connectivity
The human brain is organized by structurally and functionally and it is one of the most complex systems. Brain connectivity may be analysed and considered application as a broad range of network analysis methods and categorized as: Structural connectivity and functional connectivity (Fig. 5) (Ciric et al., 2016).
Undirected graph Directed graph Weighted graph
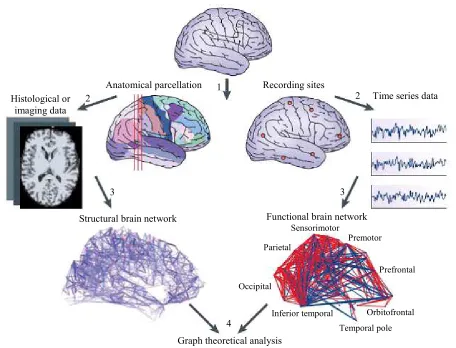
Fig. 5: Graph theory analysis of functional and structural brain network can be shown through the subsequent four phases. First, establish the network nodes. Second, Estimate connected admeasurements of affiliation between nodes.In third, Generate a connection cast by accumulation all pairwise links between nodes. In fourth, analyse the parameters of brain networks. Image courtesy of (Bullmore and Sporns, 2009)
Many of the brain connectivity methods are already activated in alongside efforts to map and call added biological systems, e.g., those of cellular metabolism, ecology or gene regulation. The approach of directed graphs is one of the most popular methods to map networks of structural and functional brain connectivity at all stages.
Graphs are collection of nodes and edges which are corresponding to brain regions and pathways. In the easiest form, graphs can be declared by a connection matrix with binary elements that identify the existence or lack of a directed edge between pairs of nodes. Generally, nodes can connect with other nodes through indirectly or directly. Indirect interaction is a connection of multiple edges and the functional effectiveness of these indirect connections are depends on the path length. Besides the distance between two nodes are corresponding to the length of the shortest path and the all-around average of all distances is called the path length.
According to formal outline of graph based analysis, complex brain network consists of a set of structural and
functional connectivity and can be processed by the following several steps.
Structural Brain Network Connectivity
Structural brain connectivity represents the structural associations a part of altered neuronal elements including both the morphometric alternation and accurate anatomical connectivity. At the complex brain networks, this access about accredits to white amount projections bond cortical and subcortical regions. The structural connectivity of human brain in vivo can be completed by
structural and diffusion MRI. (Bullmore and Sporns 2009; Van der Horn et al., 2017). Structural connectivity of this
affectionate is anticipate to be almost abiding on under time scales (seconds to minutes) but only some of artificial experience-dependent variations at best time scales (hours to days) (Friston et al., 1993). In addition, in the field of
neuroimaging, as the directionality of projections currently cannot be detected, the structural brain connectivity is mostly abstinent as a set of accidental relations.
Histological or imaging data
2
Anatomical parcellation 1 Recording sites
2 Time series data
3
Functional brain network
Sensorimotor
Premotor
Prefrontal
Orbitofrontal Temporal pole Inferior temporal
Occipital
4
Graph theoretical analysis
Parietal
Functional Brain Network Connectivity
Functional brain connectivity denotes the functional relations of brain areas accepting by quantifying the temporal correlations between spatially limited neurophysiological contest from fMRI and EEG/MEG data (Friston et al., 1993; Kabbara et al., 2016b). It is
largely derived from time series analysis of complex brain networks because it is highly time-dependent and describes patterns of statistical reliance among neural elements (nodes and edge) (Joo et al., 2016; Zhang et al.,
2017). A various number of neuroimaging techniques,
including diffusion MRI, functional MRI,
Electroencephalography (EEG), Magnetoencephalography (MEG) may be applied to analyze time series data of functional brain connectivity and can be figure out in a number of ways, including as spectral coherence, mutual information, or cross-correlation.
The future indications of functional brain connectivity is to apply an algorithm in time-evolving graphs, where the challenging factors are to extract features and to find patterns incrementally over time. Another indication of brain connectivity is if the functional brain connectivity features are extracted from the neuroimaging data, graph based techniques can be further applied to complex brain networks and examine their essential topological properties to detect abnormalities.
Role of Imaging Techniques for Complex
Brain Network Analysis
Graph based analysis of complex brain networks have given significant output to find a variety of brain and mental disorders. Functional and Diffusion MRI has given rise to rich and flexible structure function relationships of complex brain network analysis. Besides these imaging techniques already contributed to developing better diagnoses and treatment options of neurodegenerative disorders like as Schizophrenia disease, Alzheimer's disease, traumatic brain injury, Epilepsy, Parkinson’s disease etc., Sporns (2014). However, the studies and major contributions of functional and diffusion MRI for complex brain network analysis based on graph provides are as follows.
Funtional Magnetic Resonance Imaging (fMRI)
Functional MRI has released an important window for the non-invasive analysis of the circuitous human brain. Because it can evaluate different brain regions over times, which is the basic need to consider the brain network as a complex system. Functional MRI is a neuroimaging procedure using MRI method that measures brain activity to detect changes in blood flow.
Functional MRI is also known as Blood Oxygenation Level Dependent (BOLD) MRI which is one of the most great technique to recognize activity in the human health and brain (Matthews and Jezzard, 2004). BOLD fMRI was first developed and described in 1989. It has rapidly developed as a non-invasive method to map brain activities. Although a number of methods have been applied to measure functional brain networks connectivity, functional Magnetic Resonance Imaging (fMRI), especially resting state fMRI has played great rules for identifying clinical biomarkers for brain diseases (Rodic and Zhao, 2015; Song and Jiang, 2012).
Basic Goals and Current Applications of
Functional MRI
Functional MRI is a well-developed imaging technique to detect changes in the signals used to produce magnetic resonance images that are linked with neuronal action in the brain. Besides, it can be advised to abide specific hypotheses apropos the attributes of the
broadcast systems amenable for assorted
anatomic/functional responses of the brain. Hennig et al.
(2003; Gore, 2003) illustrated that although many of the imaging techniques have been used to detect the brain disorder, fMRI covers all domain of systemic neurosciences. Functional MRI is just about to enter the domain of clinical applications. Daimiwal et al. (2012;
Hennig et al., 2003) described that functional magnetic
resonance imaging techniques have confirmed to be vital to understand the functional, cellular and molecular mechanisms of the brain (Daimiwal et al., 2012).
Advantages and Limitations of Functional MRI
The benefit of fMRI is that it is non-invasive and doesn’t use radiation like Computed Tomography (CT) Positron Emission Tomography (PET) and X-rays scans. It can evaluate brain function securely and efficiently. Virtually fMRI has no risks. Besides, it is analogously cheap, as no trace or adverse appropriate and easy to use. Functional Magnetic Resonance Imaging (fMRI) can produce are very high-resolution images. Also, fMRI is far more objective to compare with the other traditional questionnaire methods of psychological evaluation. Although fMRI has many advantages yet it has some difficulties. First, it is costly. Second, it can alone abduction bright images contrarily its imaging action may abduction exceptionable artefacts. Third, it is an aberrant admeasurement of academician action that may be suffered by non-neural changes in the body and fourth, advisers still don’t absolutely accept how it works (Chen and Glover, 2015; Ahsan et al.,
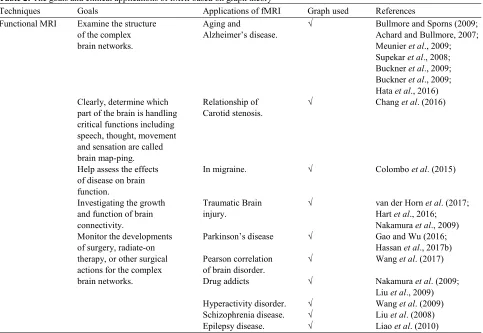
Table 2: The goals and clinical applications of fMRI based on graph theory
Techniques Goals Applications of fMRI Graph used References
Functional MRI Examine the structure Aging and √ Bullmore and Sporns (2009; of the complex Alzheimer’s disease. Achard and Bullmore, 2007;
brain networks. Meunier et al., 2009;
Supekar et al., 2008; Buckner et al., 2009; Buckner et al., 2009; Hata et al., 2016) Clearly, determine which Relationship of √ Chang et al. (2016) part of the brain is handling Carotid stenosis.
critical functions including speech, thought, movement and sensation are called brain map-ping.
Help assess the effects In migraine. √ Colombo et al. (2015) of disease on brain
function.
Investigating the growth Traumatic Brain √ van der Horn et al. (2017; and function of brain injury. Hart et al., 2016;
connectivity. Nakamura et al., 2009)
Monitor the developments Parkinson’s disease √ Gao and Wu (2016;
of surgery, radiate-on Hassan et al., 2017b)
therapy, or other surgical Pearson correlation √ Wang et al. (2017) actions for the complex of brain disorder.
brain networks. Drug addicts √ Nakamura et al. (2009; Liu et al., 2009) Hyperactivity disorder. √ Wang et al. (2009) Schizophrenia disease. √ Liu et al. (2008) Epilepsy disease. √ Liao et al. (2010)
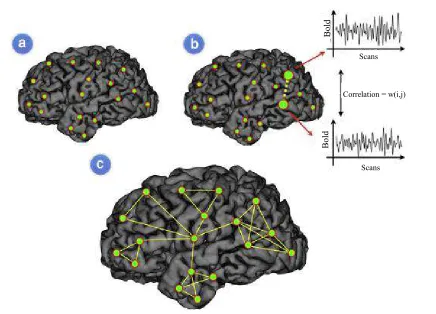
Brain Network Connectivity with Functional MRI
According to the graph theory concepts brain networks connectivity can be articulated as a graph G = (V, E) area
where V can be the accumulating of nodes absorption the academician regions and E can be the anatomic access amid these brain regions. van Den Heuvel et al.
(2009; van Straaten and Stam, 2013) explored a schematic amount of a graph symbol of the functional brain network in (Fig. 6).
Hagmann et al. (2007; Valencia, et al., 2009;
Meunier et al., 2009) studied about the resting-state
fMRI for measuring of the functional brain network. They also told that the functional brain networks interactions between regions are abundant because it has an intrinsically cohesive modular (community) structure and functionally linked with brain regions. Nakamura et al. (2009) illustrated that the topological
properties (connectivity strength, small-world attributes) of functional brain networks at individual time points through the recovery from traumatic brain injury had changed using graph based resting fMRI. Liao et al.
(2010) showed that graph based resting-state fMRI analysis of functional brain networks in epilepsy was related with smaller clustering coefficients and shorter
path lengths. Liu et al. (2008) provided the first graph
based analysis of functional brain networks in schizophrenia using resting fMRI and also showed that several topological measurements, like local efficiency, global efficiency and clustering coefficient. Supekar et al. (2008) reported that the unusual small-world group in
functional brain networks was first demonstrated by applying resting state fMRI in Alzheimer’s disease. Wang et al. (2009) discussed the deficit hyperactivity
condition are associated with the unusual small-world topology in functional brain networks.
In Addition, several fMRI studies have examined age-related variations in the functional forms of the brain utilizing graph-based network models. Fair et al. (2009)
reported that using a fMRI dataset (210 individuals: 66 aged 7-9 years; 53 aged 10-15 years; 91 aged 19-31 years), functional brain networks composed of 34 predefined brain areas were connected over age by the small-world measurements. In contrast, Supekar et al.
Fig. 6: The model of functional brain network consists of nodes and edges between regions that are functionally affiliated and can be bidding as a circuitous graph. In the console (a),the accumulating of nodes is represented and these can be brain regions. In the console (b), the actuality of functional interactions between the nodes in the network needs to be clear, because it represents the level of interactions between different nodes of the network. In the console (c) the actuality of interactions amid two nodes can be identified as for whether their similar of functional interactions exceeds an assertive predefined threshold. This after-effect in modelling the brain as a functional network with linked between different areas that are functionally connected. Image courtesy of (Guye et al., 2010)
Achard and Bullmore (2007) showed that in older adults, the interregional connectivity of functional brain networks derived from resting fMRI had reduced efficiency than in young adults. Wang et al. (2017)
studied of Functional Brain Network (FBN) and have been introduced depression disorder classification including Pearson correlation, extracting features from constructed FBN where functional MRI shown a successful impact. To address these challenging issues they have developed a method using a sparse low-rank model to automatically remove weak relationship of FBN.
Several recent studies have shown that in the context of behaviour, development and disease states functional connectivity has proven a powerful method for analysing complex brain networks measuring by resting-state fMRI. Warren et al. (2017) applied functional brain
connectivity to structural brain connectivity to eliminate functional connectivity with other brain regions measuring derived from the fMRI BOLD signal. Goelman et al. (2017) described an analysis method by
using frequencies and phase of resting-state functional
MRI data that have shown the correlation between coupled time-series functions. Besides they illustrated that this analysis can be applied to any coupled functions in numerous areas containing electrophysiology, EEG or MEG in neuroscience research. Xu et al. (2016)
discussed Borderline Personality Disorder (BPD) neuroimaging research that has to appear structural and functional deviations in brain networks. To accept the topological backdrop of academician networks, they active blueprint approach by investigating anatomic alluring Resonance Imaging (fMRI) data. Although the additional a lot of accepted neurodegenerative ataxia is Parkinson’s ache (PD) primarily affecting the aging populations, its neurophysiological mechanisms still unclear.
Gao and Wu (2016) proposed that the development of neuroimaging techniques can be allowed to detect Parkinson's Disease (PD) in patients. Especially they described the functional MRI neuroimaging technique for detecting of the functional connectivity of brain networks in patients with Parkinson's Disease (PD). Traumatic Academician Injury (TBI), after-effects from
B
ol
d
Scans
Scans
B
ol
d
accident to academician tissue acquired by an external force. The neurobiological mechanisms of Traumatic Brain Injury (TBI) underlying specific disorders still are not fully clear. Several of the neuroimaging techniques have been applied to detect these disorders. To find a clear image, Diffusion MRI, Diffusion tensor imaging and Functional MRI provided new insights of the animal academician in both health and disease focussing on structural and functional connectivity patterns. Xiao et al. (2015) identified several studies
that many of functional connectivity abnormalities in brain networks, but researchers are still working to identify abnormalities. Colombo et al. (2015)
discovered functional connectivity abnormalities in migraine by resting-state fMRI which is a new field of neuroscience research. Because, to explore the functional connectivity of brain areas, resting-state fMRI is one of best methods.
Functional brain connectivity is a relatively new research topic in the field of complex brain networks. Several studies found that the function of brains can be changed by aging and Alzheimer's Disease (AD) and shown recent innovations neuroimaging techniques have detected abnormalities in functional networks. To detect diseases and analyse functional connectivity Dennis and Thompson (2014) applied three primary methods including seed-based, ICA and graph theory. In the field of neuroscience, especially in brain complex network graph theory is playing a great role. Chang et al. (2016)
identified that Carotid stenosis changes the functional connectivity and decline the cognitive functions. To evaluate the relationships between hemodynamic injury and cognitive decline, they applied graph theory based on resting state fMRI.
Diffusion Magnetic Resonance Imaging (DMRI)
Diffusion MRI uses the diffusion of water molecules to generate contrast in MR images. Although over the last 30 years various technologies have been developed to detect physiological illness, Diffusion MRI has become an accustomed address with an
abundant appulse on bloom affliction and
neurosciences (Gallichan, 2017). From the mid-1980s, Diffusion MRI is as well-known as Diffusion-Weighted Magnetic Resonance Imaging (DWI or DW-MRI) (Delouche et al., 2016; Le Bihan et al., 2006).
Goals and Current Applications of Diffusion MRI
Diffusion MRI is a quickly establishing the experimental tool for the evaluation of brain diagnosis. Its goal is to examine the white matter in the brain and to determine diffusion coefficient in-vivo which has great potential for further understanding of normal and abnormal physiology (Bammer, 2003; Mori and Barker, 1999). Recently, Diffusion MRI is an imperative
technique that already widely used for the study of stoke and other neuroimaging disorders. This technique is very important to apprehend the baptize circulation in academician which allows us to abstraction academician fibre structures (Mori and Barker, 1999; Booth and Hamarneh, 2010; Mueller et al., 2015). The applications
of Diffusion MRI in brain disorder and clinical neuroscience which are summarized in Table 3.
Advantages and Limitations of Diffusion MRI
Diffusion alluring Resonance Imaging (DMRI) is one of a lot of rapidly developing diagnosis tools in the field of MRI which image adverse is based on the circulation of baptizing molecules in tissue. Besides, Circulation MRI can appraise white amount in the brain. As DMRI has been activated to studies of brain disorders so it can have some advantages and limitations (Table 4) (Jones, 2010; Chenevert et al., 2000).
Brain Network Connectivity with Diffusion MRI
Kahn et al. (2017) described that to allow for actual
information transmission, human expertise learning has to need to fine-scale coordination of distributed networks of brain areas associated with white matter tracts. For testing this hypothesis they collected structural imaging data and to identify streamlines linking cortical and subcortical brain areas, they used deterministic tractography which has made structural networks for each participant. Finally, they decided that enlarged white matter connectivity linking early visual areas was related with a faster learning level.
Hagmann et al. (2007) proposed that mapping of
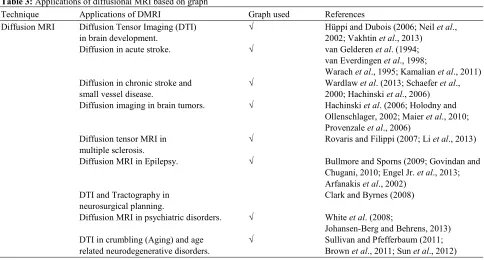
Table 3: Applications of diffusional MRI based on graph
Technique Applications of DMRI Graph used References
Diffusion MRI Diffusion Tensor Imaging (DTI) √ Hüppi and Dubois (2006; Neil et al., in brain development. 2002; Vakhtin et al., 2013) Diffusion in acute stroke. √ van Gelderen et al. (1994;
van Everdingen et al., 1998;
Warach et al., 1995; Kamalian et al., 2011) Diffusion in chronic stroke and √ Wardlaw et al. (2013; Schaefer et al., small vessel disease. 2000; Hachinski et al., 2006) Diffusion imaging in brain tumors. √ Hachinski et al. (2006; Holodny and
Ollenschlager, 2002; Maier et al., 2010; Provenzale et al., 2006)
Diffusion tensor MRI in √ Rovaris and Filippi (2007; Li et al., 2013) multiple sclerosis.
Diffusion MRI in Epilepsy. √ Bullmore and Sporns (2009; Govindan and Chugani, 2010; Engel Jr. et al., 2013; Arfanakis et al., 2002)
DTI and Tractography in Clark and Byrnes (2008) neurosurgical planning.
Diffusion MRI in psychiatric disorders. √ White et al. (2008;
Johansen-Berg and Behrens, 2013) DTI in crumbling (Aging) and age √ Sullivan and Pfefferbaum (2011; related neurodegenerative disorders. Brown et al., 2011; Sun et al., 2012)
Table 4: Advantages and Limitations of diffusion MRI
Technique Advantages Limitations
Diffusion MRI Able to aces up tears in the white amount that Images distortion added imaging browse including (MRI and CT)
scans do not aces up.
Containing added abyss advice from MRI scans The low spatial resolution which agencies a
and allows us to access images of white matter. of pixels so the images may appear out cryptic at times. DMRI is an effective technique for comprehensive, Extremely sensitive to motion and can cause mis- noninvasive, functional anatomy mapping of the registration if the patient moves.
human complex brain networks.
Can help solve the mystery of concussions through its Requires extensive computing power, man-hours and deeper and in depth scan of the brain. expertise.
Provides outstanding details of the structural brain connectivity.
Provides a 3D visualization of neuronal pathways. Can help doctors predict recovery times for concussion patients.
Structural brain connectivity mapping techniques are playing a very significant role to identify abnormal connectivity in psychiatric and neurologic disease, particularly Small animal connectivity techniques are very important to find anomalies in the disease model . Calabrese et al. (2015) showed small
animal diffusion tractography that can be significantly improved through the groupings of ex vivo MRI with exogenous adverse agents, containing with innovative diffusion accretion and face-lifting address and probabilistic fibre tracking.
Schultz et al. (2016) illustrated, although many of
the researchers has been studied an affluence of
(2016) proposed Diffusion Magnetic Resonance Imaging which noninvasively maps academician connectivity at an arresting calibration by barometer baptize molecules. Besides in recent years, there has been studied a lot on network modeling of brain connectivity seriously. Analyzing human brain networks, many of the researchers applied graph theory by using a various number of imaging techniques including functional MRI, Structural MRI, diffusion MRI and EEG/MEG separately.
He and Evans (2010) studied all of these techniques and shown many crucial properties of complex brain networks which can be applied to
detect the abnormalities of brain regions especially focusing on Alzheimer's and Schizophrenia disease. To map the structural access of the human brain, Thomas et al. (2014) proposed Tractography based on
diffusion-weighted MRI (DWI) which is one of the most prominent widely used technique. Besides, to investigate they applied this method and showed the highest sensitivity. Overall, for developing brain network analysis with fMRI and DMRI , different authors applied different software packages. The number of software packages for brain network analysis with fMRI and DMRI are listed in Table 5.
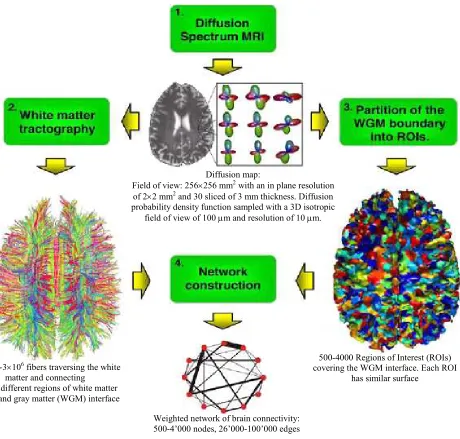
Fig. 7: Structural Brain network connectivity with diffusion MRI. Image courtesy of (Sporns, 2011) Diffusion map:
Field of view: 256×256 mm2 with an in plane resolution of 2×2 mm2 and 30 sliced of 3 mm thickness. Diffusion probability density function sampled with a 3D isotropic
field of view of 100 µm and resolution of 10 µm.
500-4000 Regions of Interest (ROIs) covering the WGM interface. Each ROI
has similar surface ∼3×10⁶ fibers traversing the white
matter and connecting different regions of white matter and gray matter (WGM) interface
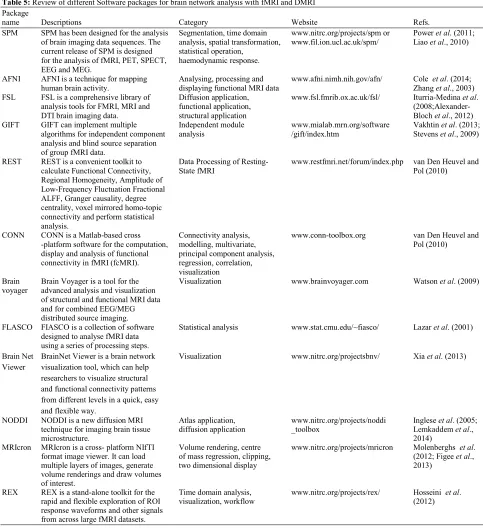
Table 5: Review of different Software packages for brain network analysis with fMRI and DMRI Package
name Descriptions Category Website Refs.
SPM SPM has been designed for the analysis Segmentation, time domain www.nitrc.org/projects/spm or Power et al. (2011; of brain imaging data sequences. The analysis, spatial transformation, www.fil.ion.ucl.ac.uk/spm/ Liao et al., 2010)
current release of SPM is designed statistical operation, for the analysis of fMRI, PET, SPECT, haemodynamic response. EEG and MEG.
AFNI AFNI is a technique for mapping Analysing, processing and www.afni.nimh.nih.gov/afn/ Cole et al. (2014;
human brain activity. displaying functional MRI data Zhang et al., 2003)
FSL FSL is a comprehensive library of Diffusion application, www.fsl.fmrib.ox.ac.uk/fsl/ Iturria-Medina et al.
analysis tools for FMRI, MRI and functional application, (2008;Alexander-
DTI brain imaging data. structural application Bloch et al., 2012)
GIFT GIFT can implement multiple Independent module www.mialab.mrn.org/software Vakhtin et al. (2013;
algorithms for independent component analysis /gift/index.htm Stevens et al., 2009)
analysis and blind source separation of group fMRI data.
REST REST is a convenient toolkit to Data Processing of Resting- www.restfmri.net/forum/index.php van Den Heuvel and
calculate Functional Connectivity, State fMRI Pol (2010)
Regional Homogeneity, Amplitude of Low-Frequency Fluctuation Fractional ALFF, Granger causality, degree centrality, voxel mirrored homo-topic connectivity and perform statistical analysis.
CONN CONN is a Matlab-based cross Connectivity analysis, www.conn-toolbox.org van Den Heuvel and
-platform software for the computation, modelling, multivariate, Pol (2010)
display and analysis of functional principal component analysis, connectivity in fMRI (fcMRI). regression, correlation,
visualization
Brain Brain Voyager is a tool for the Visualization www.brainvoyager.com Watson et al. (2009)
voyager advanced analysis and visualization of structural and functional MRI data and for combined EEG/MEG distributed source imaging.
FLASCO FIASCO is a collection of software Statistical analysis www.stat.cmu.edu/~fiasco/ Lazar et al. (2001)
designed to analyse fMRI data using a series of processing steps.
Brain Net BrainNet Viewer is a brain network Visualization www.nitrc.org/projectsbnv/ Xia et al. (2013) Viewer visualization tool, which can help
researchers to visualize structural and functional connectivity patterns from different levels in a quick, easy and flexible way.
NODDI NODDI is a new diffusion MRI Atlas application, www.nitrc.org/projects/noddi Inglese et al. (2005; technique for imaging brain tissue diffusion application _toolbox Lemkaddem et al.,
microstructure. 2014)
MRIcron MRIcron is a cross- platform NIfTI Volume rendering, centre www.nitrc.org/projects/mricron Molenberghs et al.
format image viewer. It can load of mass regression, clipping, (2012; Figee et al.,
multiple layers of images, generate two dimensional display 2013)
volume renderings and draw volumes of interest.
REX REX is a stand-alone toolkit for the Time domain analysis, www.nitrc.org/projects/rex/ Hosseini et al.
rapid and flexible exploration of ROI visualization, workflow (2012)
response waveforms and other signals from across large fMRI datasets.
Quality Evaluation of Complex Brain
Networks
In this study, we have examined structural and functional connectivity in the human brain using features from graph theory. Because Structural and Functional Connectivity (SC and FC) have received great attraction over the last decade, as they offer unique insight into the coordination of brain
functioning. To demonstrate the evaluations of complex brain network, we presents structural and functional graph theory analyses in two separate studies.
Objectives Evaluations
Mijalkov et al. (2017) measured the differences in
analysis on the resting-state fMRI data of healthy controls and PD patients with MCI from the Parkinson’s Progression Markers Initiative. They evaluated resting-state functional images that were acquired using an echo planar imaging sequence (repetition time = 2400 ms; echo time = 25 ms; flip angle = 80°; matrix = 68×68; voxel size =
3.25×3.25×3.25 mm3). Bassett and Sporns (2007),
illustrated that graph theory has proven to be an extremely productive framework in which to understand the structure and function of large-scale brain network and their implications for human cognition (Bassett and Sporns, 2007); alternative
approaches that build on this framework-such as network control theory-necessarily require sceptical evaluation to clearly delineate value added. Now we just focus different equations on this table to measure connectivity of complex brain networks (Table 6).
Graph theory have provided a toolbox of diagnostics to describe the organization of graphs or networks. Gu et al. (2015) evaluated that using graph
theory, they can identify regions of high (low) degree, while using network control theory. Moreover, they can understand the functional role of these regions as being critical for guiding the movement of the brain into many easy-to-reach (difficult-to-reach) states.
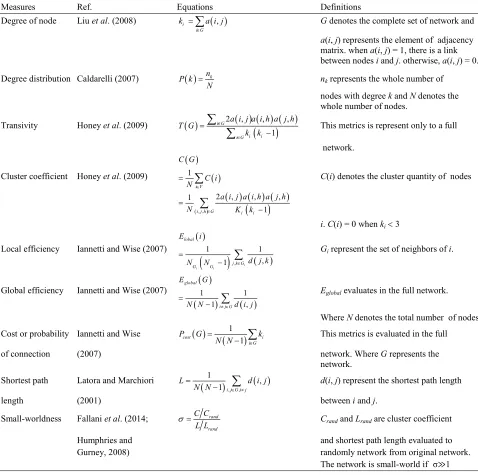
Table 6: Complex brain network measure: Equations and definitions
Measures Ref. Equations Definitions
Degree of node Liu et al. (2008) i
(
,)
i G
k a i j
∈
=
∑
G denotes the complete set of network and a(i, j) represents the element of adjacency matrix. when a(i, j) = 1, there is a link between nodes i and j. otherwise, a(i, j) = 0. Degree distribution Caldarelli (2007) P k( )
nkN
= nkrepresents the whole number of nodes with degree k and N denotes the whole number of nodes.
Transivity Honey et al. (2009)
( )
(
) (
) (
)
(
)
2 , , ,
1
i G
i i i G
a i j a i h a j h T G k k ∈ ∈ = −
∑
∑
This metrics is represent only to a fullnetwork.
Cluster coefficient Honey et al. (2009)
( )
( )
(
) (
) (
)
(
)
(, ,) 12 , , ,
1
1
i V
i j h G i i
C G
C i N
a i j a i h a j h
N K k
∈ ∈ = = −
∑
∑
C(i) denotes the cluster quantity of nodes
i. C(i) = 0 when ki< 3 Local efficiency Iannetti and Wise (2007)
( )
(
)
, ( ) 1 1 , 1 i i i lobalj k G
G G
E i
d j k
N N ∈
=
−
∑
Gi represent the set of neighbors of i.
Global efficiency Iannetti and Wise (2007) ( )
( ) ( )
1 1
1 ,
global
i j G
E G
N N ≠ ∈ d i j
=
−
∑
Eglobal evaluates in the full network. Where N denotes the total number of nodes. Cost or probability Iannetti and Wise
( )
(
)
1 1
cost i
i G
P G k
N N ∈
=
−
∑
This metrics is evaluated in the fullof connection (2007) network. Where G represents the
network. Shortest path Latora and Marchiori
(
)
, ,(
)
1
, 1 i j G i j
L d i j
N N ∈ ≠
=
−
∑
d(i, j) represent the shortest path lengthlength (2001) between i and j.
Small-worldness Fallani et al. (2014; rand rand
C C L L
σ= Crand and Lrand are cluster coefficient Humphries and and shortest path length evaluated to
Gurney, 2008) randomly network from original network.
The development of graph-theory based complex network analysis provides an important mathematical framework to characterize the global and regional topology in brain connectivity networks (Ribeiro de Paula et al., 2017). Using graph-theory based complex
network analysis and network based statistic approach, Xu et al. (2016) examined the topology and
connectivity in resting-state functional brain networks of adults with BPD versus healthy controls. As hypothesized, patients with BPD provided evidence for abnormalities both in topological structure and in connectivity in the intrinsic functional brain networks. These abnormalities appear to be related to specific symptoms of BPD and can be used as features to distinguish patients with BPD from healthy controls using a machine learning classifier. These findings add to prior neuroimaging studies that have reported abnormal connections between specific brain regions in BPD and may provide new, clinically-relevant knowledge about the neurophysiology of the disease. Their graph analysis identified significant changes of small-world properties and network efficiency in patients with BPD versus healthy controls at the 0.03–0.06 Hz frequency band, including increased size of Largest
Connected network Component (LCC),
clusteringcoefficient, small-worldness and local efficiency (Table 7).
Recently, Gong et al. (2008; Hagmann et al., 2008),
maps of about 80 cortical and subcortical gray matter regions were constructed from DWI data and analysed with fMRI data using graph theory. They also found the same result. But Eguiluz et al. (2005) found
controversial result although no statistical test was used. To our knowledge, only one study investigated the graph properties in both structural and functional connectivity. More recently, Messé et al. (2012) have investigated
with the total of 132 nodes, distributed over the whole cortical (n = 92) and subcortical (n = 24) gray matter and
the cerebellum (n = 16) were defined by all functional
networks identified (Fig. 8).
In order to investigate similarities between structural and functional aspects of the full-brain network across subjects, the structural and functional connectivity indices were uniformly thresholded to obtain binary graphs of varying density or cost. They performed an analysis of variance and found the approximately same results (Fig. 9) of the node degrees for Structural and functional connectivity of brain network.
Table 7: Number of nodes and edges and the corrected p-value of the connected subnetwork in 0.03- 0.06 Hz that show lower connectivity in BPD patients, under different primary threshold in NBS test
Primary threshold No. of nodes No. of links Corrected p-value t = 1.75, p ≈ 0.05 No significant result
t = 2.05, p ≈ 0.025 68 205 0.048
= 2.5, p ≈ 0.01 49 87 0.0408
t = 2.75, p ≈ 0.005 40 57 0.0298
t = 3.05, p ≈ 0.0025 26 26 0.0304
t = 3.4, p ≈ 0.001 No significant result
Fig. 9: Mean and standard deviation across subjects of the characteristic path length L (top left), scaled characteristic path length Ls (bottom left), clustering coefficient C (top right) and scaled clustering coefficient Cs (bottom right) as a function of the cost value for structural connectivity (red), functional connectivity at rest (dark blue), functional connectivity duringthe motor task (green) and functional connectivity for the visual stimulation (light blue) and the corresponding values for typical networks: Random (light grey) and lattice (dark grey), with the same size and density as those of the networks analysed. Image courtesy of Messé et al. (2012)
Subjectives Evaluations
Both structure and function can be indirectly imaged in vivo using magnetic resonance imaging
(MRI). Structural connectivity using Diffusion-Weighted Imaging (DWI) (Mori and Zhang, 2006) and functional connectivity using functional Magnetic Resonance Imaging (fMRI) (Logothetis et al., 2001).
DWI provides information about white matter organization, allowing the reconstruction of fibre bundles (Hagmann et al., 2007; Iturria-Medina et al.,
2007) and fMRI uses Blood-Oxygenation Level-Dependent (BOLD) contrast to indirectly map neuronal activation (Raichle and Mintun, 2006). Various approaches have been used to investigate the nodes and edges, relaying either on structural or functional information. Strogatz (2001; Watts and Strogatz, 1998; Reijneveld et al., 2007) were applied graph theory to
characterize quantitatively the structural and functional
features of the complex brain network. Previous studies, in references, have shown that functional imaging (Achard et al., 2006; Salvador et al., 2005) and
structural imaging (Gong et al., 2008; Hagmann et al.,
2008) with as common results the small word properties of the analysed complex brain networks.
Future Research Directions
In the field of neuroscience, Graph-theory analysis of brain network is one of the complex task. Although many researchers already engaged with this research field still there are some challenging issues need to be identified. Complex brain network analysis b used on the graph could be both useful and feasible for more profound studies but still required for more systematic assessment. Besides, in complex brain networks, there are deficiencies of a gold standard for the meaning and descriptions of network nodes and edges or links.
5
4
3
2
0 0.1 0.2 0.3 0.4
0.8
0.6
0.4
0.2
0
cost
0 0.1 0.2 0.3 0.4
cost
0 0.1 0.2 0.3 0.4
cost
0 0.1 0.2 0.3 0.4
cost
1.8
1.6
1.4
1.2
1
15
10
5
L
C
L
Ensuring the suitable use of network analysis, researchers still have to need to take attention when choosing the right network demonstration of the brain connectivity. The most prominent area of expansion is, structural brain connectivity had modelled for structural associations among different neuronal elements derived from resting fMRI and functional brain connectivity had modelled for the functional associations among brain regions measured with diffusion MRI but nobody tried for the whole-brain network. So, the combination of both structural and functional connectivity can be modelled as networks with different neuroimaging modalities. Because the combination of different imaging modalities to determine the relationship of the structural and functional connectivity of the brain. We hope this multimodal imaging techniques of the future will provide integrative evidence to map the patterns of whole brain connectivity.
Conclusion
Graph based analysis of Complex brain network has emerged as an important technique to visualise functional and structural brain connectivity. We characterized two prominent procedures that measure local and global properties of complex brain networks. The associated brain connectivity prominent technique allows researchers to begin exploring network features of complex functional and structural imaging datasets. We also show some challenging issues that will be playing an increasingly important role in the evolvement of brain’s network in near future.
Acknowledgement
We would like to thank the anonymous reviewers and editor for their constructive comments and suggestions on earlier version of this paper. The work described in this paper has been partly supported by the ARC DP Project: DP140100841 and Victoria University, Australia.
Author’s Contributions
All authors equally contributed in this work.
Ethics
This review article is original and have never been published anywhere. The corresponding author confirms that all of the authors have read and approved the manuscript and no ethical issues involved.
Referencess
Achard, S. and E. Bullmore, 2007. Efficiency and cost of economical brain functional networks. PLoS Comput. Biol., 3: 268-276. DOI: 10.1371/journal.pcbi.0030017
Achard, S., R. Salvador, B. Whitcher, J. Suckling and E. Bullmore, 2006. A resilient, low-frequency, small-world human brain functional network with highly connected association cortical hubs. J. Neurosci., 26: 63-72. DOI: 10.1523/JNEUROSCI.3874-05.2006 Ahsan, H., M. Akbar and A.U.A. Bhatti, 2009.
Application and advantage of functional magnetic resonance imaging and Blood Oxygen Level Dependant (BOLD) imaging modality. J. Pak. Med. Assoc., 59: 794-794.
Alexander-Bloch, A.F., P.E. Vértes, R. Stidd, F. Lalonde and L. Clasen et al., 2012. The anatomical distance
of functional connections predicts brain network topology in health and schizophrenia. Cerebral Cortex, 23: 127-138. DOI: 10.1093/cercor/bhr388 Arfanakis, K., B.P. Hermann, B.P. Rogers, J.D. Carew
and M. Seidenberg et al., 2002. Diffusion tensor
MRI in temporal lobe epilepsy. Magnet. Resonance Imag., 20: 511-519.
DOI: 10.1016/S0730-725X(02)00509-X
Bammer, R., 2003. Basic principles of diffusion-weighted imaging. Eur. J. Radiol., 45: 169-184. DOI: 10.1016/S0720-048X(02)00303-0
Bassett, D.S. and O. Sporns, 2007. Network neuroscience. Nature Neurosci., 20: 353-364. DOI: 10.1038/nn.4502 Boccaletti, S., V. Latora, Y. Moreno, M. Chavez and
D.U. Hwang, 2006. Complex networks: Structure and dynamics. Phys. Rep., 424: 175-308.
DOI: 10.1016/j.physrep.2005.10.009
Boersma, M., D.J. Smit, H. de Bie, G.C.M. Van Baal and D.I. Boomsma et al., 2011. Network analysis of
resting state EEG in the developing young brain: Structure comes with maturation. Human Brain Mapp., 32: 413-425. DOI: 10.1002/hbm.21030 Booth, B.G. and G. Hamarneh, 2010. Brain connectivity
mapping and analysis using diffusion MRI.
Brown, J.A., K.H. Terashima, A.C. Burggren, L.M. Ercoli and K.J. Miller et al., 2011. Brain network local
interconnectivity loss in aging APOE-4 allele carriers. Proc. Nat. Acad. Sci., 108: 20760-20765. DOI: 10.1073/pnas.1109038108
Buckner, R.L., J. Sepulcre, T. Talukdar, F.M. Krienen and H. Liu et al., 2009. Cortical hubs revealed by
intrinsic functional connectivity: Mapping, assessment of stability and relation to Alzheimer's disease. J. Neurosci., 29: 1860-1873.
DOI: 10.1523/JNEUROSCI.5062-08.2009
Bullmore, E. and O. Sporns, 2009. Complex brain networks: Graph theoretical analysis of structural and functional systems. Nature Rev. Neurosci., 10: 186-198. DOI: 10.1038/nrn2575
Calabrese, E., A. Badea, G. Cofer, Y. Qi and G.A. Johnson, 2015. A diffusion MRI tractography connectome of the mouse brain and comparison with neuronal tracer data. Cerebral Cortex, 25: 4628-4637.
DOI: 10.1093/cercor/bhv121
Caldarelli, G., 2007. Scale-Free Networks: Complex Webs in Nature and Technology. 1st Edn., Oxford University Press, ISBN-10: 0199211515, pp: 336. Chang, T.Y., K.L. Huang, M.Y. Ho, P.S. Ho and
C.H. Chang et al., 2016. Graph theoretical analysis
of functional networks and its relationship to cognitive decline in patients with carotid stenosis. J. Cerebral Blood Flow Metabolism, 36: 808-818. DOI: 10.1177/0271678X15608390
Chen, J.E. and G.H. Glover, 2015. Functional magnetic resonance imaging methods. Neuropsychol. Rev., 25: 289-313. DOI: 10.1007/s11065-015-9294-9 Chenevert, T.L., L.D. Stegman, J.M. Taylor,
P.L. Robertson and H.S. Greenberg et al., 2000.
Diffusion magnetic resonance imaging: An early surrogate marker of therapeutic efficacy in brain tumors. J. Nat. Cancer Inst., 92: 2029-2036.
DOI: 10.1093/jnci/92.24.2029
Ciric, R., J. Nomi, L. Uddin and A. Satpute, 2016. Contextual connectivity: A framework for understanding the intrinsic dynamic architecture of large-scale functional brain networks.
Clark, C. and T. Byrnes, 2008. DTI and Tractography in Neurosurgical Planning. 1st Edn., Oxford University Press, ISBN-10: 9780195369779.
Cole, M.W., D.S. Bassett, J.D. Power, T.S. Braver and S.E. Petersen, 2014. Intrinsic and task-evoked network architectures of the human brain. Neuron, 83: 238-251. DOI: 10.1016/j.neuron.2014.05.014 Colombo, B., M.A. Rocca, R. Messina, S. Guerrieri and
M. Filippi, 2015. Resting-state fMRI functional connectivity: A new perspective to evaluate pain modulation in migraine? Neurol. Sci., 36: 41-45. DOI: 10.1007/s10072-015-2145-x
Daimiwal, N., M. Sundhararajan and R. Shriram, 2012. Applications of fMRI for brain mapping.
de Haan, W., Y.A. Pijnenburg, R.L. Strijers, Y. van der Made and W.M. van der Flier et al., 2009. Functional
neural network analysis in frontotemporal dementia and Alzheimer's disease using EEG and graph theory. BMC Neurosci., 10; 1-12.
DOI: 10.1186/1471-2202-10-101
Debaere, F., S.P. Swinnen, E. Béatse, S. Sunaert and P. Van Hecke et al., 2001. Brain areas involved in
interlimb coordination: A distributed network. Neuroimage, 14: 947-958.
DOI: 10.1006/nimg.2001.0892
Del Etoile, J. and H. Adeli, 2017. Graph theory and brain connectivity in alzheimer’s disease. Neuroscientist. Delouche, A., A. Attyé, O. Heck, S. Grand and
A. Kastler et al., 2016. Diffusion MRI: Pitfalls,
literature review and future directions of research in mild traumatic brain injury. Eur. J. Radiol., 85: 25-30. DOI: 10.1016/j.ejrad.2015.11.004
Dennis, E.L. and P.M. Thompson, 2014. Functional brain connectivity using fMRI in aging and Alzheimer’s disease. Neuropsychol. Rev., 24: 49-62. DOI:10.1007/s11065-014-9249-6
Eguiluz, V.M., D.R. Chialvo, G.A. Cecchi, M. Baliki and A.V. Apkarian, 2005. Scale-free brain functional networks. Phys. Rev. Lett., 94: 1-4. DOI: 10.1103/PhysRevLett.94.018102
Engel Jr, J., P.M. Thompson, J.M. Stern, R.J. Staba and A. Bragin et al., 2013. Connectomics and epilepsy.
Curr. Opin. Neurol., 26: 186-194. DOI: 10.1097/WCO.0b013e32835ee5b8
Fair, D.A., A.L. Cohen, J.D. Power, N.U. Dosenbach and J.A. Church et al., 2009. Functional brain
networks develop from a “local to distributed” organization. PLoS Comput. Biol.
Fallani, F.D.V., J. Richiardi, M. Chavez and S. Achard, 2014. Graph analysis of functional brain networks: Practical issues in translational neuroscience. Phil. Trans. R. Soc. B, 369: 1-17.
DOI: 10.1098/rstb.2013.0521
Figee, M., J. Luigjes, R. Smolders, C.E. Valencia-Alfonso and G. Van Wingen et al., 2013. Deep brain
stimulation restores frontostriatal network activity in obsessive-compulsive disorder. Nature Neurosci., 16: 386-387. DOI: 10.1038/nn.3344
Fox, M.D. and M.E. Raichle, 2007. Spontaneous fluctuations in brain activity observed with functional magnetic resonance imaging. Nature Rev. Neurosci., 8: 700-711. DOI: 10.1038/nrn2201 Friston, K., C. Frith, P. Liddle and R. Frackowiak, 1993.
Functional connectivity: the principal-component analysis of large (PET) data sets. J. Cerebral Blood Flow Metabolism, 13: 5-14.
DOI: 10.1038/jcbfm.1993.4
Gallichan, D., 2017. Diffusion MRI of the human brain at Ultra-High Field (UHF): A review. NeuroImage. Gao, L.l. and T. Wu, 2016. The study of brain functional
connectivity in Parkinson’s disease. Translat. Neurodegenerat., 5: 1-7.
DOI: 10.1186/s40035-016-0066-0
Glahn, D.C., A. Winkler, P. Kochunov, L. Almasy and R. Duggirala et al., 2010. Genetic control over the
resting brain. Proc. Nat. Acad. Sci., 107: 1223-1228. DOI: 10.1073/pnas.0909969107
Goelman, G., R. Dan, F. Růžička, O. Bezdicek and E. Růžička et al., 2017. Frequency-phase analysis of