IN THIS
ISSUE
Comparative Forage Values of California Oafgrass and Soft Chess
Harold F. Heady, D. W. Cooper., .l. M. RibZe and J. F. Hooper 51 Grazed-class Meihod of Estimating Forage Utilization
Ervin M. Schmutz, Gary A. Halt and Charles C. Michaels 54 Effects of Grazing and
D. A. Riegel, F.
Protection on W. Albertson,
a Twenty-Year-Old G. W. Tomanek and
Seeding
Floyd E. Kinsinger
Responses of Annual-Type Range Vegetation to Sulfur Feriilizafion
Charles F. Walker and William A. Williams 64
Contrasting Effects of Big Sagebrush and Rubber Rabbifbrush on Produc- tion of Crested Wheafgrass._._...________~__~__ ____ _ __________.__ ..NeiZ C. Frischknecht 70 Some Effects of Chemical Sagebrush Control on Elk Distribution
Don E. Wilbert 74
Grass-Alfalfa Versus Grass-Alone Pastures Grazed in a Repeated-Seasonal Paffern...___~~ _____ _ ____ _ ._____ . . . ..J. El. Campbell 78 A Larger Bifferbrush...~_____~~ __.__ ___ _______ ___________ ____ -Richard S. DriscoZZ 82 Book Reviews: Introduction fo Mammalogy (H. G. Reynolds); Management
of Artificial Lakes and Ponds (William J. McConnell); Weed Control (Fred H Tschirley); Land Economics Research (Thomas M. Stubble- field); 1961 Forest Tree Seed Directory (E. C. Nerd)... __________________ _____________ 83 Current Literature __ ______ _______________________________.___ _________ ______________ ___. _____________ _____ ____________________ 86
News and Nofes..._...~___._____.__ _._. ___ _____ ___.__ ._____ _________._._______________________________. 89 Wiih the Secfions...___.__.________._..__._._______._._____.__.._._._.__~___~___~____._.________~_ 93 Letters to fhe Editor ________ ____ ._____ _________.___ ____._________...____ _ ._____. _..___._ ___.______ __ ____ ____________________
Cover Photo - Springtime on the Range
By Jim Yoakum, Bureau of LandManagement, Ely, Nevada.
Journal of
Volume 16, Number 2 March, 1963RANGE
MANAGEMENT
Comparative Forage Values of
California Oatgrass and Soft Chess
HAROLD F. HEADY, D. W. COOPER, J. M. RIBLE, AND J. F. HOOPER
Professor, School of Forestry, Berkeley; Farm Advisor, Agricultural Extension Service, Eureka; Extension Tech- nologist, Agricultural Extension Service, Riverside; and Research Assistant, Berkeley; all in the University 0 j CaZi jornia.
Rangelands of Humboldt County in northwestern Cali- fornia are characterized by the presence of grasses of the Cali- fornia annual type growing in association with native peren- nial grasses. In preference and abundance, California oatgrass (Dant honia californica) is the most important perennial grass (Sampson and Parker, 1930; Huf- faker and Kennett, 1959)) where- as soft chess (Bromus mollis) is the most used annual grass. Their relative proportions vary with soil series and topographic situations, but management sys- tems can favor either species
(Cooper, 1960).
Although these rangelands have been grazed by domestic livestock for over 100 years, little information has been r,e- ported on the forage values of the species named or on the de- sirability of altering manage- ment systems to favor either or both of them. It was with this in mind that a study of species composition, relative growth pat- terns, grazing preferences, and chemical content of these two species was undertaken.
Meihods
Data were collected in a 60-
acre pasture on the Dwight May Ranch near Bridgeville. Forage sample collections were made on McMahon soil which is represen- tative of large acreages of range- land in Humboldt County. Species composition was deter- mined on 1000 feet of permanent line intercept transect and 1000 feet of point step taken in June each year. Other data were de- termined at monthly intervals.
The growth stage was deter- mined randomly throughout the pasture by ocular estimate and measurement of leaf height. Ob- servations of grazing by 10 sec- ond-calf or older Hereford cows in excellent condition for 3 to 6 hours on the days of sampling were used as the basis of graz- ing preferences and for deter- mining the proportion of old and new growth clipped for chemical analyses each month.
One pound green weight samples of each species were clipped in the part of the pasture that the cattle were using to ap- proximate the manner of grazing and the proportions of old and new growth taken by the ani- mals. California oatgrass was collected over a three-year period, 1959-1961, and soft chess for 24 months during 1960-1961.
51
The chemical analysis was per- formed by the University of Cali- fornia Agricultural Extension Service Laboratories at River- side, California. Standard American Organization Agricul- tural Chemist procedures were followed in making the chemical analyses for crude protein, phos- phorus, crude fiber, ether ex- tract, ash, calcium, and nitrogen free extract.
Results
Throughout the study, Cali- fornia oatgrass and soft chess made up approximately 88 per- cent of the available forage. California oatgrass contributed 18-21 percent and other peren- nials about ten percent. Soft chess contributed 67-70 percent and other annuals about three percent.
At no time during the three- year study was California oat- grass completely dormant (Table
52
HEADY, COOPER, RIBLE AND HOOPER
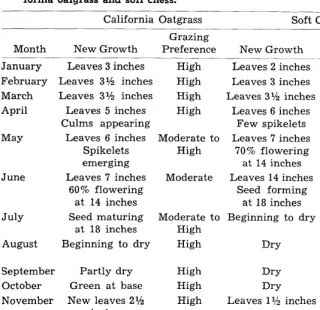
Table 1. Annual growfh cycles and comparafive grazing preference of Cali- fornia oafgrass and soft chess.
California Oatgrass Soft Chess .___-
Grazing Grazing
Month New Growth Preference New Growth Preference January Leaves 3 inches High Leaves 2 inches Very Low February Leaves 3% inches High Leaves 3 inches Very Low March Leaves 3l, inches High Leaves 3% inches Low April Leaves 5 inches High Leaves 6 inches Moderate to
Culms appearing Few spikelets High May Leaves 6 inches Moderate to Leaves 7 inches High
Spikelets High 70 % flowering
emerging at 14 inches
June Leaves 7 inches Moderate Leaves 14 inches High 60 % flowering Seed forming
at 14 inches at 18 inches
July Seed maturing Moderate to Beginning to dry Moderate to
at 18 inches High High
August Beginning to dry High Dry Low to Moderate
September Partly dry High Dry Low
October Green at base High Dry Low
November New leaves 2% High Leaves 1% inches Very Low inches
Old stems green at base
December Leaves 3 inches High Leaves 2 inches Very Low ber.
Green material was avail-
able for grazing even through
the period of summer drought,
from July to October.
Soft chess exhibited a differ-
ent growth pattern from that of
the perennial oatgrass. The seed
germinated in November
or
earlier when rain was adequate,
grew slowly during the winter,
rapidly in April and May, and
matured in June. During July
the top growth became com-
pletely dry and the seeds were
shattered by mid-August. Seed
maturity of soft chess was about
a month earlier than was the oat-
grass. Only traces of old growth
remained of either species as late
as March.
Preference for California oat-
grass was high from August to
April and moderate in May, June,
and July. In the latter period
the oatgrass was grazed but uti-
lization was not as heavy as in
other times of the year. On the
other hand, soft chess was se-
lected to the greatest extent in
May and June. There was little
use of soft chess during the time
it was dry. The terms “high”,
“moderate”, and “low” as enu-
merated in Table 1, indicate the
relative preference for the two
species by cattle. Grazing pres-
sure in the pasture was moderate
to light at all times during the
three years.
No signif icant difference be-
tween years for any chemical
component, except possibly phos-
phorus in soft chess, was indi-
cated by analyses of variance.
Therefore, the data are presented
as average monthly percentage
chemical compositions (Figure
1).
Annual cyclic patterns, except
during the winter part of the
growing period, were similar to
those found for other forage
species (Hart, Guilbert and Goss,
1932; Sampson and McCarty,
1930). Crude protein and phos-
phorus for both species increased
during the winter until the
leaves were about three to four
inches in length, reached
the
highest point at the time of culm
initiation, and decreased as the
plants matured. These compon-
ents were lowest in the dry herb-
age. Crude
fiber,
however,
reached a maximum in the dry
forage of both species.
Of more importance were the
large differences found between
the two species. California oat-
grass was always higher in crude
protein and lower in crude fiber
than soft chess. In oatgrass crude
protein remained in the range of
“suggested minimum
require-
ments” for livestock (National
Research Council, 1957, 1958)
throughout the year. Soft chess,
on the other hand, was below the
“suggested minimum
require-
ments” except during the March
to June period of fast growth.
Phosphorus was higher in soft
chess than in the oatgrass during
the growing season and lower
during the dry period. Phos-
phorus in both species was above
the “suggested minimum” live-
stock requirement
during the
period of fast growth, and for
oatgrass also when new growth
was initiated in the fall. Ether
extract was consistently higher
in California oatgrass and uni-
form in both species throughout
the year. Nitrogen free extract
was lowest in soft chess during
January and February, but was
high in oatgrass throughout the
study period. Nitrogen free ex-
tract is a high-energy source of
food, and is an important com-
ponent to consider in feeds, be-
cause of the long cool, wet win-
ters. Otherwise there were no
significant differences between
species or time of year.
CALIFORNIA OATGRASS AND SOFT CHESS
53
SOFT
01
I I 1 I 1 1 1 I I 1- - __ -
JAN. F
M
A
M
3
J
A
S
0
N D
FIGURE 1. Annual cycles of percentage crude protein, crude fiber and phosphorus in Cali- fornia oatgrass and soft chess.
servations indicate
that the
in preference back to the oat-
change was due primarily to the grass in July or August may be
selection of soft chess for the related to the shattering of soft
plump seed heads. The change
chess seed heads and to an in-
creasing differential in the crude
protein and crude fiber contents
of the two species. Soft chess
was completely dry at this sea-
son and crude protein was at a
low level. Oatgrass at this time
still provided green forage which
was more attractive to livestock
than the dry soft chess.
Conclusions
1. California oatgrass, in all
months, is higher in crude pro-
tein and lower in crude fiber
than soft chess. Contents
of
phosphorus, calcium, ash, ether
extract, and nitrogen free extract
in oatgrass are less variable with
seasons and usually higher than
in soft chess.
2. Grazing preferences
ex-
hibited by second-calf or older
Hereford cows indicate that Cali-
f ornia oatgrass, which provides
green forage year-long, is pre-
ferred except for a brief period
when the plump seeds of soft
chess are maturing.
3. Chemical content and graz-
ing preferences suggest that Cali-
fornia oatgrass is a better forage
species and that a management
system should be designed to
favor it over soft chess.
4. Observations by the authors
indicate that under moderate
grazing California oatgrass stools
readily and forms a sod which
produces large volumes of high
quality forage. Less desirable
perennials and annuals decrease
in abundance as the sod forms.
Observations also indicate that
the change in preference in late
spring, which lightens grazing
pressure on oatgrass when it is
flowering and setting seed, is a
fortunate circumstance that has
permitted maintenance of this
desired species even under heavy
grazing. Presumably a manage-
ment system to favor this species
should defer grazing until after
its seed has set. The ecology and
management considerations
of
California oatgrass are the sub-
ject of further study.
LITERATURE CITED
54
HEADY, COOPER, RIBLE AND HOOPER
ranges returned to champagne grasses. Jour. Range Mangt. 13: 203-205.
HART, G. H., H. R. GILBERT, AND H. GOSS. 1932. Seasonal changes in the chemical composition of range forage and their relation to nutri- tion of animals. Calif. Agric. Expt. Sta. Bull. 543. 62 pp.
HUFFAKER, C. B. AND C. E. KENNETT.
1959. A ten year study of vegeta- tion changes associated with bio- logical control of klamath weed. Jour. Range Mangt. 12: 69-82. NATIONAL RESEARCH COUNCIL. 1957.
Nutrient requirements of domestic animals: Nutrient requirements of sheep. Revised.
NATIONAL RESEARCH COUNCIL. 1958. Nutrient requirements of domestic
animals: Nutrient requirements of beef cattle. Revised.
SAMPSON, A. W. AND E. C. MCCARTY. 1930. The carbohydrate metabo- lism of Stipa pulchra. Hilgardia 5: 61-100.
SAMPSON, A. W. AND K. W. PARKER. 1930. St. Johnswort on range lands of California. Calif. Agric. Expt. Sta. Bull. 503. 48 pp.
Grazed-class Method of Estimating
Forage Utilization1
ERVIN M. SCHMUTZ, GARY A. HOLT AND CHARLES C. MICHAELS
Research Associate in Range Management, Arizona Ag- ricultural Experiment Station, Tucson, Arizona; Range Conservationist, KS, Tucson, Arizona and Inter-Area Range Conservationist, SCS, Phoenix, Arizona.
Obtaining proper forage utili-
zation, and its measurement, are
essential parts of good range
management.
Proper stocking
is the most important single
practice influencing the proper
use of the range. In fact, proper
stocking is so essential to proper
range use that the terms are fre-
quently used interchangeably.
Determination of proper stock-
ing and/or proper range use has
been attempted by various meth-
ods. Long-time proper stocking
rates have been estimated by
averaging yearly stocking rec-
ords, by using range survey
methods, by classifying
range
conditions which are correlated
with grazing capacities, and by
forage weighing and estimating
procedures. These estimates .are
useful mainly in determining
starting stocking rates or as av-
erage guides since production on
a particular range may vary
1Contribution from the Department of Watershed Management, Ari- zona Agricultural Experiment Sta- tion, University of Arizona and the Soil Conservation Service, U.S. Dept. of Agriculture.
The authors express appreciation to administrative and technical person- nel of the Soil Conservation Service and the Arizona Agricultural Exper- iment Station for their assistance in testing the method.
from year to year. Amount and
distribution of seasonal rainfall,
temperature
variations
and
wind movements, changes
in
plant vigor and range condition,
application of fertilizers and nu-
trient availability, rainfall dur-
ing the previous
season of
growth, and/or grazing intens-
ity and frequency during previ-
ous seasons all affect production.
Short-time annual or seasonal
adjustments in range use have
been based largely on measure-
ments of forage grazed or herb-
age left. These short-time meas-
urements are the most important
and, in time, will furnish the
most accurate data on long-time
or average stocking rates.
Range utilization is closely
correlated with and has a direct
short-time effect on range trend,
a long-time effect on range con-
dition, and both a short- and
long-time effect on forage dens-
ity and range productivity.
Other factors
influenced
by
range use are soil erosion; water
yield and runoff; vigor and re-
production of important forage,
timber and weed species; litter
accumulation; trampling of for-
age plants by livestock;
and
recreation and wildlife values.
The major problem in deter-
mining utilization is the actual
measurement or estimation of
the percentage or amount of the
plant utilized. Direct measure-
ment of forage consumed is dif-
ficult so most methods rely on
determination or estimation of
the forage left in relation to
measured or reconstructed pro-
duction, the assumption
being
that the missing forage has been
eaten by livestock. In addition
there is considerable variation in
the accuracy and use of the
various methods used to measure
plant height, weight or numbers
grazed. Regrowth
of grazed
plants also complicates estima-
tion of degree of use.
Other problems influencing
range utilization are differences
in palatability and aggressive-
ness of associated species; varia-
tions in forage preference by dif-
ferent classes of stock; differ-
ences in the amount of grazing
various plants can withstand;
difficulties in selecting
key
plants and key areas upon which
to make utilization estimates;
differences in accessibility
of
areas to livestock grazing; ‘vari-
ations in slope and susceptibility
of the soil to erosion; differences
in location and frequency of live-
stock water; and variabilities in
size and shape of pastures.
In spite of all these difficulties,
or maybe because of them, nu-
merous methods have been de-
vised to estimate or measure for-
age utilization. Reviews of vari-
ous methods have been made by
Pechanec and Pickford (1937) ;
Campbell
(1943) ;
Dasmann
(1948); Heady
(1949); Hum-
phrey (1949) ;
Joint Committee-
ASA, ADSA, ASAP, ASRM
BLACK
GRAMA
PER
CENT
UTIL-
IZATION
ESTIMATING UTILIZATION
IO
30
50
70
90
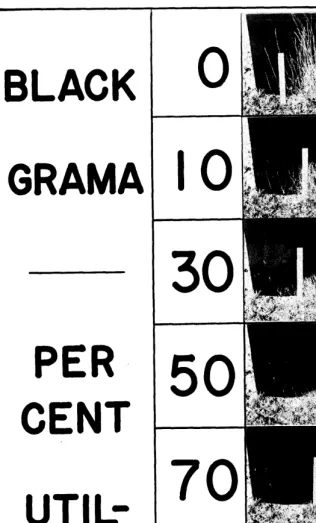
FIGURE 1. Photographic grazed-class guide for estimating forage utilization.
(1952); Brown (1954); Stoddart
and Smith
(1955); Hedrick
(1958); U. S. Forest Service
(1959); and Joint Committee-
ASRM, Agricultural
Board
(1962). Some of these methods
have been devised mainly for
quantitative research measure-
ments and others for qualitative
management purposes.
Some
have broad application to a large
variety of species and vegetative
types; others are restricted to
particular classes of plants with
specific growth forms. Some
methods are rapid and provide
data from extensive areas while
others are tedious and can be
used only on representative or
indicator areas. Whether
a uni-
55
versa1 method can be developed
is questionable.
In an attempt to develop a fast,
accurate, statistically
sound
method of measuring forage util-
ization; useable by both ranchers
and technicians; the grazed-class
method was developed.
The Grazed-Class Method
The grazed-class method com-
bines the advantages of several
methods. Photographic guides,
based on locally
developed
height-weight curves, are set up
in card form for each key species
(Figure 1). The guides are de-
veloped by clipping and photo-
graphing plants
of average
growth form to represent 0, 10,
30, 50, 70 and 90 percent use. Us-
ing these guides the examiner
places up to 100 plants of each
key species, located by toe-pace
transects, into their appropriate
grazed-classes (Table 1). Data
for each key species are recorded
separately although evaluations
of two or more species may be
made simultaneously. The per-
centage utilization for each spe-
cies is determined by multiplying
the average precentage use of
each grazed-class by the percent-
age of grazed plants in each
grazed-class and totaling
the
products.
Sampling Procedures
--
56
SCHMUTZ, HOLT AND MICHAELS
Estimates may be made at me-
chanically determined, uniform
intervals along sampling lines or
at random points in pre-selected
locations representative of the
area. One to several estimates
may be made for each species at
each location and totaled for the
area. For simplicity in conver-
sion to percentages, composite to-
tals of 20, 25, 50 or 100 estimates
may be made for each key spe-
cies in each pasture or subdivi-
sion of the pasture.
Ordinarily from one to three
key species are adequate to esti-
mate utilization. Where more
than one key species is used to
estimate utilization, the percent-
age composition of each key spe-
cies in the forage type must also
be estimated or obtained from
range survey records. This esti-
mation of percentage composi-
tion introduces a possible source
of error and calculations are in-
creased slightly which may or
may not be offset by the intro-
duction of a larger vegetative
sample on which to base use esti-
mates.
Calculation of Grazing Use
Current percentage utilization
is calculated for each key species
as indicated in Table 1. If cur-
rent use of a species is 43 percent
and its proper use is 50 percent
then the difference is the forage
units remaining. If the cow-
months (CM) of current use are
known, e.g. 60 head for 10
months, the remaining use may
be calculated according to pro-
cedures outlined by Stoddart and
Smith (1943) or Sampson (1952) :
For a single key species:
Table 1. Grazed-classes and method of calculating current use by the grazed-class method of estimating utilization.
Descriptive Range of Average Plants by Current names of utilization utilization grazed- utilization grazed-classes by grazed- by grazed- classes
classes classes
--- (Percent) - - - -
Ungrazed 0 0 4 0
Slight use o- 20 10 12 1.2
Light use 20- 40 30 24 7.2
Moderate use 40- 60 50 40 20.0
Heavy use 60- 80 70 18 12.6
Severe use 80-100 90 2 1.8
Totals 100 42.8
Using the above formula the
COW
months remaining =
14
-18X
600 = 467 CM.
Total proper use for the pas-
ture can be obtained by adding
cow months
used and cow
months remaining for a total of
1067 CM.
For intensive management or
research studies, where pastures
are subdivided for utilization
estimates and determination of
grazing efficiency, the acreage in
each subdivision must also be
measured and correlated with
grazing capacity in order to cal-
culate needed adjustments in the
stocking rate. However,
with
most utilization checks the use
of key areas to indicate the de-
gree of utilization for the whole
area is adequate and avoids de-
tailed calculations.
The method,
without
the
photographic guide, has been
used in the field by two of the
authors for about three years
with satisfactory results. The
use of the photographic guide
will result in more uniform esti-
Forage units remaining (7)
Cow months= (Proper use minus current use) x Cow mos. used (600)=98 CM. remaining Forage units used (43)
(Current percentage utilization) For several key species:
Species Forage units available Forage units used Forage units remaining (Percentage Percentage) (Percentage
x x Percentage) (Forage units Forage)
(composition proper use) (composition utilization) (available - units used)
Sideoats grama 40 x 50 = 20 40 x 30 = 12
Black grama 30 x 40 = 12 30x20= 6 32-18=14
Total 32 Total i8
mates and facilitate its use by
less experienced personnel.
Test and Analysis of the Grazed-Class Method
To test the accuracy of the
method and to study its use on
differing types of forage and by
personnel with varying exper-
ience in estimating utilization by
other methods, two inexperi-
enced observers (A and B) and
two experienced observers (C
and D) estimated utilization by
the grazed-class method on two
species with differing
growth
form. The two species were side-
oats grama
(Bouteloua
curti-
pen&da
(Michx.) Torr.) , repre-
senting a bunchgrass type growth
under desert grassland condi-
tions, and black grama
(B. erio-
poda
(Torr.) Torr.) , a stolonifer-
ous sodgrass. None of the exam-
iners had any previous experi-
ence using the grazed-class meth-
od. Estimates were made on a
desert grassland site near Sono-
ita, Arizona.
ESTIMATING UTILIZATION
57
mates were made, the remaining
part of each plant was clipped
to ground line, placed in indi-
vidually numbered sacks, and
stapled with the top sample. The
samples were oven dried, indi-
vidually weighed, and the per-
centage utilization was calcu-
lated by the weight method for
each plant.
A summary
of
grazed-class utilization estimates
made by the various examiners,
as compared to the degree of
utilization determined
from
weight data, is shown in Table 2.
The examiners are listed in order
of experience in other methods
of estimating forage utilization,
Examiner A being the least ex-
perienced and D the most experi-
enced.
The close correlation between
the arithmetic average of 100
weighed values (column 2, Table
2) and the percentage utilization
determined
by placing
the
weighed values in grazed-classes
(column 3) demonstrates the va-
lidity of using the grazed-class
method of calculation where 100
estimates are used. An impor-
tant factor here is that errors of
classification are compensating.
To determine the relative accu-
racy of different sized samples
the coefficient of variation of the
mean was plotted against sample
size, using the data from Replica-
tions I for both sideoats and
LEGEND
z
a
0 - SIDEOATSaA a:‘420- > 11
E
t --- BLACK GRAMA
z 6
01 I I I I I I I I I I 1
0 IO 20 30 S&;~AM;~E 70 80 90 100
FIGURE 2. Relation of coefficient of variation of the mean to sample size on sideoats and black grama.
black grama (Figure 2). These
curves indicate that errors of less
than 5 percent can be expected
with 100 estimate samples and
errors of less than 10 percent can
be expected with samples above
20. Samples below 20 were
highly variable and the degree
of error increases rapidly with
smaller samples. Since, as pre-
viously indicated, there was no
difference in results between the
arithmetic
average of 100
weighed samples and the same
data placed in grazed-classes, the
Table 2. Utilization estimates made by various examiners using the grazed- class method compared fo utilization determined from weight data.
Species and replications
Estimates of utilization by the Weight grazed-class method
method
arithmetic Weight Examiner
average check A B C D
Sideoats grama Rep. I Rep. II Rep. III
--_---- (Percent) - - - -
47.5 47.6 33.5 36.1 49.1 47.1 37.5 37.6 32.6 33.3 42.6 43.7 50.9 50.9 39.5 44.5 52.0 47.7
Means 45.3 45.4 35.2 38.0 47.9 46.2
Black grama Rep. I Rep. II Rep. III Means
56.1 56.1 40.6 39.3 41.8 48.7 58.7 58.6 43.1 42.3 50.3 52.2 58.5 58.5 47.9 47.1 43.5 48.8 57.8 57.7 43.9 42.9 45.2 49.9
expected variation
is due to
sampling and experimental er-
rors rather than to the method
procedure of placing estimates in
classes.
Choice of sample size will also
depend on variations in pasture
conditions; such as variability of
grazing, heterogeneity within
the type, and other factors. These
problems in relation to density
estimates are analyzed by Cos-
tello and Klipple (1939).
The effect of prior experience
in making utilization estimates
by other methods is shown in
Table 2 by the consistently
greater accuracy of the more ex-
perienced Examiners C and D.
58
SCHMUTZ, HOLT AND MICHAELS
cates that acceptable uniformity
can be obtained between exam-
iners after only one or two hours
use of the grazed-class method,
regardless of prior experience.
This uniformity should continue
to improve with added experi-
ence.
The increased accuracy follow-
ing experience in the use of the
method is confirmed by the var-
iation between replications,
which is highly significant in the
sideoats grama tests and not sig-
nificant in the black grama tests.
However, part of this difference
may have resulted from differ-
ences between the growth form
of the two plants and variations
in degree of clipping.
The analyses of weight-checks
versus examiners, emphasizes
need for caution in the prepara-
iton of photographic guides. In
developing the photographic
guide for this study, sample
plants for both species were pre-
clipped at two-inch height inter-
vals, oven-dried and the growth
form plotted
as height-weight
curves. Similar height-weight
curves were taken from refer-
ences by Crafts (1938) and Caird
(1945), adjusted
to uniform
height and averaged with the
data from plants clipped in the
field. These averages were used
to estimate the heights to clip
the photo plants used in making
the photographic grazed-class
guides for the respective species.
As a check, the oven-dry weights
of the photo plant were plotted
with the other curves.
’In the case of sideoats grama
the curves for the photo guide
and photo plant matched quite
closely. The use of this guide by
the examiners showed a close
correlation with the weight-
check. In the case of black grama,
there was considerable differ-
ence between the photo guide
and the photo plant curve. The
use of this guide resulted in a
highly significant difference be-
tween the weight-check and esti-
mates by the examiners. (Table
3).
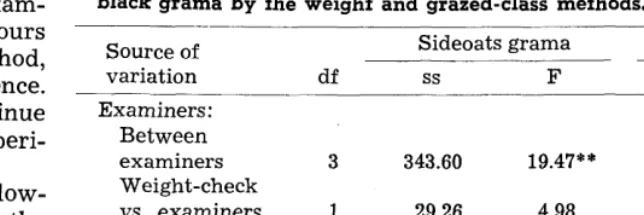
Table 3. Statistical analyses of utilization estimates made on sideoats and black grama by the weight and grazed-class methods.
Source of
variation df
Sideoats grama
ss F
Black grama
ss F
Examiners: Between examiners Weight-check vs. examiners Between reps Error
* Significant difference at 5 percent level ** Highly significant difference at 1 percent level
This points up the need for
close correlation between
the
photographic
guide and the
height-weight curve of the av-
erage plant clipped to make the
photographs. Since this cannot
be determined until after the
photographs have been taken
and the clipped plant oven dried
and weighed, it may mean mak-
ing several sets of photographs
until a close match is obtained.
Another point closely related
to this problem is the question of
how much the growth form of
the guide plant can vary from
the plants being estimated in the
field. This factor is compensat-
ing so considerable variation ap-
pears permissible, particularly
where larger 50- and lOO-esti-
mate samples are taken. Several
guides may need to be developed
for each key species to match
wide year-to-year or site-to-site
variations in growth form. De-
velopment of guides based on av-
erages of local plants within a
given region will reduce the pos-
sibility of variation
such as
might result from using curves
developed for broad geographic
regions or between states.
The adaptability of a guide for
a given situation may be checked
by clipping representative plants
according to the guide classes,
weighing the clipped portions
and calculating the various per-
centages
removed.
Green
weights may be used for quick
field
checks
and oven-dry
weights for more accurate data.
The method also tends to re-
duce errors caused
by variability
in height growth, one of the ma-
jor sources of error in height-
weight methods. In making esti-
mates of utilization
by the
grazed-class method, the growth
form of the plant is used as the
primary guide and visual adjust-
ments for differences in height
can easily be made by the exam-
iner.
Another advantage in the use
of the method is that, while the
estimate of utilization is based on
forage removed, each grazed-
class shows both the degree of
use and the amount of herbage
remaining.
The method also facilitates
estimation of irregular grazing of
plants. Although the guide plants
are clipped to a certain height
and may not represent the nor-
mal pattern of grazing, they do
provide a visual picture of the
volume by grazed-classes and
serve as a guide to the examiner
in estimating irregular use of the
plant, such as occurs in side-
trimming of leaves or partial-
grazing of seed stalks. This re-
quires judgment on the part of
the examiner but accuracy in-
creases with experience and er-
rors are compensating. Thus the
method is largely free from per-
sonal bias yet allows for experi-
enced judgment on grazing use
of irregularly grazed plants.
trained examiners. He found
that personal bias and inconsis-
tencies of estimates made with-
out benefit of a guide resulted in
highly signif icant variation
among men from day to day and
even on the same plots at dif-
ferent times of the day. Some
individuals tended to remain
high estimators and others low
estimators but there occurred
many exceptions with a given in-
dividual showing
signif icant
inter- and intra-daily variation.
Therefore, the use of a guide f a-
cilitates making of uniform esti-
mates by inexperienced ranchers
and technicians after relatively
little training. However, setting
up and checking the adaptability
of the guide remains a technical
job.
The grazed-class method is
adaptable for use in both admin-
istration and research. Use of
the method on a single dominant
key species with relatively few
estimates provides the rancher
or technician with a simple, fast,
moderately accurate method of
checking the grazing use of a
pasture. On the other hand,
larger samples, taken more fre-
quently on more species, provide
more accurate, statistically ana-
lyzable data for more intensive
studies in both administration
and research.
Many problems remain to be
solved in range utilization. These
include studies on the variability
of proper use factors of various
species under different
range
conditions and different degrees
of use and vigor; the degree of
water development and other
improvements necessary to ob-
tain uniform grazing; the effects
of soil fertility, slope, exposure,
shading and other site factors on
grazing use; regrowth as a factor
in utilization; variations in use
at different seasons and by dif-
ferent classes of livestock and
game; measurement of proper
use on plants with differing
growth forms; and rechecks on
the validity of the key species
and key area concepts.
The
ESTIMATING UTILIZATION
availability of this fast, statis-
tically sound, reasonably accu-
rate method of measuring uti-
lization provides a useful tool to
help solve some of these prob-
lems.
Summary
A grazed-class method of esti-
mating range utilization
com-
bines the advantages of several
systems in use. It is proposed for
use in both administrative and
research phases of range man-
agement.
The method is based on a pro-
cedure which classifies grazed
plants into six grazed-classes -
0, 10, 30, 50, 70 and 90 percent
use. Photographic guides, de-
veloped from height-weight
curves of average local plants,
are used for each key species to
guide the examiner in placing
grazed plants into the grazed-
classes. Representative samples
of 20, 25, 50 or 100 plants, lo-
cated by toe-pace transects, are
estimated for each key species to
determine the percentage
of
grazed plants in each grazed-
class. Current utilization is cal-
culated by multiplying the av-
erage use factor for each grazed-
class by the corresponding per-
centage of grazed plants in each
class and totaling the products.
Based on this percentage of cur-
rent use, plus data on the cow
months grazed and proper use
of the key species, the cow
months remaining and the total
proper use can be estimated by
simple calculations.
The method was tested against
the weight-method
and was
found to be fast, simple, statis-
tically sound and reasonably ac-
curate. Estimates were made on
two species, sideoats grama and
black grama, representing
a
bunchgrass and sodgrass type
growth. After only a few hours
use of the method, statistically
satisfactory estimates were made
by both experienced and inex-
perienced examiners.
The use of photographic guides
makes possible the estimation of
59
utilization based on forage re-
moved (but also shows herbage
remaining) and facilitates judg-
ment of irregular grazing on the
plant. Errors are compensating
and guides can be easily checked
against clipped weights.
The method requires reason-
ably close correlation between
the photographic guide and (1)
the height-weight curve of the
average plant used to make the
guide and (2) the growth form
of the plants estimated in the
field, but permits considerable
variation in height of plants.
The grazed-class
method is
easily adapted to use by ranch-
ers, technicians
or research
workers. Many problems in uti-
lization remain to be solved and
the grazed-class method offers a
tool to help solve these problems.
LITERATURE CITED
BROWN, D. 1954. Methods of survey- ing and measuring vegetation. Commonwealth Bureau of Pas- tures and Field Crops Bulletin 42. Commonwealth Agric. Bur., Farn- ham Royal, Bucks, England. 223 pp. CAIRD, R. W. 1945. Influence of site and grazing intensity on yields of grass forage in the Texas Pan- handle. Jour. Forestry 43: 45-49. CAMPBELL, R. S. 1943. Progress in
utilization standards for western ranges. Wash. Acad. Sci. Jour. 33: 161-169.
COSTELLO, D. F. AND G. E. KLIPPLE. 1939. Sampling intensity in vege- tation surveys made by the square foot density method. Agron. Jour. 31: 800-810.
CRAFTS, E. C. 1938. Height-volume distribution in range grasses. Jour. Forestry 36: 1182-1185.
DASMANN, W. P. 1948. A critical re- view of range survey methods and their application to deer range management. Calif. Fish and Game 34: 189-207.
HEADY, H. F. 1949. Methods of de- termining utilization of range for- age. Jour. Range Mangt. 2:53-63. HEDRICK, D. W. 1958. Proper utiliza- tion-a problem in evaluating the physiological response of plants to grazing use: A review. Jour. Range Mangt. 11: 34-43. Also Oregon Agric. Expt. Sta. Misc. Paper 46. HUMPHREY, R. R. 1949. An analysis
60
SCHMUTZ, HOLT AND MICHAELS
fJOINT COMMITTEE - ASA, ADSA, ASAP, ASRM. 1952. Pasture and range research techniques. Agron. Jour. 44: 39-50.
JOINT COMMITTEE-ASRM, AGRICUL- TURAL BOARD. 1962. Basic problems and techniques in range research. National Academy of Sciences- National Research Council Publ. No. 890. 341 pp.
PARKER, K. W. 1952. New trends in standards for range use. Jour. Forestry 50: 856-859.
PECHANEC, J. F. AND G. D. PICKFORD.
1937. A comparison of some meth- ods used in determining percent- age utilization of range grasses. Jour. Agr. Res. 54: 753-765. SAMPSON, A. W. 1952. Range man-
agement principles and practices. John Wiley 8~ Sons, Inc., New York, N. Y. 570 pp.
SMITH, A. D. 1944. A study of the reliability of range vegetation esti- mates. Ecology 25: 441-448. STODDART, L. A. AND A. D. SMITH. 1943.
Range Management. McGraw-Hill
Book Co., Inc., New York, N. Y. 547 pp.
STODDART, L. A. AND A. D. SMITH. 1955. Range Management, 2nd ed. Mc- Graw-Hill Book Co., Inc., New York, N. Y. 433 pp.
U. S. FOREST SERVICE. 1959. Tech- niques and methods of measuring under-story vegetation. U. S. For- est Service Southern Forest and Southeastern Forest Experiment Stations. Proceedings of a Sym- posium at Tifton, Georgia, October 1958. 174 pp.
Effects of Grazing and Protection on a
Twenty-Year-Old Seeding
D. A. RIEGEL, F. W. ALBERTSON, G. W. TOMANEK AND FLOYD E. KINSINGER
Assistant Professor of Botany, Professor of Botany (Deceased), Professor of Biology and Associate Pro- fessor Botany, Respectively, Fort Hays Kansas State College, Hays, Kansas.
Millions of acres have been
and are being seeded to grass in
the western United States in at-
tempts to restore depleted range
and crop lands. Some areas are
grazed
soon after successful
establishment while others are
protected for periods of time
varying with requirements of
government programs.
Some
areas have been seeded to na-
tive grasses while on others, in-
troduced species are used. Many
questions arise about proper
seeding mixtures and manage-
ment in relation to establish-
ment of permanent high-produc-
ing grasslands.
Long
term
studies are necessary to find an-
swers for these questions.
This paper reports a
survey ‘ofan area seeded to three different
grass mixtures in 1941. Part of
each seeded area has been pro-
tected and a part grazed. There-
fore, an opportunity was pro-
vided to measure the stability,
over a long period of time, of
seeded grassland under grazing
and protection.
Methods of Study
Three different
grass mix-
tures were seeded on an upland
field previously cultivated for
nearly 40 years. The soil is uni-
form and typical of the clay up-
land range site in western Kan-
sas (Table 1). Under natural
conditions the bulk of the climax
native vegetation would be blue
grama
(Bouteloua gracilis),western wheatgrass
(Agropyronsmithii)
and buffalo
grass
(Buchloe dactyloides)
(Albert-
son, 1937). Small amounts of
sideoats grama
(Bouteloua cur-tipendula)
and big and little
bluestem
(Andropogon gerardiand
A. scoparius)are found in
the more favorable mesic loca-
tions on the site.
Part of the field was seeded to
a bluestem mixture which con-
sisted of four pounds of big and
little bluestem, three pounds of
sideoats grama, two pounds of
blue grama and two pounds of
switch grass
(Panicum vir-gatum)
per acre. Another por-
tion of the field was seeded to
blue grama at the rate of 10
pounds per acre. A third portion
was seeded to a mixture of two
pounds of sideoats grama, two
pounds of blue grama and eight
pounds of western wheatgrass.
The three mixtures will be re-
ferred to as the bluestem mix-
ture, blue grama, and wheat-
grass-grama mixture in the order
mentioned above.
Different
methods of seedbed preparation
were used but for the purposes
of the study reported here, the
important fact is that a good
stand was obtained at the end of
two years by all methods.
Three years after seeding, the
area was fenced in with a na-
tive pasture for use by livestock.
The seeded field has been moder-
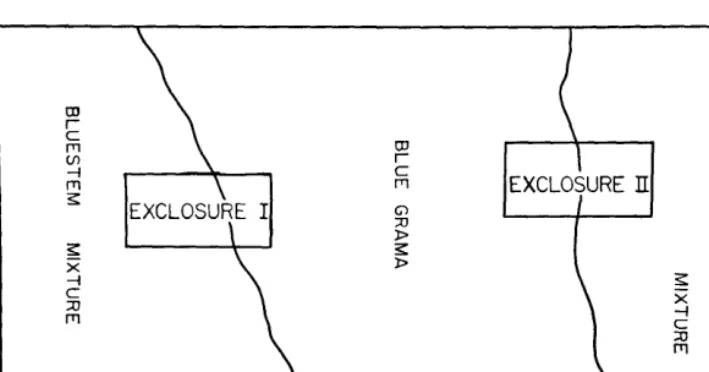
ately grazed for the past 17
years. Two exclosures, 135 feet
long and 40 feet wide, were con-
structed to protect small por-
tions from grazing. One exclos-
ure was constructed across the
ecotone of the blue grama and
bluestem mixture (Exclosure I)
and the other on the border be-
tween blue grama and the wheat-
grass-grama seeding (Exclosure
II) (Figure 1) .
Table 1. Soil profile description of clay uplands site used for seeding three grass mixtures.
Horizon Depth Texture Structure Reaction A1 O-13” silty clay loam weak, granular, none
massive
Bl 13-18” silty clay blocky, platy none B2 18-25” silty clay blocky, massive slight B&a 25-30” silty clay blocky, massive strong
60
SCHMUTZ, HOLT AND MICHAELS
fJOINT COMMITTEE - ASA, ADSA, ASAP, ASRM. 1952. Pasture and range research techniques. Agron. Jour. 44: 39-50.
JOINT COMMITTEE-ASRM, AGRICUL- TURAL BOARD. 1962. Basic problems and techniques in range research. National Academy of Sciences- National Research Council Publ. No. 890. 341 pp.
PARKER, K. W. 1952. New trends in standards for range use. Jour. Forestry 50: 856-859.
PECHANEC, J. F. AND G. D. PICKFORD.
1937. A comparison of some meth- ods used in determining percent- age utilization of range grasses. Jour. Agr. Res. 54: 753-765. SAMPSON, A. W. 1952. Range man-
agement principles and practices. John Wiley & Sons, Inc., New York, N. Y. 570 pp.
SMITH, A. D. 1944. A study of the reliability of range vegetation esti- mates. Ecology 25: 441-448. STODDART, L. A. AND A. D. SMITH. 1943.
Range Management. McGraw-Hill
Book Co., Inc., New York, N. Y. 547 pp.
STODDART, L. A. AND A. D. SMITH. 1955. Range Management, 2nd ed. Mc- Graw-Hill Book Co., Inc., New York, N. Y. 433 pp.
U. S. FOREST SERVICE. 1959. Tech- niques and methods of measuring under-story vegetation. U. S. For- est Service Southern Forest and Southeastern Forest Experiment Stations. Proceedings of a Sym- posium at Tifton, Georgia, October 1958. 174 pp.
Effects of Grazing and Protection on a
Twenty-Year-Old Seeding
D. A. RIEGEL, F. W. ALBERTSON, G. W. TOMANEK AND FLOYD E. KINSINGER
Assistant Professor of Botany, Professor of Botany (Deceased), Professor of Biology and Associate Pro- fessor Botany, Respectively, Fort Hays Kansas State College, Hays, Kansas.
Millions of acres have been
and are being seeded to grass in
the western United States in at-
tempts to restore depleted range
and crop lands. Some areas are
grazed
soon after successful
establishment while others are
protected for periods of time
varying with requirements of
government programs.
Some
areas have been seeded to na-
tive grasses while on others, in-
troduced species are used. Many
questions arise about proper
seeding mixtures and manage-
ment in relation to establish-
ment of permanent high-produc-
ing grasslands.
Long
term
studies are necessary to find an-
swers for these questions.
This paper reports a
survey ‘ofan area seeded to three different
grass mixtures in 1941. Part of
each seeded area has been pro-
tected and a part grazed. There-
fore, an opportunity was pro-
vided to measure the stability,
over a long period of time, of
seeded grassland under grazing
and protection.
Methods of Study
Three different
grass mix-
tures were seeded on an upland
field previously cultivated for
nearly 40 years. The soil is uni-
form and typical of the clay up-
land range site in western Kan-
sas (Table 1). Under natural
conditions the bulk of the climax
native vegetation would be blue
grama
(Bouteloua gracilis),western wheatgrass
(Agropyronsmithii)
and buffalo
grass
(Buchloe dactyloides)
(Albert-
son, 1937). Small amounts of
sideoats grama
(Bouteloua cur-tipendula)
and big and little
bluestem
(Andropogon gerardiand
A. scoparius)are found in
the more favorable mesic loca-
tions on the site.
Part of the field was seeded to
a bluestem mixture which con-
sisted of four pounds of big and
little bluestem, three pounds of
sideoats grama, two pounds of
blue grama and two pounds of
switch grass
(Panicum vir-gatum)
per acre. Another por-
tion of the field was seeded to
blue grama at the rate of 10
pounds per acre. A third portion
was seeded to a mixture of two
pounds of sideoats grama, two
pounds of blue grama and eight
pounds of western wheatgrass.
The three mixtures will be re-
ferred to as the bluestem mix-
ture, blue grama, and wheat-
grass-grama mixture in the order
mentioned above.
Different
methods of seedbed preparation
were used but for the purposes
of the study reported here, the
important fact is that a good
stand was obtained at the end of
two years by all methods.
Three years after seeding, the
area was fenced in with a na-
tive pasture for use by livestock.
The seeded field has been moder-
ately grazed for the past 17
years. Two exclosures, 135 feet
long and 40 feet wide, were con-
structed to protect small por-
tions from grazing. One exclos-
ure was constructed across the
ecotone of the blue grama and
bluestem mixture (Exclosure I)
and the other on the border be-
tween blue grama and the wheat-
grass-grama seeding (Exclosure
II) (Figure 1) .
Table 1. Soil profile description of clay uplands site used for seeding three grass mixtures.
Horizon Depth Texture Structure Reaction A1 O-13” silty clay loam weak, granular, none
massive
Bl 13-18” silty clay blocky, platy none B2 18-25” silty clay blocky, massive slight B&a 25-30” silty clay blocky, massive strong