ClinicoEconomics and Outcomes Research
Changes in quality of care and costs induced
by implementation of a diabetes program
in a social security entity of Argentina
Lorena González1
Jorge F Elgart1
Héctor Calvo2
Juan J Gagliardino1
1Center of Experimental and Applied
Endocrinology, National University of La Plata, La Plata, Argentina; 2School
of Economics and Management of Healthcare Organizations, National University of La Plata, La Plata, Argentina
Correspondence: Lorena González CENEXA – Center of Experimental and Applied Endocrinology (UNLP-CONICET LA PLATA), PAHO/WHO Collaborating Center for Diabetes, School of Medicine, National University of La Plata, 60 y 120, La Plata 1900, Argentina
Tel + 54 221 423 6712 Fax + 54 221 422 2081 Email [email protected]
Purpose: To measure the impact of a diabetes and cardiovascular risk factors program implemented in a social security institution upon short- and long-term clinical/metabolic outcomes and costs of care.
Methods: Observational longitudinal cohort analysis of clinical/metabolic data and resource use of 300 adult male and female program participants with diabetes before (baseline) and 1 and 3 years after implementation of the program. Data were obtained from clinical records (Qualidiab) and the administration’s database.
Results: The implementation of the program in “real world” conditions resulted in an immediate and sustainable improvement of the quality of care provided to people with diabetes incorpo-rated therein. We also recorded a more appropriate oral therapy prescription for hyperglycemia and cardiovascular risk factors (CVRFs), as well as a decrease of events related to chronic complications. This improvement was associated with an increased use of diagnostic and thera-peutic resources, particularly those related to pharmacy prescriptions, not specifically used for the control of hyperglycemia and other CVRFs.
Conclusion: The implementation of a diabetes program in real-world conditions results in a significant short- and long-term improvement of the quality of care provided to people with diabetes and other CVRFs, but simultaneously increased the use of resources and the cost of diagnostic and therapeutic practices. Since controlled studies have shown improvement in quality of care without increasing costs, our results suggest the need to include management-control strategies in these programs for appropriate medical and administrative feedback to ensure the simultaneous improvement of clinical outcomes and optimization of the use of resources. Keywords: management, program evaluation, chronic diseases, diabetes
Introduction
Diabetes is a costly and ever-increasing health problem frequently associated with the development of chronic complications that result in a heavy socioeconomic burden for the health system and society overall.1–3 Cardiovascular complications represent the
major cause of diabetes morbidity, mortality, and costs, and they can be significantly reduced by appropriate control of blood glucose and associated cardiovascular risk factors (CVRFs).1,4–10 However, prevention strategies have not been widely
incor-porated into daily clinical practice,11 and the care provided to people with diabetes
is frequently far from optimal.5,12–16 Consequently, the care of these people usually
consumes 5%–10% of health budgets.17
This situation could be improved by the integration and coordination of interdisci-plinary teams in a structured diabetes program capable of optimizing both effectiveness
Dove
press
O R I G I N A L R E S E A R C H
open access to scientific and medical research
Open Access Full Text Article
ClinicoEconomics and Outcomes Research downloaded from https://www.dovepress.com/ by 118.70.13.36 on 21-Aug-2020
For personal use only.
Number of times this article has been viewed
This article was published in the following Dove Press journal: ClinicoEconomics and Outcomes Research
and resource use. Such an assertion is supported by the significant improvement in several clinical and metabolic indicators of quality of care of people with type 2 diabetes and the decrease in direct medical costs observed after the imple-mentation of Program for the Prevention, Care and Treat-ment of People with Diabetes (PROPAT) in Argentina18,19
and similar initiatives in other countries. PROPAT was a controlled study, but there is no evidence of the efficacy of this type of program in “real world” conditions. Therefore, we considered it would be important to test the effectiveness of a similar program but implemented in a social security health institution of Argentina.
The Argentine health-care system includes three indepen-dent sectors: public, social security, and private (prepaid).20
OSPERYH (Obra Social del Personal de Edificios de Renta y Horizontal) is a health-management organization that belongs to the social security sector. It is organized at national level and provides health coverage to nearly 100,000 people in the city of Buenos Aires.
In order to obtain the information mentioned previ-ously, in June 2005 we implemented a diabetes program in OSPERYH (DPO) that modified the traditional care system of the organization. At that time, general practitioners were responsible for the control and treatment of people with diabetes and the prescription of periodic controls by specialists. The organization had neither specific procedure manuals, medical processes, nor standardized administrative procedures. Furthermore, data from clinical practices, labora-tory tests, drug prescriptions, and hospitalization events were partially recorded at different areas and used for economic and legal purposes rather than as a suitable tool to control the quality of care provided to patients. Equity of health cover-age was poor, since it was determined by a national law that guarantees the provision of “baseline” care instead of care plans meeting real individual needs. Additionally, there were no diabetes-education programs for physicians or patients, with a negligible participation of the latter in control and treatment of their disease.
The DPO introduced the systematization of processes and procedures of care, from the enrollment of participants into the program up to drug supply. In this context, the DPO implemented standards of care, control and treatment, a yearly schedule of visits to the physician’s office, and the per-formance of special practices (electrocardiogram, endoscopy, ergometry, spirometry, fluxometry, holter monitor, radiogra-phy, tomography), and laboratory tests based on international guidelines for good clinical practice. It also incorporated a periodic record of clinical, metabolic, and therapeutic data
and the provision of a personalized check-book to facilitate patient access to clinical care, laboratory tests and different special practices, drugs, and devices. This record system also served to identify the type and amount of resource consumption. All these practices and procedures, as well as the prescription of drugs and supplies for self-control, had 100% coverage. Additionally, the DPO provided diabetes education to physicians and people with diabetes, promot-ing the active participation of the latter in the control and treatment of their disease. Finally, the DPO implemented a system for the continuous monitoring of diabetes care, clinical, metabolic, therapeutic, and economic indicators, and program performance.
In this study, we report the immediate and long-term clini-cal, metabolic, and budget impact of the DPO implemented in noncontrolled conditions in OSPERYH.
Materials and methods
Design
The study represents an observational and longitudinal pro-spective cohort analysis of people with diabetes. We analyzed the performance of procedures, many clinical, metabolic, and therapeutic indicators of quality of care, the rate of resource utilization and associated costs before (baseline) and at 1 and 3 years after implementation of the DPO. For every study period, data were recorded for 12 months. We simultaneously evaluated several OSPERYH indicators of the health-care management process.
The study design and its procedures were approved by the Central Advisory Committee on Bioethics of the National University of La Plata.
Population
People with diabetes were invited to participate in the study by their doctors during their periodic controls, and were incorporated into the DPO after signing the pertinent informed consent. Through this procedure, 1366 affiliates were incorporated into the DPO in the year 2006; three years later, 300 affiliates remained in the program. No significant differences were recorded between completers and dropouts from the point of view of their demographic, clinical, or metabolic characteristics (Table 1). Consequently, we only included and compared data from the 300 patients at baseline and 1 and 3 years after DPO implementation.
Diabetes diagnosis was made using the Latin American Diabetes Association criteria,21 while obesity, hypertension,
and dyslipidemia were diagnosed using the American Diabetes Association,22,23 the Joint National Committee on
Dovepress
González et al
ClinicoEconomics and Outcomes Research downloaded from https://www.dovepress.com/ by 118.70.13.36 on 21-Aug-2020
Prevention, Detection, Evaluation, and Treatment of High Blood Pressure,24 and the National Cholesterol Education
Program25 criteria, respectively. Cardiovascular risk was
assessed with the Second Joint European Task Force guidelines,26 while the degree of metabolic control was
deter-mined using the Latin American Diabetes Association21 and
the International Diabetes Federation27 guidelines.
Inclusion and exclusion criteria
We only incorporated adult male and female OSPERYH participants (age $18 years) from the city of Buenos Aires, Argentina, with diabetes, who had been controlled for their disease for at least 2 years and regularly attended the DPO. People with mental illnesses that affected behavior, alcohol or drug abuse, or who refused to sign the informed consent were excluded from the study.
Data-collection instruments
The annual and semiannual Qualidiab data-collection forms28 and an annual personalized check-book of medical
and laboratory tests and drug prescription were used to mea-sure the following variables: demographic data,
diabetes-education indicators, performance of diagnostic/control procedures, presence of acute and chronic complications (micro/ macrovascular complications), hospitalization rate, and absenteeism. We also recorded clinical and therapeutic indicators of degree of control of hyperglycemia, associated CVRFs, other health conditions, and costs of care (annual consumption of diagnostic and therapeutic resources). All the data recorded were anonymously stored at CENEXA (Center of Experimental and Applied Endocrinology) in a database using SQLyog (Webyog, Santa Clara, CA, USA) software.
Data analysis
The effectiveness of the intervention was measured through changes in: (1) glycated hemoglobin (HbA1c) values, show-ing the degree of metabolic control durshow-ing the last 3 months; (2) fasting blood glucose (FBG) levels; (3) serum lipid profile (total cholesterol and triglyceride levels); and (4) average resource consumption, percentage of performance, and per capita direct medical costs (hospitalizations, medical practices, laboratory tests, visits to the doctor’s office, and consumption of drugs and devices for self-monitoring blood
Table 1 Clinical characteristics and use of resources of the selected sample versus patients who dropped out of the diabetes program in OSPERYH
Baseline P-value
Study sample n = 300
Dropouts n = 1,066
Mean Proportions
Mean ± SD (n) Mean ± SD (n) Clinical/metabolic indicators
BMI (kg/m2) 30.5 ± 5.6 (287) 30.3 ± 5.5 (990) 0.587 –
SBP (mmHg) 131 ± 16 (272) 133 ± 17 (941) 0.087 –
DBP (mmHg) 81 ± 11 (271) 81 ± 11 (938) 0.890 –
FBG (mg/dL) 126 ± 45 (96) 139 ± 57 (405) ,0.05 –
HbA1c (%) 7.9 ± 2.1 (133) 8.2 ± 2.2 (498) 0.159 –
Creatinine (mg/dL) 0.9 ± 0.2 (176) 0.9 ± 0.3 (572) 0.271 –
Proteinuria (mg/dL) 6 ± 3 (40) 6 ± 4 (132) 0.782 –
Total cholesterol (mg/dL) 205 ± 44 (233) 209 ± 45 (821) 0.231 –
HDL-chol (mg/dL)
Women 54 ± 35 (74) 53 ± 19 (106) 0.734 –
Men 50 ± 31 (107) 49 ± 15 (142) 0.657 –
LDL-chol (mg/dL) 119 ± 38 (162) 125 ± 37 (572) 0.073 –
Triglycerides (mg/dL) 182 ± 99 (212) 181 ± 104 (733) 0.901 –
Average consumption, percentage of performance*
Hospitalizations 11.7 ± 9.7 [5.7, 3–9] 10.2 ± 9.8 [7.04, 6–9] 0.595 0.670 Visits to the doctor’s office 9.3 ± 6.6 [98, 96–99] 9.3 ± 7.4 [98, 97–99] 0.966 0.973
Practices 1.9 ± 2.1 [32, 27–37] 1.7 ± 1.7 [28, 26–31] 0.342 0.171
Laboratory tests 15.5 ± 10.0 [90, 87–94] 16.4 ± 10.5 [89, 87–91] 0.189 0.324
Pharmacy 12.8 ± 15.6 [51, 45–57] 15.8 ± 20.5 [43, 42–48] 0.098 0.013
Notes: *Values in brackets: %, 95% CI.
Abbreviations: OSPERYH, Obra Social del Personal de Edificios de Renta y Horizontal; SD, standard deviation; BMI, body mass index; SBP, systolic blood pressure;
DBP, diastolic blood pressure; FBG, fasting blood glucose; HbA1c, glycated hemoglobin; HDL-chol, high-density lipoprotein cholesterol; LDL-chol, low-density lipoprotein cholesterol; CI, confidence interval.
Dovepress Quality and cost of care of a diabetes program
ClinicoEconomics and Outcomes Research downloaded from https://www.dovepress.com/ by 118.70.13.36 on 21-Aug-2020
glucose). All indicators from the 300 selected affiliates were measured at baseline and 1 and 3 years after implementation of the DPO.
Cost-of-care analysis included (1) resource identifica-tion (units of measure and quantities), (2) choice of analysis perspective (social security subsector), inclusion of relevant resources and unit-cost identification, and (3) estimation of total and incremental costs. For the analysis we used the CostIt version 4.4 (WHO, Geneva, Switzerland) software and the WHO-CHOICE methodology proposed by WHO.29
Budget impact was evaluated comparing the noninterven-tion (baseline) versus the intervennoninterven-tion (1- and 3-year) sce-narios. The unit cost of resources was obtained from values of the Nomenclador Asistencial Nacional, Nomenclador Bioquímico Único, and Nomenclador Agremiación Médica Platense. All costs are expressed in Argentine pesos (AR$) for the year 2011.
Descriptive statistics are presented as percentages with 95% confidence intervals (CIs) and means ± standard deviation. Chi-squared testing was performed for all proportions, and Student’s t-test was used for all means. The significance level was set at P, 0.05. All statistical analyses were performed with the Epi-Info 6.4 (CDC, Atlanta, GA, USA) statistical package or SPSS 15.0 (IBM, Armonk, NY, USA).
Results
Population characteristics
Fifty-eight percent of the patients included in the analysis were men, with an average age of 55 years; 8% and 92% of them had type 1 and type 2 diabetes, respectively. Except for FBG, no differences were recorded at any of the parameters tested between completers and dropouts (Table 1).
Clinical and metabolic impact
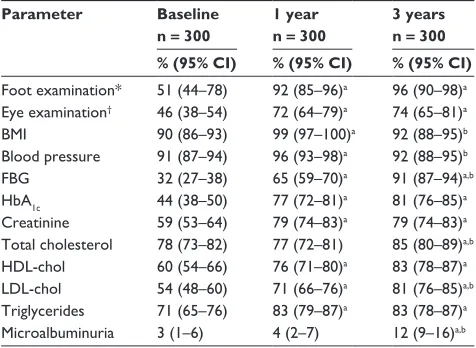
Procedure performance increased significantly 1 year after DPO implementation and continued on an upward trend thereafter, except for body mass index (BMI) and blood pressure control, which declined to baseline values. It is worth noting that the performance of these two procedures was already high at baseline (90% and 91%, respectively; Table 2).
Habits
At baseline, 19% of the sample population consumed tobacco, 21% consumed alcohol, 67% followed a meal plan, and 35% were physically active. These figures did not change significantly 1 and 3 years after DPO implementation, except for a slight increase in physical activity (38%).
Table 2 Changes in the performance of control procedures
Parameter Baseline n = 300
1 year n = 300
3 years n = 300 % (95% CI) % (95% CI) % (95% CI)
Foot examination* 51 (44–78) 92 (85–96)a 96 (90–98)a
Eye examination† 46 (38–54) 72 (64–79)a 74 (65–81)a
BMI 90 (86–93) 99 (97–100)a 92 (88–95)b
Blood pressure 91 (87–94) 96 (93–98)a 92 (88–95)b
FBG 32 (27–38) 65 (59–70)a 91 (87–94)a,b
HbA1c 44 (38–50) 77 (72–81)a 81 (76–85)a
Creatinine 59 (53–64) 79 (74–83)a 79 (74–83)a
Total cholesterol 78 (73–82) 77 (72–81) 85 (80–89)a,b
HDL-chol 60 (54–66) 76 (71–80)a 83 (78–87)a
LDL-chol 54 (48–60) 71 (66–76)a 81 (76–85)a,b
Triglycerides 71 (65–76) 83 (79–87)a 83 (78–87)a
Microalbuminuria 3 (1–6) 4 (2–7) 12 (9–16)a,b Notes: *Baseline n = 210, 1 year n = 98, 3 years n = 117; †baseline n = 170, 1 year n = 144, 3 years n = 118; acompared to baseline, P, 0.05; bcompared to 1 year, P, 0.05. Abbreviations: CI, confidence interval; BMI, body mass index; FBG, fasting blood
glucose; HbA1c, glycated hemoglobin; HDL-chol, high-density lipoprotein cholesterol; LDL-chol, low-density lipoprotein cholesterol.
Clinical and metabolic parameters
Most of the clinical and metabolic parameters improved significantly 1 year after implementation of the DPO, with significant decreases of systolic and diastolic blood pressure, HbA1c, and serum triglyceride levels (Table 3). These improvements were still present 3 years after DPO imple-mentation, except those related to glucose metabolism (FBG and HbA1c), whose values returned almost to those recorded at baseline. In the case of triglyceride levels, the improvement recorded 1 year after was sustained and became even larger 3 years after program implementation.
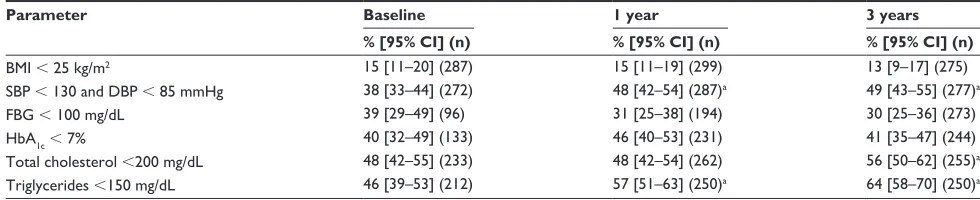
Related to these changes, we also observed a significant beneficial effect of the DPO on the percentage of people attaining target treatment values in several parameters (Table 4). One year after implementation, there was a sig-nificant increase in the percentage of people at target blood pressure, serum total cholesterol, and triglyceride levels; these effects were still evident 3 years later. Conversely, no signifi-cant changes were observed in BMI, FBG, or HbA1c values.
Treatment characteristics
At baseline, 94% of patients were on oral antidiabetic drugs (56% of them were treated with only one drug), while 14% received insulin (Table 5). One year after implementation, we detected a significant increase only in the percentage of people treated for dyslipidemia. Conversely, 3 years after DPO implementation, a significant treatment increment was observed in every condition tested, with the only exception being insulin administration, which showed an increasing but not statistically significant trend.
Dovepress
González et al
ClinicoEconomics and Outcomes Research downloaded from https://www.dovepress.com/ by 118.70.13.36 on 21-Aug-2020
Table 3 Clinical/metabolic indicators
Parameter Baseline 1 year 3 years
Mean ± SD (n) Mean ± SD (n) Mean ± SD (n)
BMI (kg/m2) 30.5 ± 5.6 (287) 30.4 ± 5.5 (264) 30.4 ± 5.4 (275)
SBP (mmHg) 131 ± 16 (272) 127 ± 13.3 (257)a 128 ± 14 (276)a
DBP (mmHg) 81 ± 11 (271) 77,9 ± 10 (256)a 79 ± 9 (277)a
FBG (mg/dL) 126 ± 45 (96) 118 ± 38 (187) 132 ± 40 (277)b
HbA1c (%) 7.9 ± 2.1 (133) 7.3 ± 1.6 (212)a 7.7 ± 1.7 (244)
Creatinine (mg/dL) 0.9 ± 0.2 (176) 0.9 ± 0.2 (219) 0.8 ± 0.4 (236)b
Proteinuria (mg/dL) 6 ± 3 (40) 3 ± 4 (40) 1 ± 6 (152)a,b
Total cholesterol (mg/dL) 205 ± 44 (233) 201 ± 40,8 (233) 197 ± 42 (256)a
HDL-chol (mg/dL)
Women 54 ± 35 (107) 54 ± 15 (85) 52 ± 58 (106)
Men 50 ± 31 (74) 48 ± 11 (121) 46 ± 17 (142)
LDL-chol (mg/dL) 119 ± 38 (162) 119 ± 36 (194) 121 ± 37 (243)
Triglycerides (mg/dL) 182 ± 99 (212) 159 ± 92 (226)a 140 ± 74 (250)a,b
Notes:aCompared to baseline, P, 0.05; bcompared to 1 year, P, 0.05.
Abbreviations: SD, standard deviation; BMI, body mass index; SBP, systolic blood pressure; DBP, diastolic blood pressure; FBG, fasting blood glucose; HbA1c, glycated hemoglobin; HDL-chol, high-density lipoprotein cholesterol; LDL-chol, low-density lipoprotein cholesterol.
Table 4 Percentage of people who achieved treatment target values of clinical and metabolic parameters
Parameter Baseline 1 year 3 years
% [95% CI] (n) % [95% CI] (n) % [95% CI] (n)
BMI , 25 kg/m2 15 [11–20] (287) 15 [11–19] (299) 13 [9–17] (275)
SBP , 130 and DBP , 85 mmHg 38 [33–44] (272) 48 [42–54] (287)a 49 [43–55] (277)a
FBG , 100 mg/dL 39 [29–49] (96) 31 [25–38] (194) 30 [25–36] (273)
HbA1c, 7% 40 [32–49] (133) 46 [40–53] (231) 41 [35–47] (244)
Total cholesterol ,200 mg/dL 48 [42–55] (233) 48 [42–54] (262) 56 [50–62] (255)a
Triglycerides ,150 mg/dL 46 [39–53] (212) 57 [51–63] (250)a 64 [58–70] (250)a Notes:aCompared to baseline, P, 0.05; compared to 1 year, P, 0.05.
Abbreviations: CI, confidence interval; BMI, body mass index; SBP, systolic blood pressure; DBP, diastolic blood pressure; FBG, fasting blood glucose; HbA1c, glycated hemoglobin.
Related to this, we observed a marked tendency to use combined therapy rather than monotherapy, particularly in the cases of hyperglycemia and high blood pressure.
Complication-related events
The number of people with at least one event related to chronic complications showed a nonsignificant decrease from 45% to 42% 3 years after DPO implementation. These complication-related events included microangiopathic (blindness, chronic renal failure with replacement therapy, peripheral neuropathy, nephropathy, orthostatic hypotension, and erectile dysfunction) and macroangiopathic (acute myo-cardial infarction, stroke, angor, lower-limb claudication, and revascularization) complications.
Economic impact
The percentage of people who had at least one hospitalization event increased significantly 1 year after implementation of the DPO, but it was no longer observed 3 years after implementa-tion (Table 6). The same trend was recorded in people who
per-formed at least one special practice, but in this case the change was still evident 3 years later. Laboratory test performance did not change significantly 1 year after implementation, but it increased significantly 3 years after implementation.
The average number of visits to the doctor’s office (either clinicians or specialists) increased significantly 1 year after implementation and remained high 3 years later; this increase was associated with a significant increase in costs in both study periods. However, visits specifically related to diabetes and CVRFs (medical clinic, nutrition, cardiology, and diabetology) increased less than those due to unrelated causes (43% and 71%, respectively).
At baseline, the annual per capita cost was AR$4,657 and had the following distribution: hospitalization events, 59%; visits to the doctor’s office, 18%; pharmacy, 16%; laboratory test, 12%; medical practices, 3% (Table 6). This cost increased at the other two study points (AR$7,139 and AR$8,437 1 year and 3 years later, respectively), having an uneven distribution: hospitalizations, 9.5%; visits to the doctor’s office, 48%; pharmacy, 432%. Interestingly, the
high-Dovepress Quality and cost of care of a diabetes program
ClinicoEconomics and Outcomes Research downloaded from https://www.dovepress.com/ by 118.70.13.36 on 21-Aug-2020
Table 5 Type of diabetes and CVRF treatment
Parameter Baseline 1 year 3 years
% [95% CI] (n) % [95% CI] (n) % [95% CI] (n)
OADs 94 [90–97] (237) 93 [90–96] (265) 97 [94–99] (238)b
Monotherapy 56 [49–62] 49 [42–55] 40 [34–47]a,b
Combined therapy ($2 drugs) 44 [38–51] 51 [45–58] 60 [53–66]a,b
Insulin 14 [11–19] (300) 16 [12–20] (300) 18 [14–23] (300)
Hypertension 68 [62–74] (242) 75 [69–80] (256) 75 [70–80] (277)
Monotherapy 65 [58–73] 63 [56–70] 52 [46–60]a,b
Combined therapy ($2 drugs) 35 [27–42] 37 [30–44] 48 [41–54]a,b
Dyslipidemia 39 [33–46] (224) 48 [42–55] (231)a 54 [48–61] (261)a
Monotherapy 92 [84–96] 97 [93–99] 91 [85–95]b
Combined therapy ($2 drugs) 8 [4–16] 3 [1–7] 9 [5–15]b
Notes:aCompared to baseline, P, 0.05; bcompared to 1 year, P, 0.05.
Abbreviations: CVRF, cardiovascular risk factor; CI, confidence interval; OADs, oral antidiabetic drugs.
Table 6 Average consumption, percentage of performance, and per capita cost in local currency (AR$)
Parameter Cost per capita
Baseline 1 year 3 years
Mean ± SD (%) (AR$) Mean ± SD (%) (AR$) Mean ± SD (%) (AR$)
Hospitalizations* 11.7 ± 9.7 2,528 9 ± 10.6 1,944 12.8 ± 11.2 2,768
(5.7) [3–9] (11.4) [4–9]a (7.3) [5–11]
Practices* 1.9 ± 2.1 116 1.9 ± 1.6 128 1.8 ± 1.9 110
(32) [27–37] (49) [44–55]a (37) [32–43]b
Laboratory tests* 15.5 ± 10.0 567 15.5 ± 8.1 542 18.8 ± 10.3a,b 759
(91) [87–94] (94) [90–96] (96) [9–98]a
Visits to the doctor’s office*
9.3 ± 6.6 752 13.5 ± 7.9a 1,095 13.7 ± 7.9a 1,110
(98) [96–99] (96) [94–98] (100) [98–100]a,b
Diabetes and CVRF 7.0 ± 4.7 577 10.6 ± 4.9 248 10.0 ± 4.8a 815
Other 2.1 ± 3.3 175 4.6 ± 4.4 847 3.6 ± 5.0a 295
Pharmacy* 12.8 ± 15.6 694 55.6 ± 31.6a 3,430 54.1 ± 29a 3,690
(51) [45–57] (93) [89–95]a (97) [95–98]a,b
Dyslipidemia 1.8 ± 1.4 37 4.3 ± 3.4 223 3.6 ± 2.8a 207
Diabetes 4.1 ± 4.7 149 13.6 ± 8.8 874 12.0 ± 7.6a 1,078
Hypertension 3.2 ± 3.9 88 9.0 ± 6.9 320 9.5 ± 7.3a 356
Other drugs and supplies 7.1 ± 8.0 421 26.5 ± 15.2 2,012 25.9 ± 14.9a 2,049
Total 4,657 7,139 8,437
Notes: *Between parentheses percentage of people who had at least one: hospitalization; specialized practice; laboratory practice; visit to the doctors’ office; drug to treat
diabetes, hypertension or dyslipidemia between brackets, 95% CI; n = 300; acompared to baseline, P, 0.05; bcompared to 1 year, P, 0.05. Abbreviations: CVRF, cardiovascular risk factor; CI, confidence interval; AR$, Argentine pesos.
est increase in visits to the doctor’s office corresponded with unrelated causes (68%) rather than those related to diabetes and CVRFs (41%).
The pharmacy per capita cost increased significantly (almost fivefold) from baseline to the other two observational periods (drug and supply group distribution: diabetes, 21%; dyslipidemia, 37%; hypertension, 13%; other pathologies, 61%). Such distribution changed at the two other post-DPO implementation periods, the largest being that related to other pathologies (56%), followed by diabetes (29%), hypertension (10%), and dyslipidemia (6%).
Discussion
Reported evidence shows that implementation of controlled diabetes prevention and treatment programs can simultane-ously improve quality of care and decrease direct medical costs. In our country, the implementation of PROPAT, an example of this type of controlled program, also showed such a dual beneficial impact.18,19
Implementation of the DPO under real-world conditions clearly demonstrated a significant improvement in the per-formance of most medical procedures and laboratory tests 1 year later; in most cases, the effect was sustained 3 years
Dovepress
González et al
ClinicoEconomics and Outcomes Research downloaded from https://www.dovepress.com/ by 118.70.13.36 on 21-Aug-2020
later (Table 2). These data represent indirect evidence of quality-of-care improvement.30 Interestingly, despite the
significant increase in procedure performance, none of the values reached 100% either 1 or 3 years after DPO imple-mentation, even when costs were fully covered by the DPO. Similar data were recorded with PROPAT,18,19 thus showing
how difficult it is to remove long-established inappropriate routines.
The DPO data also showed a significant improvement in most of the clinical/metabolic parameters evaluated 1 year after its implementation; though of a lower magnitude, these changes were comparable to those recorded in PROPAT.18,19
It can be argued that the small magnitude of improvement in some parameters could not have clinical significance, but they were however associated with a significant decrease in the number of events related to both micro- and macroangiopathic complications. Such association does not mean that chronic complications were reversed; rather, that the intervention was sufficient to prevent the development of complication-related events. The facts that every 10% decrease in HbA1c reduces the risk of developing microalbuminuria (20%), retinopathy (56%), and its progression (64%),31 and that a 10 mmHg
decrease in blood pressure also reduces the development of such complication-related events,32 would account for our
current data. It should be noted that the beneficial impact of the DPO remained constant after the 3-year implementa-tion, except for FBG and HbA1c levels. Moreover, further improvement was observed in creatinine, total cholesterol, and triglyceride levels during the last study period.
Since the aforementioned favorable changes were not accompanied by similar changes in the percentage of people with overweight/obesity, we could assume that improve-ments in care quality were more related to increases in drug prescription/consumption than to the adoption of healthy habits. The fact that implementation of the DPO induced a significant and sustained increase in overall drug consump-tion and a shift from monotherapy towards combined therapy for the control of hyperglycemia, blood pressure, and dys-lipidemia lends support to this assumption.
The estimation of total medical costs showed that unlike PROPAT, where the per capita cost of care decreased significantly,18,19 it increased by 81% after implementation
of the DPO. This increase was accompanied by a change in cost composition at the two other study periods: while at baseline, the highest percentage corresponded to hospitaliza-tions, 1 and 3 years after implementation the predominant position was occupied by drug costs. The use of combined therapy rather than monotherapy to control hyperglycemia
and associated CVRFs, as well as the increase in insulin prescription that demands a larger use of strips for self-monitoring blood glucose control, would explain the change in cost composition. This fact would also suggest that the DPO promoted a transfer of economic resources from reha-bilitation to prevention practices.
On the other hand, the increased use of resources (number of visits to the doctor’s office and pharmacy consumption; Table 5) was not caused by the control and treatment of diabetes or the associated CVRFs. One possible explanation is that the higher number of monitoring and laboratory tests performed probably facilitated the identification of other dysfunctions not perceived previously and therefore not treated (Table 4).
Altogether, our data suggest that outcomes of controlled and real-world diabetes programs are not fully the same: while national and international evidence has proved that the imple-mentation of the former improves quality of care and simul-taneously reduces costs,18,33–36 the latter, in this case the DPO,
improves quality of care but increases costs significantly. This dissociation could be ascribed to an inappropriate management and control of the program’s implementation, which allowed an irrational use of resources, namely a higher number of laboratory tests and drug prescriptions and a higher doctor/specialist visit rate. Reported evidence has shown that this undesirable side effect can be avoided by implementing control mechanisms to optimize the use of resources.16,31 These
mechanisms, automatically included in controlled studies, are not necessarily present in real-world trials. One indirect piece of evidence that this was the case in this study was the high patient dropout rate observed in the DPO.
The role of program management is frequently under-scored, as shown by the fact that specific indicators are not easily identified in the evaluation process. We must admit, however, that implementation of careful planning to ensure a fluid interaction among key members of the institution, program managers, and health care professionals is not an easy task. In this regard, efficient management-control strate-gies should include audits of the medical and administrative processes at every step of the program’s implementation, ie, from participant enrollment, scheduled doctor’s visits, and practice performance up to drug supply. In this context, one coordinator should take care of the program and the audit outcomes, and introduce adjustments in the core strategies to optimize medical and economic results. These adjustments should include activities to improve patient adherence, such as reminders to attend medical visits or perform laboratory tests. Additionally, the development of continuous
diabetes-Dovepress Quality and cost of care of a diabetes program
ClinicoEconomics and Outcomes Research downloaded from https://www.dovepress.com/ by 118.70.13.36 on 21-Aug-2020
education activities for physicians and patients should be closely followed up.
In brief, our data also show that in a real-world context, only a suitable combination of medical and management strategies would simultaneously improve the quality and reduce the cost of care of people with diabetes.
Limitations
Despite the novelty of the data provided by our study, some of its characteristics limit its power and force us to interpret our results with caution, namely: (1) this was not a population study, ie, it only represents a sample of people with diabe-tes who received care in one organization of the Argentine social security system and who volunteered to participate in the study, the latter condition certainly introducing a bias; (2) data are presented in a descriptive way after a simple statistical analysis that included the control of value distribu-tion before applying a specific test, but without any special study, such as potential covariate influence; and (3) although several authors have shown the importance of perception of quality of life among patients with diabetes,37 we did not
evaluate the issue in our study.
Beyond these limitations, the data provide a clear example of the difficulties of reproducing a controlled study in real-world conditions, and consequently of obtaining identical outcomes; these difficulties appeared even when the study was implemented by the same research group and in a compa-rable health-care setting. Further, our results serve to identify barriers and constraints that need to be carefully considered to overcome their negative influence.
Conclusion
Our results show that implementation of the DPO in real-world conditions results in a significant and sustainable improve-ment of the quality of care provided to people with diabetes incorporated therein. This improvement was associated with an increased use of diagnostic and therapeutic resources, with a consequent negative impact upon their cost. Since controlled studies have shown that quality of care can be improved without increasing care costs, our results reinforce the need to include effective management control in real-world diabetes programs to allow appropriate medical and administrative feedback to ensure the simultaneous improvement of clinical outcomes and resource-use optimization.
Acknowledgments
This study was partly supported by a Ministry of Health Carrillo-Oñativia fellowship to LG. The authors are grateful
to E Rucci for informatics support, JE Caporale for his use-ful comments and suggestions, and A Di Maggio for careuse-ful manuscript editing prior to submission. JFE is researcher of the Health Economics Research Unit at CENEXA, HC is director of the School of Economics and Management of Healthcare Organizations at the National University of La Plata, LG is a research fellow of the National University of La Plata, and JJG is a member of the CONICET research council and director of CENEXA.
Disclosure
The authors report no conflicts of interest in this work.
References
1. Williams R, Van Gaal L, Lucioni C; CODE-2 Advisory Board. Assessing the impact of complications on the costs of type II diabetes.
Diabetologia. 2002;45(7):S13–S17.
2. Morsanutto A, Berto P, Lopatriello S, et al. Major complications have an impact on total annual medical cost of diabetes: results of a database analysis. J Diabetes Complications. 2006;20(3):163–169.
3. Vivian EM. Type 2 diabetes in children and adolescents – the next epidemic? Curr Med Res Opin. 2006;22(2):297–306.
4. [No authors listed]. Intensive blood-glucose control with sulphonylureas or insulin compared with conventional treatment and risk of complica-tions in patients with type 2 diabetes (UKPDS 33). UK Prospective Diabetes Study (UKPDS) Group. Lancet. 1998;352(9131):837–853. Erratum in: Lancet. 1999;354(9178):602.
5. [No authors listed]. The effect of intensive treatment of diabetes on the development and progression of long-term complications in insulin-dependent diabetes mellitus. The Diabetes Control and Complications Trial Research Group. N Engl J Med. 1993;329(14):977–986. 6. Gaede P, Vedel P, Larsen N, Jensen GV, Parving HH, Pedersen O.
Multifactorial intervention and cardiovascular disease in patients with type 2 diabetes. N Engl J Med. 2003;348(5):383–393.
7. Gray A, Raikou M, McGuire A, et al. Cost effectiveness of an intensive blood glucose control policy in patients with type 2 diabetes: economic analysis alongside randomized controlled trial (UKPDS 41). United Kingdom Prospective Diabetes Study Group. BMJ. 2000;320(7246): 1373–1378.
8. Gray A, Clarke P, Farmer A, Holman R; United Kingdom Prospective Diabetes Study (UKPDS) Group. Implementing intensive control of blood glucose concentration and blood pressure in type 2 diabetes in England: cost analysis (UKPDS 63). BMJ. 2002;325(7369):860. 9. Klonoff DC, Schwartz DM. An economic analysis of interventions for
diabetes. Diabetes Care. 2000;23(3):390–404.
10. Holman RR, Paul SK, Bethel MA, Matthews DR, Neil HA. 10-Year follow-up of intensive glucose control in type 2 diabetes. N Engl J Med. 2008;359(15):1577–1589.
11. Karter AJ, Stevens MR, Herman WH, et al. Out-of-pocket costs and diabetes preventive services: the Translating Research Into Action for Diabetes (TRIAD) study. Diabetes Care. 2003;26(8):2294–2299. 12. Beckles GL, Engelgau MM, Narayan KM, Herman WH, Aubert RE,
Williamson DF. Population-based assessment of the level of care among adults with diabetes in the US Diabetes Care. 1998;21(9): 1432–1438.
13. Saaddine JB, Engelgau MM, Beckles GL, Gregg EW, Thompson TJ, Narayan KM. A diabetes report card for the United States: quality of care in the 1990s. Ann Intern Med. 2002;136(8):565–574.
14. Renders CM, Valk GD, de Sonnaville JJ, et al. Quality of care for patients with type 2 diabetes mellitus – a long-term comparison of two quality improvement programmes in The Netherlands. Diabet Med. 2003;20(10):846–852.
Dovepress
González et al
ClinicoEconomics and Outcomes Research downloaded from https://www.dovepress.com/ by 118.70.13.36 on 21-Aug-2020
ClinicoEconomics and Outcomes Research
Publish your work in this journal
Submit your manuscript here: http://www.dovepress.com/clinicoeconomics-and-outcomes-research-journal
ClinicoEconomics & Outcomes Research is an international, peer-reviewed open-access journal focusing on Health Technology Assess-ment, Pharmacoeconomics and Outcomes Research in the areas of diagnosis, medical devices, and clinical, surgical and pharmacological intervention. The economic impact of health policy and health systems
organization also constitute important areas of coverage. The manu-script management system is completely online and includes a very quick and fair peer-review system, which is all easy to use. Visit http://www.dovepress.com/testimonials.php to read real quotes from published authors.
15. McGlynn EA, Asch SM, Adams J, et al. The quality of health care delivered to adults in the United States. N Engl J Med. 2003;348(26): 2635–2645.
16. American Diabetes Association. Clinical Practice Recommendations 2005. Diabetes Care. 2005;28 Suppl 1:S1–S79.
17. Laing W, Williams DRR. Diabetes: A Model for Health Care Management. London: Office of Health Economics; 1989.
18. Gagliardino JJ, Olivera E, Etchegoyen GS, et al. PROPAT: a study to improve the quality and reduce the cost of diabetes care. Diabetes Res Clin Pract. 2006;72(3):284–291.
19. Gagliardino JJ, Olivera EM, Etchegoyen GS, et al. Control y prevención secundaria para personas con diabetes: impacto de la implementación de un programa de atención (PROPAT). [Control and secondary pre-vention for people with diabetes: impact of the implementation of a healthcare program (PROPAT)]. Rev Soc Argent Diabetes. 2001;35(2): 77–86.
20. Araújo GTB, Caporale JE, Stefani S, Pinto D, Caso A. Is equity of access to health care achievable in Latin America? Value Health. 2011; 14(5 Suppl 1):S8–S12.
21. Asociación Latinoamericana de Diabetes. Guías ALAD 2000 para el diagnóstico y manejo de la diabetes mellitus tipo 2 con medicina basada en evidencia. [ALAD Guidelines for the diagnosis control and treatment of type 2 diabetes mellitus with evidence-based medicine]. Rev Asoc Latinoam Diab. 2000;Suppl 1:1–70.
22. [No authors listed]. Report of the Expert Committee on the Diagnosis and Classification of Diabetes Mellitus. Diabetes Care. 1997;20(7): 1183–1197.
23. Expert Committee on the Diagnosis and Classification of Diabetes Mellitus. American Diabetes Association: clinical practice recom-mendations 2002. Diabetes Care. 2002;25 Suppl 1:S1–S147. 24. Chobanian AV, Bakris GL, Black HR, et al. The Seventh Report of
the Joint National Committee on Prevention, Detection, Evaluation, and Treatment of High Blood Pressure: the JNC 7 report. JAMA. 2003;289(19):2560–2572.
25. Expert Panel on Detection, Evaluation, and Treatment of High Blood Cholesterol in Adults. Executive Summary of the Third Report of The National Cholesterol Education Program (NCEP) Expert Panel on Detec-tion, EvaluaDetec-tion, And Treatment of High Blood Cholesterol In Adults (Adult Treatment Panel III). JAMA. 2001;285(19):2486–2497.
26. [No authors listed]. Prevention of coronary heart disease in clinical practice. Recommendations of the Second Joint Task Force of European and other Societies on coronary prevention. Eur Heart J. 1998;19(10): 1434–1503.
27. International Diabetes Federation, European Diabetes Policy Group.
Guidelines for Diabetes Care:A Desktop Guide to Type 2 Diabetes Mellitus. Brussels: IDF; 1999.
28. Gagliardino JJ, de la Hera M, Siri F; Grupo de Investigación de la Red QUALIDIAB. Evaluation of the quality of care for diabetic patients in Latin America. Rev Panam Salud Publica. 2001;10(5):309–317. Spanish.
29. Adam T, Aikins M, Evans D. Cost It [software]. Available from: http:// www.who.int/choice/toolkit/cost_it/en. Accessed May 8, 2013. 30. Ho M, Marger M, Beart J, Yip I, Shekelle P. Is the quality of diabetes
care better in a diabetes clinic or in a general medicine clinic? Diabetes Care. 1997;20(4):472–475.
31. Cost effectiveness analysis of improved blood pressure control in hypertensive patients with type 2 diabetes: UKPDS 40. UK Prospective Diabetes Study Group. BMJ. 1998;317(7160):720–726.
32. [No authors listed]. Tight blood pressure control and risk of macrovascular and microvascular complications in type 2 diabetes: UKPDS 38. UK Prospective Diabetes Study Group. BMJ. 1998; 317(7160):703–713.
33. Gagliardino JJ, Etchegoyen G; PEDNID-LA Research Group. A model educational program for people with type 2 diabetes: a cooperative Latin American implementation study (PEDNID-LA). Diabetes Care. 2001;24(6):1001–1007.
34. Gagliardino JJ, Olivera EM, Etchegoyen GS, González C, Guidi ML. Evaluation and cost of the health care process of diabetic patients.
Medicina (B Aires). 2000;60(6):880–888. Spanish.
35. Clark CM Jr, Snyder JW, Meek RL, Stutz LM, Parkin CG. A systematic approach to risk stratification and intervention within a managed care environment improves diabetes outcomes and patient satisfaction.
Diabetes Care. 2001;24(6):1079–1086.
36. Vinicor F. The public health burden of diabetes and the reality of limits.
Diabetes Care. 1998;21 Suppl 3:C15–C18.
37. Maatouk I, Wild B, Wesche D, et al. Temporal predictors of health-related quality of life in elderly people with diabetes: results of a German cohort study. PLoS One. 2012;7(1):e31088.
Dovepress
Dove
press
Quality and cost of care of a diabetes program
ClinicoEconomics and Outcomes Research downloaded from https://www.dovepress.com/ by 118.70.13.36 on 21-Aug-2020