c
Owned by the authors, published by EDP Sciences, 2012
Effects of microstructure and shock loading conditions on the damage
behavior of polycrystalline copper
J.P. Escobedo
1, E.K. Cerreta
1, D. Dennis-Koller
2, B.M. Patterson
3, R.A. Lebensohn
1,
and C.A. Bronkhorst
41MST-8, Los Alamos National Laboratory, 87545, Los Alamos, NM, USA 2WX-9, Los Alamos National Laboratory, 87545, Los Alamos, NM, USA 3MST-7, Los Alamos National Laboratory, 87545, Los Alamos, NM, USA 4T-3, Los Alamos National Laboratory, 87545, Los Alamos, NM, USA
Abstract. A suite of plate-impact experiments have been conducted to determine the dominant factors in dynamic damage evolution in uniaxial strain tensile (spall) experiments. The first group of experiments addresses the effect of microstructure by using copper samples with varying grain sizes while maintaining similar loading conditions (peak compressive stress∼1.5 GPa). In a second set, the density of grain boundaries in copper samples and the compressive stress (∼1.6 GPa) were held constant while the tensile loading characteristics were tailored by controlling the geometry of flyers and targets. For similar loading conditions, the damage fields were observed to depend on the grain size: void growth and coalescence were observed to dominate the damage behavior in samples with either small (30µm) or large grain size (200µm); whereas in samples with intermediate grain size (60 and 100µm), most of the damage was restricted to individual voids. For the second portion of the study the characteristics of the damage fields were observed to strongly depend on the characteristics of the tensile pulse. In this case, an increasing large plastic dissipation, in the form of grain misorientation, and more advanced stages of damage were observed in the samples deformed at lower tensile stress rates.
1 Introduction
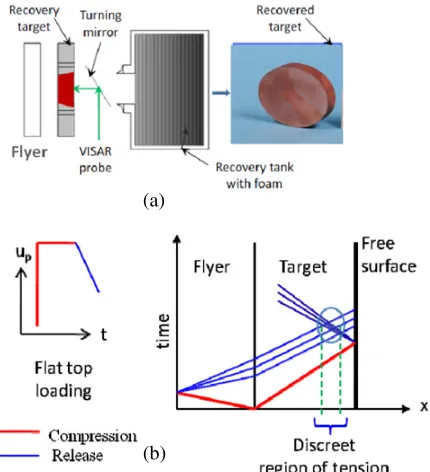
In the current work a suite of plate impact experiments have been conducted to individually assess the effects of microstructure and shock loading profile on the ductile damage evolution of high purity copper in incipient spall experiments. The plate impact experiment consists of a single monolithic flyer launched against a sample target (Figure 1(a). Upon impact, an initial shock compressive state is generated in the sample for durations on the order of less than a microsecond. Then, as the sample decompresses from the shocked state, release waves travel from the free surfaces towards the interior of the target and their interaction subjects a region of the specimen to tensile stresses (Figure 1(b)). If the tensile stresses are high enough, damage in ductile materials is created by the nucleation, growth and coalescence of voids; ultimately forming a fracture zone within the target termed spall region [1]. The real-time response in these experiments at sub-microsecond time-scales is normally achieved by measurement of the free surface velocity of the targets, a task performed by means of velocity interferometry: ve-locimetry interferometer for any surface reflector (VISAR) [2] or photon Doppler velocimetry (PDV) systems [3]. Then by use of the Hugoniot equation of state of the specific material being studied, the mechanical state, i.e. the stress and damage states, can be extracted.
An abundant body of literature exists regarding the effect of the microstructure on the spall response of ma-terials. The pioneering studies on this subject date back to the classical works carried out at the Stanford Research Institute (SRI) by Seaman and Curran [5, 6], followed by many studies [7–17]. However, most of the cited work
(a)
(b)
Fig. 1.(a) Schematic of a plate impact experiment. (b) up-t and x-t diagrams showing the loading path experienced by the target in a plate impact experiment.
has primarily focused on the effects of microstructure on pull-back measurements in experiments in which the sam-ple experienced comsam-plete fracture. Under these conditions many parameters and mechanisms (i.e. shock hardening, void nucleation, growth and coalescence) are intertwined that preclude the assessment of individual contributions from specific material characteristics.
In addition, work to date shows that spall is a complex process also strongly influenced by the dynamic loading profile or shock wave shape imparted to the specimen. For instance, Dennis-Koller et al. [10] showed that for copper the damage fields observed in the deformed samples are sensitive to the type of loading. Specimens loaded with a standard square-wave profile at a peak stress of 8 GPa, display damage with sufficient ductile void coalescence that results in complete sample separation. In contrast, the samples shock-loaded with a triangle-wave to the same peak stress of 8 GPa, display void nucleation with little coalescence.
Furthermore, while studies have investigated the influ-ence of the individual characteristics of the shock wave shape such as rise time, pulse duration, peak stress and release rate; the effect of the tensile loading shock-wave profile is not systematically addressed. Changes in the tensile pulse shape significantly affect the volume of ma-terial being sampled in tension. The size of this volume is inherently coupled with microstructural length scales in a specimen and can render different damage fields observed in recovered samples.
Therefore, the main objective addressed in this study is to decouple and elucidate the effects of microstructural details and loading kinetics on the fundamental mecha-nisms of void nucleation, growth, and coalescence. The emphasis is on tracking the microstructural evolution at early stages of damage. For this purpose, plate impact experiments are performed on high-purity copper samples and carried out at low peak compressive stresses, on the order of∼1.5 GPa, such that the tensile stresses developed within the target material during the experiment is not sufficient to cause complete separation. Then quantitative metallographic analyses are utilized to investigate the dam-age state. This is the focus of this paper: the examination of the final damage state developed in the target under the different experimental conditions. The damage fields are characterized by means of optical and electron backscatter diffraction (EBSD) microscopy as well as x-ray micro-tomography. The combination of these experimental tech-niques leads to a more comprehensive understanding of the damage evolution that allows us to correlate these observa-tions with likely deformation mechanisms, as presented in the last part of this article.
2 Experimental
2.1 Target material
All targets are prepared from fully annealed 99.999% pure oxygen-free high-conductivity (OFHC) copper. The sam-ples are annealed under vacuum at specific temperatures and times to produce microstructures with average grain sizes in the 30–200µm range. The results of the complete metallographic characterization have been reported else-where [17]. It should be noted that both the grain boundary density and the distribution of the grain boundary type are strictly controlled. The fraction of boundaries with misorientations of 60◦, that fulfill the specialΣ3 boundary criteria, are held to value of 0.65% for all cases.
2.2 Plate impact experiments
Plate impact experiments were conducted using a smooth bore 78 mm light gas gun. Figure 1(a) shows a schematic of the experimental configuration used. The copper tar-gets were prepared as circular disks that were 15 mm in diameter and of varying thickness ranging from 2 to 5 mm, depending on the purpose of a given experiment. The copper samples were machined with a 7◦ taper and then pressed fit into target assemblies formed by three con-centric momentum trapping rings to mitigate perturbations from edge release waves. The rings were made of copper to ensure similar mass impedance across the target assembly. Diagnostic pins are positioned around the perimeter of the target assembly to measure the flyer velocity, tilt, and to trigger diagnostic equipment. Velocity profiles were obtained using a VISAR probe mounted 90◦ off of the shock direction axis to prevent any subsequent impact of the target with the probe. Further experimental details are can be found in [9, 10, 17].
For the first group of experiments a well characterized loading condition was chosen so that kinetic aspects of the tensile stress profile remained consistent for all experi-ments. For this purpose, z-cut quartz flyers with a nominal thickness of 2 mm were used to ensure that a single shock wave was produced in the stress range of interest to this study. For the second set of experiments, copper flyers with tailored thicknesses were utilized to achieve a given tensile pulse profile, i.e. stress rate and size of the region under tension. Because the characteristics of tensile state cannot be experimentally accessed, one-dimensional wave propagation calculations were performed to determine the kinetic aspects of the tensile pulse as function of the inter-action of the release waves, which in turn is a function of flyer and target thicknesses. The details of the experimental design to achieve a given tensile profile are discussed in a complementary article by Dennis-Koller [18]. Of concern in this paper are the microstructures of the targets that were tailored to generate a similar grain boundary (GB) density over the area subjected to the tensile stress pulse.
For every experimental condition, experiments have been performed between two and four times to test repeata-bility as well as generate statistically accurate measure-ments of damage distributions. A group of representative tests for each experimental condition is listed in Table 1 LabelArefer to the group of experiments aimed at probing microstructural effects, label B correspond to the set of experiments probing tensile rate effects.
2.3 Post-impact characterization
Table 1.Experimental parameters for the plate impact experiments.
Sample Grain Flyer Compressive Tensile
Exp. ID thickness size Material Thickness Velocity stress rate
(mm) (µm) (mm) (m/s) (GPa) (GPa/µs)
1-A 4.0 30 Quartz 2.0 134 1.55 18
2-A 4.0 60 Quartz 2.0 133 1.54 18
3-A 4.0 100 Quartz 2.0 131 1.52 18
4-A 4.0 200 Quatiz 2.0 131 1.52 18
1-B 5.0 150 Copper 2.5 91 1.62 6
2-B 4.0 100 Copper 1.5 89 1.59 19
3-B 3.0 60 Copper 1.5 90 1.61 22
4-B 3.0 100 Copper 1.0 90 1.61 27
5-B 2.0 100 Copper 1.0 90 1.61 34
Note:Agroup addresses microstructural effects,Bgroup addresses tensile rate effects.
Fig. 2.Left : Bright field optical images of the cross sections of selected spalled samples. Right: processed images used for the damage quantification, the voids appear as white spots.
interest. In addition, micro x-ray tomography was used to reveal the 3D view of the damage fields. Sample prepara-tion included cutting cylindrical samples from the central region of the recovered samples with dimensions∼1.7 mm in diameter with the specimen’s thickness as the height of the cylinder. The samples are analyzed with an Xradia micro computed x-ray tomography (MXCT) instrument. Complete details on the measurement, the analysis routine as well as methodology to improve 3D image segmentation accuracy can be found in Pattersonet al.[19].
3 Results and discussion
The images on the left in figure 4 show bright field, optical micrographs of the cross sections of recovered samples subjected to different tensile loading conditions. Due to the shock compression and subsequent tension to which the samples were subjected, the thickness of each recovered sample shows a slightly different value with respect to their original thickness. The images on the right show corresponding processed images after being converted to 8 bit, binarized, and cleaned using Image J software. The voids are clearly distinguished as white spots on a black background. These images were utilized to perform the quantification of the damage characteristics, such as void area fraction and void size distribution.
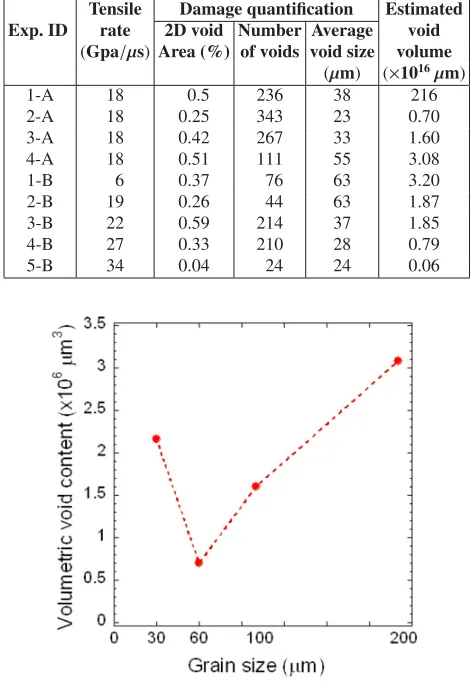
Table 2.Characteristics of the measured damage.
Tensile Damage quantification Estimated
Exp. ID rate 2D void Number Average void
(Gpa/µs) Area (%) of voids void size volume
(µm) (×1016µm)
1-A 18 0.5 236 38 216
2-A 18 0.25 343 23 0.70
3-A 18 0.42 267 33 1.60
4-A 18 0.51 111 55 3.08
1-B 6 0.37 76 63 3.20
2-B 19 0.26 44 63 1.87
3-B 22 0.59 214 37 1.85
4-B 27 0.33 210 28 0.79
5-B 34 0.04 24 24 0.06
Fig. 3.Volumetric void content vs. grain size.
The results from the quantitative analyses are listed in Table 2. The void volume values are calculated by considering the number of voids and taking into account the distribution of the void size, both measurements were obtained from analyses of the optical micrographs.
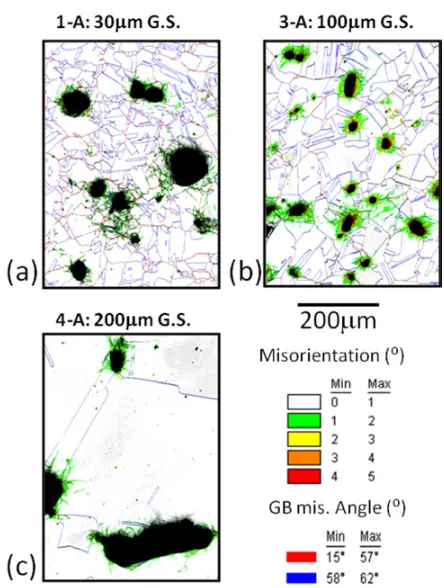
Fig. 4. EBSD results showing non-Σ3 GBs as preferred void nucleation locations and the presence of plastic fields for samples (a) 1-A, (b) 3-A and (c) 4-A.
of the grain size. A non-linear relationship was observed between the damage measured in the samples and the grain size. The lowest damage (void) content was observed in microstructures with average grains size in the 60–100µm range, then as the grain size is decreased (30µm) or increased (200µm), a larger damage content was observed in the recovered samples.
Figure 4 highlights the two main findings obtained from EBSD measurements. Most of the damage occurs at grain boundaries. Due to the predominant presence ofΣ3 type of GBs, the overall distribution of grain boundaries can be partitioned intoΣ3 (or 60±2◦angle misorientation, colored as blue) and non-Σ3 (5◦<angle<57◦, colored as red) type.
For all cases, damage is observed to develop prefer-entially along non-Σ3 high angle type of grain boundaries (colored red). These results indicate that the structure of the grain boundary determines the preferred location for void nucleation. The average kernel misorientation maps are also shown in the same images. This measurement is an approach generally used to correlate microstruc-tural misorientation to plastic deformation. The sample from Exp. 3-A shown in figure 4(b) shows that voids remained small and isolated. In addition, zones of rel-atively high misorientation are observed to link voids, which have not yet coalesced. On the contrary, the mis-orientation maps from Exps. 1-A and 4-A shown in fig-ures 4(a) and 4(c) show highly localized deformation fields around already coalesced voids. This is indicative that void growth and coalescence become more predominant for
Fig. 5.Volumetric void content vs. tensile stress rate.
these microstructures. These results suggest a length scale dependency for how the energy supplied by the shock is dissipated. Remote plastic work and isolated damage development occurs in microstructures with intermediate grain size (60–100µm), while a more localized plastic deformation that favors void coalescence, occurs in mi-crostructures with relatively small (30µm) or large (200µm) grain size.
Figure 5 shows the void volume fraction as a function of the tensile stress rate.
The overall damage appears to linearly decrease with increasing tensile stress rate. To complement this obser-vation, the results from EBSD and MXCT measurements are shown in figure 6. As before, the EBSD images in the top row show the average kernel misorientation maps. As indicated, the tensile stress rate decreases from left to right. The bottom row shows the corresponding 3D views of the damage. The color is used with the sole purpose to distinguish between individual voids and has no physical meaning.
Fig. 6.Top row: EBSD misorientation maps, the color code is similar to that in Fig. 4. Bottom row: 3D MXCT measured damage in the corresponding specimens. The color only to distinguish the voids.
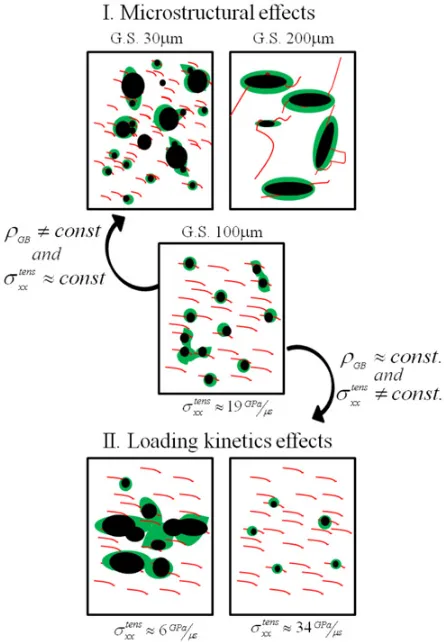
Fig. 7.Schematic showing the individual roles of I: Microstruc-ture, and II: Tensile rate on the damage mechanisms.
form of grain boundary density, was strictly kept constant for this set of experiments, time is the sole, or at least predominant, parameter responsible for the development of advanced damage states in the samples.
To summarize the observations to date, a schematic showing the individual effects of microstructure and
loading kinetics on the damage evolution is presented in figure 7. This model builds on the previous mechanisms for damage evolution as a function of the grain size reported in [17]. For this framework, the damage state found in an intermediate microstructure (G.S. 100µm) deformed at an intermediate tensile stress rate (∼19 GPa/µs) is taken as the starting point. The red lines represent non-Σ3 grain boundaries that have been observed to act as the preferred nucleation sites for damage. It should be noted that the rest of the area (or volume) is filled with the low angle GBs and Σ3 GBs that have been shown to resist void nucleation for the loading conditions pursued in this study. The black regions represent voids and the green shadows represent plastic fields. For these conditions, the voids tend to grow but remain isolated for the most part, with some of the energy supplied by the shock loading being lost as remote plastic work dissipation, this is similar to what was measured experimentally in samples 3-A and 2-B.
If the loading profile is kept constant and the mi-crostructure is changed by altering the grain size, there is a change in the characteristics of the damage fields. The grain size determines the proximity of the nucleated voids. In samples with relatively small grain sizes (30µm) the voids are nucleated on different grain boundaries but they are close to each other. On the other hand, in samples with large grain sizes several voids can be nucleated along the same grain boundary (200µm), this also causes the voids to be close to each other. In both cases, the short separation distance between voids, promotes coalescence that leads to large damage content as observed in figures 3 and 4.
decreases, the sample experiences a state of tension for longer times. These longer times allow a higher develop-ment of the plastic fields become more will developed and eventually lead to an enhanced coalescence, as observed in Exp. 1-B (figures 5 and 6).
4 Conclusions
The damage at the early stages has been observed to obey a deterministic behavior with voids predominantly nucleating at high angle grain boundaries, other than the specialΣ3(60◦). The subsequent damage evolution is dic-tated by the competition between void growth and plastic dissipation processes. The behavior of these processes is influenced by microstructural details as well as the loading kinetics of the experiments. In this regard, the microstructure determines the spatial distribution of nucle-ated voids, in turn dictating the preferred mechanisms for damage evolution: coalescence or individual void growth and remote plastic dissipation. The kinetics of loading determine the times under which a region of the sample experienced a state of tension. More advanced stages of damage are observed in samples that were under the action of tensile stresses for longer times.
Acknowledgements
Los Alamos National Laboratory is operated by LANS, LLC, for the NNSA of the US Department of Energy under contract DE-AC52-06NA25396. Funding was provided by the LDRD Grant 20100026.
References
1. T. Antoun, L. Seaman, D. Curran, G. Kanel, S. Razorenov, A. Utkin,Spall Fracture, (Springer, New york, 2002) .
2. L.M. Barker and R.E. Hollenback, J. Appl. Phys.43, 4669 (1972).
3. W. F. Hemsing, Rev. Sci. Instrum.50, 73 (1979).
4. O. Strand, D. R. Goosman, C. Martinez, T. L. Whitworth and W. W. Kuhlow, Rev. Sci. Instrum.77, 083108 (2006).
5. L. Seaman, D. R. Curran and D. A. Shockey, J. Appl Phys47, 4814 (1976).
6. D. R. Curran, L. Seaman and D. A. Shockey, Phys. Today30, 46 (1977).
7. J. N. Johnson, J. Appl. Phys.52, 2812 (1981). 8. J. N. Johnson, G. T. Gray, and N. K. Bourne, J. Appl.
Phys.86, 4892 (1999).
9. G.T. Gray III,in High Pressure Shock Compression of Solids,(Springer-Verlag, New York, 1993).
10. D. D. Koller, R. S. Hixson, G. T. Gray, P. A. Rigg, L. B. Addessio, E. K. Cerreta, J. D. Maestas and C. A. Yablinsky, J. Appl. Phys.98, 103518(2005).
11. M. A. Meyers and C. T. Aimone, Prog. Mater. Sci.28, 1 (1983).
12. R. W. Minich, J. U. Cazamias, M. Kumar and A. J. Schwartz, Metall. Mater. Trans. A35A, 2663 (2004). 13. W. R. Thissell, A. K. Zurek, D. A. S. Macdougall,
D. Miller, R. Everett, A. Geltmacher, R. Brooks and D. Tonks,Shock Compression of Condensed Matter-2001, AIP Conf. Proc.620, 475 (2002).
14. J. P. Escobedo and Y. M. Gupta, J. Appl. Phys. 107, 123502 (2010).
15. P. Peralta, S. DiGiacomo, S. Hashemian, S. N. Luo, D. Paisley, R. Dickerson, E. Loomis, D. Byler and K. J. McClellan, Int. J. Damage Mech.18, 393 (2009). 16. G.I. Kanel, J. of Appl. Mech. and Tech. Phys.42, 358
(2001).
17. J. P. Escobedo, D. Dennis-Koller, E.K. Cerreta, B.M. Patterson, C.A Bronkhorst. B.L Hansen, D. Tonks, and R.A. Lebensohn, J. Appl. Phys.110, 033513 (2011). 18. D. Dennis-Koller, J. P. Escobedo, E.K. Cerreta,
C.A Bronkhorst, B.L. Hansen, B.M. Patterson, R.A. Lebensohn, H. Mourad, and D. Tonks. Isolation of Kinetic and Spatial Properties of Uni-axial Dynamic
Tensile Loading of OFHC Cu, Proceedings paper for
DYMAT 2012 (To be published).