doi: 10.1093/chromsci/bmx092 Advance Access Publication Date: 23 October 2017 Article
Article
Rapid Determination of Non-steroidal
Anti-in
fl
ammatory Drugs in Aquatic Matrices by
Two-phase Micro-electrodriven Membrane
Extraction Combined with Liquid
Chromatography
Nor Suhaila Mohamad Hanapi
1,2, Mohd Marsin Sanagi
1,3,*,
Abd Khamim Ismail
4, Nor
’
ashikin Saim
3, Wan Nazihah Wan Ibrahim
1,2,
Wan Aini Wan Ibrahim
1,3, and Faridah Mohd Marsin
11
Department of Chemistry, Faculty of Science, Universiti Teknologi Malaysia, 81310 UTM Johor Bahru, Johor,
Malaysia,
2Faculty of Applied Sciences, Universiti Teknologi MARA, 40450 Shah Alam, Selangor, Malaysia,
3Centre
for Sustainable Nanomaterials, Ibnu Sina Institute for Scienti
fi
c & Industrial Research, Universiti Teknologi
Malaysia, 81310 UTM Johor Bahru, Johor, Malaysia, and
4Department of Physics, Faculty of Science, Universiti
Teknologi Malaysia, 81310 UTM Johor Bahru, Johor, Malaysia
*Author to whom correspondence should be addressed. Email: [email protected]
Received 26 September 2016; Revised 22 July 2017; Editorial Decision 26 September 2017
Abstract
Two-phase micro-electrodriven membrane extraction (EME) procedure for the pre-concentration
of selected non-steroidal anti-in
fl
ammatory drugs (NSAIDs) in aquatic matrices was investigated.
Agarose
fi
lm was used as interface between donor and acceptor phase in EME which allowed for
selective extraction of the analytes prior to high performance liquid chromatography-ultraviolet
detection. Charged analytes were transported from basic aqueous sample solution through
aga-rose
fi
lm into 1-octanol as an acceptor phase at 9 V potential. Response surface methodology in
conjunction with the central composite design showed good correlations between extraction time
and applied voltage (
R
2>
0.9358). Under optimized extraction conditions, the method showed
good linearity in the concentration range of 0.5
–
500
μ
g L
–1with coef
fi
cients of determination,
r
2≥
0.9942 and good limits of detection (0.14
–
0.42
μ
g L
–1) and limits of quanti
fi
cation (0.52
–
1.21
μ
g L
–1).
The results also showed high enrichment factors (62
–
86) and good relative recoveries (72
–
114%)
with acceptable reproducibilities (RSDs
≤
7.5%
n
=
3). The method was successfully applied to the
determination of NSAIDs from tap water and river water samples. The proposed method proved
to be rapid, simple and requires low voltage and minute amounts of organic solvent, thus
environ-mentally friendly.
Introduction
In recent years, pharmaceutical wastes have been recognized as a key source of emerging contaminants and became a serious environmen-tal health issue (1). These emerging contaminants enter the ecosystem via a number of pathways such as disposal of unused drugs, patient
excretion, pharmaceutical factories and hospitals (2,3). The effluent of pharmaceutical waste is released into the environment either as parent compounds or as active/inactive metabolites (4). The occur-rence of pharmaceutical residues must be taken seriously as these drugs are present at low concentrations in aqueous matrices (5).
© The Author 2017. Published by Oxford University Press. All rights reserved. For Permissions, please email: [email protected] 166
Non-steroidal anti-inflammatory drugs (NSAIDs) are among pharmaceutical drug groups most widely used by humans for major relief of inflammatory, chronic and acute pain (6). NSAIDs have been commonly found in very low concentrations in water samples such as wastewater (7) and also treated drinking water (8). Several methods have been used for the determination NSAIDs including dispersive liquid–liquid microextraction (DLLME) (9) and
hollow-fiber liquid phase microextraction (HF-LPME) (10). However, DLLME is not suitable for complex matrices due to the high poten-tial interferences (11) while HF-LPME suffered from longer extrac-tion times (20–40 min) that has been claimed as a drawback (12).
Electrodriven membrane extraction (EME) is a well-established and promising membrane-based extraction technique based on the application of electrical forces for driving analytes from sample solu-tion across supported liquid membrane (SLM) into acceptor phase (13, 14). It has been shown that EME provides fast and selective sample clean-up with minute amount of organic solvent consump-tion (15). Due to its desirable and excellent features, EME has been employed in various sample preparations for many applications like metals (16), peptides (17) water (18–20), organic acid compound (21) and pharmaceutical compounds (22,23). Recently, this tech-nique was successfully combined with chromatographic analysis (14) and capillary electrophoresis (CE) (15). The extraction tech-nique provided a faster extraction time, acceptable recoveries and low of limit detection were obtained (14,24).
Lee and co-workers described the EME of organic compounds from wastewater. With this method, low limits of detection (LODs) (>0.005μg/L), good linearity and acceptable relative recoveries (74%) were achieved (25). The group of Alhooshaniet al.proposed EME for the extraction of organic compounds from wastewater using toluene as SLM with 200 V driving force and the recovery values obtained were higher compared to those of solid phase extraction (SPE) (26).
Several reported studies proposed the use of three-phase EME prior to liquid chromatography (LC) (22,27) and capillary electro-phoresis (CE) (28). Three-phase EME combined with high perfor-mance liquid chromatography-ultraviolet (HPLC-UV) has been proposed for the determination of acidic compounds from several complex matrices. With this approach, acceptable recovery and good linearities and LODs were obtained (29). Nevertheless, in three-phase EME, the final concentration is in aqueous acceptor phase that leads to limited applicability of the methods of detection.
A challenge to broaden the applicability of EME in many instru-mental analyses is that thefinal extraction phase must in organic sol-vent. Davarani and co-workers have demonstrated two-phase EME using gas chromatography–mass spectrometry (GC-MS) for basic pharmaceutical compounds determination. In this method, organic solvent was used asfinal extraction phase which can broaden the applicability of EME in combination with many instruments. In addi-tion, two-phase EME has proved that the extraction was simple by skipping the SLM-acceptor phase interface (30).
In our laboratory, two-phase EME has proven to be a technique for extraction of tricyclic antidepressants (TCAs) in aquatic samples using HPLC-UV (31). More recently, we have developed an innovative method based on fast kinetic two-phase micro-EME in utilizing aga-rose film (AF) impregnated with nitrophenyl octyl ether (NPOE) as SLM for basic drugs extraction (32). Agarose exhibits a number of desirable properties includingflexibility, solubity, thermal stability and high mechanical strength which leads for commercial application (33).
To the best of our knowledge, no work has been reported on two-phase EME combined HPLC-UV for the determination of acidic compounds from the aqueous matrices. Therefore, this work was set out to develop and apply two-phase EME that is a simple, fast and green chemistry extraction combined with HPLC-UV for the pre-concentration and determination of four selected NSAIDs (ketopro-fen, diclofenac, ibuprofen and mefenamic acid) in aquatic matrices. Additionally, this method applied an experimental design using response surface methodology (RSM) in conjunction with the cen-tral composite design (CCD) approach for the optimization and evaluation of the interactive effects of extraction time and applied voltage. From the RSM-CCD results, the most significant EME parameter was successfully identified.
Experimental
Chemicals and reagents
Ibuprofen (IBU), diclofenac sodium salt (DIC), ketoprofen (KET) and mefenamic acid (MEF) standards were purchased from Sigma-Aldrich (St. Louis, USA). HPLC grade organic solvents (acetonitrile, methanol, heptanol and 1-octanol) were obtained from J.T. Baker (Pennsylvania, USA). Reagent grade sodium hydroxide (NaOH) and hydrochloric acid (HCl) were obtained from Merck (Darmstadt, Germany). Sodium
Figure 1.Schematic of the two-phase agarosefilm EME (AF-EME).
Figure 2.Effect of organic solvent ofμ-EME of selected NSAIDs drugs from spiked distilled water. Legends: KET=ketoprofen; DIC=diclofenac; IBU= ibuprofen; MEF=mefenamic acid. AF-EME conditions: 500μg L−1of spiked solution; extraction time, 10 min; applied voltage, 10 V; stirring speed, 600 rpm. (Error bars represent standard deviations of results,n=3).
acetate anhydrous (CH3COONa), were obtained from HmbG Chemicals. Agarose (Analytical Grade) was obtained from Promega (Madison, USA). Double-distilled deionized water of 18.2 MΩ was purified using Nano ultrapure water system (Barnstead, USA).
Preparation of standard and sample solutions
Standard solutions of KET, DIC, IBU and MEF (1,000μg mL−1) were prepared separately in HPLC grade methanol. Water samples were prepared by spiking analytes at a known concentration (0.5μg mL−1). Tap water and river water samples were collected from Department of Chemistry, Faculty of Science, Universiti Teknologi Malaysia Johor Bahru and Skudai river, Johor Bahru, respectively. The samples were
filtered through a Whatman™ nylon membrane filter 0.45μm (Gelman Sciences, Ann Arbor, MI, USA). All the standard and sample solutions were stored in a refrigerator at 4°C until use.
Chromatographic conditions
HPLC separations were performed using a Zorbax Eclipse plus C18 column (2.1×100 mm, 3.5μm) using an Agilent Technology 1220 LC system (California, USA) equipped with ultraviolet detector and a 20-μL sample loop. Analytes peaks were detected at 230 nm and processed using Agilent Chemstation software. Acetonitrile-acetate buffer (pH 3.2, 25 mM) (60:40) (v/v) was used as eluent and the
flow rate was set at 0.2 mL min−1.
Preparation of AF
The AF was prepared according to the procedure reported by Sanagi and co-workers (32). In the procedure, a solution of 0.8% (w/v) agarose gel was dehydrated to form a thin nano-pore film (12–18 nm pores and 0.02–0.04 mmfilm thickness).
AF-EME procedure
The experimental setup used for the extraction procedure is shown in Figure1. A basic aquatic sample (10 mL) with adjusted pH of 7.5 was introduced into a 12-mL sample vial. In this study, the anode (positive electrode) was placed in acceptor phase solution and the cathode
(negative electrode) was dipped directly into the sample solution. Next, 1-octanol was immobilized in the pores of porous AF to serve as SLM by dipping thefilm into the solvent for 5 s. Thefilm was cut into small pieces (ca. 2.5 cm×2. 5 cm) and attached at the lower end of the glass tube. A minute amount of 1-octanol (20μL) as an acceptor phase was introduced using a micro-syringe into the glass tube attached with AF and the assembly was directly dipped into the sample solution. The surface area of the AF exposed to the aquatic sample was approxi-mately 0.15 cm2. The sample solution was agitated at 600 rpm using a magnetic stirrer. Applied voltage (9 V) was applied and the extraction was performed for a certain length of time (e.g., 10 min 36 s). After completion of extraction, 2μL of extract was withdrawn for LC sepa-ration and quantification. The AF was discarded after single use in order to eliminate carry-over effect.
Experimental design
The experimental design was generated using Design-Expert version 6.0.4 (Stat Ease Software) for regression analysis of the experimental data tofit the equations.
Table I.Chemical Structure of the Studied NSAIDs
Analytes Chemical structure pKa Log P
Ibuprofen
OH
O
4.60 3.79
Diclofenac Cl
NH
Cl OH
O
4.15 1.56
Ketoprofen O CH3
OH
O
4.0 3.00
Mefenamic acid
N H
OH O
4.2 5.28
Source:‘The Drugbank Database’http://www.drugnbank.ca(Accessed on 15 Jun 2015).
Figure 3.Effect of sample pH on AF-EME of NSAIDs of selected NSAIDs from spiked distilled water. Legends, AF-EME and HPLC-UV conditions are as in Figure2with 1-octanol as organic liquid membrane. (Error bars represent standard deviations of results,n=3).
Figure 4.Effect of stirring speed on AF-EME of selected NSAIDs from spiked distilled water. Legends, AF-EME and HPLC-UV conditions are as in Figure2
with sample pH 7.5. (Error bars represent standard deviations of results,n=3).
Validation of AF-EME
The validation of AF-EME was carried out in terms of linearity, limit of detection (LOD), limit of quantification (LOQ), enrichment factor (EF), precision and recovery. LOD was calculated based on three times the signal-to-noise ratio (S/N=3) while LOQ was calcu-lated based on 10 times the signal-to-noise ratio (S/N = 10). Precisions were expressed in relative standard deviation (RSD) for inter-day precision. Inter-day precision was assessed by performing three replicates (n=3) analyses at two different concentrations of spiked tap water and river water samples at three different days (n=3). Relative recovery was calculated as the percentage of mean concentra-tion of target analytes found after extracconcentra-tion (derived from the plotted matrix-match calibration curve) against the concentration spiked in the sample. The EF of the proposed method was calculated according to the following equation:
C C
EF= final/ initial, ( )1
whereCfinalis thefinal concentration of analyte andCinitialis the ini-tial concentration of analyte in samples solution,
Data and statistical analysis
In order to obtain the optimum conditions for the simultaneous extraction of NSAIDs, RSM and CCD were used to optimize two independent variables (applied voltage and extraction time). The experimental design was generated using Design-Expert version 6.0.4 (Stat Ease Software) for regression analysis of the experimental data tofit the equations. The quality of the developed method can be determined from the value of correlation coefficient (R2).
Analysis of variance (ANOVA) was used to evaluate the significance of the equations developed.
Results
Optimization of AF-EME extraction
In a preliminary investigation, two parameters (Sample pH, and stir-ring speed) were evaluated and optimized separately using traditional optimization procedure (one variable at-a-time). Subsequently, the effects of two other independent main parameters in AF-EME (volt-age and extraction time) were investigated and evaluated using the RSM and CCD. The optimization was carried out by using deionized water samples spiked with each selected NSAID at a concentration of 0.5μg mL−1.
Variation in the organic liquid membrane (organic
solvent)
Organic liquid membrane is one of the most important factors in AF-μ-EME. In this work, two solvents (1-octanol and heptanol) were evaluated as organic liquid membrane (Figure2). The results showed that 1-octanol gave the highest extraction efficiencies com-pared to heptanol. 1-octanol has proved to be a very efficient organic solvent for extraction of acidic substances (34). Therefore, 1-octanol was chosen for subsequent experiments.
Sample pH
Suitable pH value of sample solution can help improve the extrac-tion efficiency and reduce matrix interferences. Since the pKa values of the acidic drugs studied (IBU, KET, DIC and MEF) are in the range of 4.0–4.6 (TableI), these compounds mainly exist as electri-cally neutral molecules at low pH and ionized species at high pH. In EME, the ionization is more efficient if the pH of the acceptor solu-tion is higher than the pKa of the analyte (26) and thus, extraction of the analyte is more efficient under alkaline condition (35). In this study, the effect of sample pH was evaluated by varying the pH in the range 6.5–9.5 and the results are presented in Figure3. From the results, it was evident that the best extraction efficiency was achieved at pH 7.5. A further increase of sample pH to 8.5 resulted in gradual decrease of the peak areas as the analytes were trans-formed into molecular forms. At lower pH, the ionization is hin-dered and poorer extraction efficiency is obtained (26). Therefore, pH 7.5 was selected and used in subsequent experiments.
Stirring speed
Different stirring speeds in the range of 450–900 rpm on the extrac-tion efficiency were investigated. In general, higher stirring speed en-hances the diffusion of the analytes into the acceptor phase (36). Results showed that the highest extraction efficiency was obtained at 600 rpm and the peak areas slightly decreased at stirring speeds of 600 rpm and beyond (Figure4). This might be due to the possibil-ity of the increase of organic solvent loss at higher stirring speeds (37). Thus, 600 rpm was selected as the optimum stirring speed and used in subsequent experiments.
Experimental design using RSM with CCD
RSM is a useful method for studying the effects of several variables influencing the responses by varying them simultaneously (38). In general, the CCD is an effective design used to reduce the number of experimental trials needed, maximize efficiencies and to investigate
Table II.Independent Variables and their Coded Level for the CCD Design
Parameters (factors) Code Code variable levels
−α −1 0 +1 +α
Applied voltage A 1.51 4 10 16 18.49
Extraction time B 4.34 6 10 14 15.66
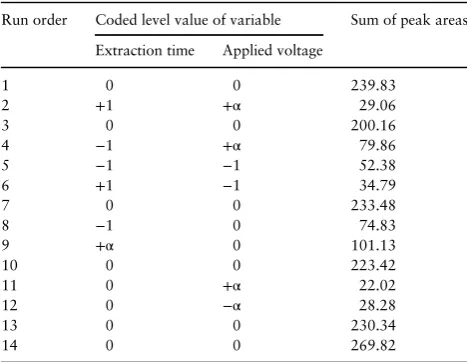
Table III.CCD Consisting of Experiments for the Study of Two Experimental Factors in Coded Level and Experimental Results
Run order Coded level value of variable Sum of peak areas
Extraction time Applied voltage
1 0 0 239.83
2 +1 +α 29.06
3 0 0 200.16
4 −1 +α 79.86
5 −1 −1 52.38
6 +1 −1 34.79
7 0 0 233.48
8 −1 0 74.83
9 +α 0 101.13
10 0 0 223.42
11 0 +α 22.02
12 0 −α 28.28
13 0 0 230.34
14 0 0 269.82
the relationship between variables (39). The equation below reveals the number of experiments that should be run:
N 2n 2n n, 2
c
= + + ( )
wherenis the factor number and (nc) is the replicate number of the central point.
In this study, two selected variables (extraction time and applied voltage) were investigated. According to Equation1, 14 ex-periments were generated with the design matrix consisting offive levels of two factors. The coded level of selected factors (−α,−1, 0,
+α,+1). The coded/actual values and the result of experiments are summarized in Table II. CCD consisting of experiments for the study of two experimental factors in coded levels and experimental results are shown in TableIII.
For an experimental design with two factors, the quadratic model can be expressed by the following equation:
Y=ao+ a A1 1 +a B2 1 +a A3 2 + a B4 2+a A B5 1 1, ( )3
whereYis the predicted percentage value of peak area/response;A, extraction time;B, applied voltage;ao−a5are the coefficient values obtained through multiple linear regression using Design-Expert software. The predicted response (Y) for each four analyse was ob-tained using Equation4–7:
For ketoprofen (KET) recovery,
Y 62.40 2.52A 3.89B 17.18A 26.16B 8.47A B. 4
1 2 2 2
= + − − − − ·
( )
For ibuprofen (IBU) recovery,
Y 36.22 1.42A 2.34B 10.23A 15.21B 6.87A B. 5
1 2 2 2
= + − − − − ·
( )
For mefinamic acid (MEF) recovery,
Y 30.09 1.50A 1.54B 9.39A 13.05B 5.73A B. 6
1 2 2 2
= + − − − − ·
( ) For diclofenac (DIC) recovery,
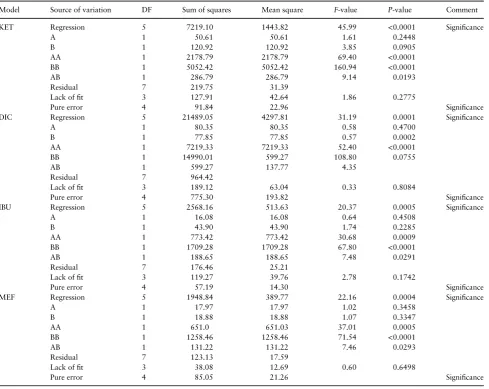
Table IV.ANOVA Regression Model for Response Quadratic Model for Four Selected of NSAIDs Analytes
Model Source of variation DF Sum of squares Mean square F-value P-value Comment
KET Regression 5 7219.10 1443.82 45.99 <0.0001 Significance
A 1 50.61 50.61 1.61 0.2448
B 1 120.92 120.92 3.85 0.0905
AA 1 2178.79 2178.79 69.40 <0.0001
BB 1 5052.42 5052.42 160.94 <0.0001
AB 1 286.79 286.79 9.14 0.0193
Residual 7 219.75 31.39
Lack offit 3 127.91 42.64 1.86 0.2775
Pure error 4 91.84 22.96 Significance
DIC Regression 5 21489.05 4297.81 31.19 0.0001 Significance
A 1 80.35 80.35 0.58 0.4700
B 1 77.85 77.85 0.57 0.0002
AA 1 7219.33 7219.33 52.40 <0.0001
BB 1 14990.01 599.27 108.80 0.0755
AB 1 599.27 137.77 4.35
Residual 7 964.42
Lack offit 3 189.12 63.04 0.33 0.8084
Pure error 4 775.30 193.82 Significance
IBU Regression 5 2568.16 513.63 20.37 0.0005 Significance
A 1 16.08 16.08 0.64 0.4508
B 1 43.90 43.90 1.74 0.2285
AA 1 773.42 773.42 30.68 0.0009
BB 1 1709.28 1709.28 67.80 <0.0001
AB 1 188.65 188.65 7.48 0.0291
Residual 7 176.46 25.21
Lack offit 3 119.27 39.76 2.78 0.1742
Pure error 4 57.19 14.30 Significance
MEF Regression 5 1948.84 389.77 22.16 0.0004 Significance
A 1 17.97 17.97 1.02 0.3458
B 1 18.88 18.88 1.07 0.3347
AA 1 651.0 651.03 37.01 0.0005
BB 1 1258.46 1258.46 71.54 <0.0001
AB 1 131.22 131.22 7.46 0.0293
Residual 7 123.13 17.59
Lack offit 3 38.08 12.69 0.60 0.6498
Pure error 4 85.05 21.26 Significance
F-value: Variance of the group means/mean of the within group variances.
P-value: The probability of obtaining a result at least as extreme as the one that was actually observed, given that the null hypothesis is true.
Y 104.14 3.17A 3.124B 31.27A 45.05B 12.24A B. 7
1 2 2 2
= + − − − − ·
( )
Analysis of variance
ANOVA and regression analysis was used to assess significance of variables which presented P-value, sum of squares, mean square,
F-value and degree of freedom (DF). As shown in TableIV, the statis-tical significance of the second-order equation revealed that the regression was statistically significant (P <0.0005). The result re-vealed that the statistical significance of the second-order equation re-vealed that the regression was statistically significant (P<0.0005) for all NSAIDs drugs. The quality offit of the quadratic polynomial model was expressed by the coefficient of determination, R2. The
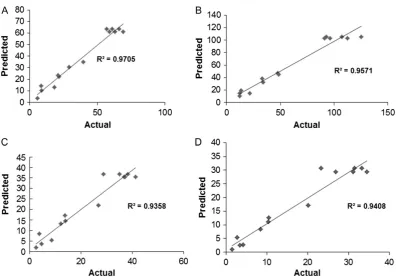
value of R2 presented whether there is an acceptable relationship between the predicted and actual values (40).
As shown in Figure5, the coefficient of determination,R2was found to be 0.9358 for IBU, 0.9705 for KET, 0.9408 for MEF and 0.9571 for DIC. These results showed that all of the values were close to 1.0, which advocates a high correlation between predicted and observed values. The results indicate that the regression model provides excellent relationship between two variables and the peak area response. The model is considered a goodfit model if the value of the coefficient of determination,R2is≥0.80 (41).
The main effects of variables were visualized by the use of Pareto chart (Figure6). According to this figure, applied voltage, BB has the largest influence on the normalized peak area which affect the extraction efficiencies of NSAIDs in EME. In EME, applied voltage was an important parameter for the efficient extraction of analytes (42,43). Nevertheless, the peak area decreased when higher voltages were applied. The maximum normalized peak area would be at 10 min 36 s and 9 V.
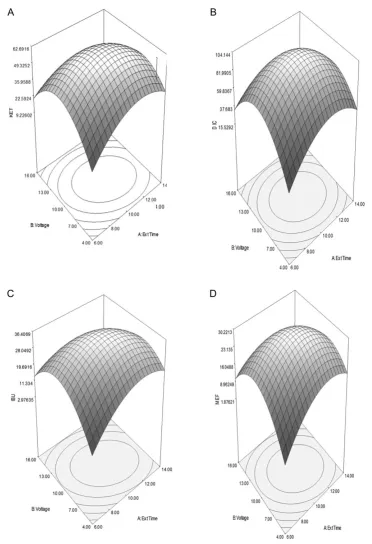
Response contour plot
The results of a CCD experiments visualized in the form of a response through three-dimensional (3D) surface and contour plots were constructed. RSM was used to investigate the integrated effect of extraction time and applied voltage in the form 3D plots. As illus-trated in Figure7, the extraction time and applied voltage variables were acted on parallel ways which have considerable influence in the response or peak area. The peak area increased with increasing extraction time and applied voltage where the maximum point is located inside the experimental region.
Extraction time could affect theflux of target analytes in the electrokinetic across SLM into acceptor phase (44). From the re-sults, it is apparent that the peak area of all analytes increased Figure 5.Relationship between predicted and actual (experimental) values for (A) ketoprofen, (B) diclofenac, (C) ibuprofen and (D) mefenamic acid.
Figure 6.Pareto chart of the main effects in AF-EME.
with extraction time up to a point and decreased thereafter. It should be noted that EME was a non-exhaustive process and over-saturation of analytes in the acceptor phase might occur which lead to back-diffusion into sample solution (45,46).
InμEME, the number of ions crossing the membrane can be increased by increasing the applied voltage. The application of the higher potential leads the system further from equilibrium and thus creates a strong force for target compounds to migrate from
sample solution across membrane into acceptor phase (47). Again, as EME is a non-exhaustive process, the duration of membrane stability is reduced by increasing the voltage. Electrolysis occured at cathode and anode where bubbles were formed at the cathode according to the H2 formationviathe following reactions (Equations7and8):
Donor solution negative electrode : 2H( ) + +2e−→H .2 ( )8 Figure 7.RSM obtained by plotting voltage vs. the extraction time for NSAIDs: (A) KET, (B) DIC, (C) IBU and (D) MEF using CCD on AF-EME extraction.
H
Acceptor solution positive electrode : O 2H 1/2O 2e. 9
2 2
( ) → + +
( ) +
As a summary, the optimized EME conditions were as follows: aga-rose concentration, 1.0% (w/v); organic liquid membrane, 1-octanol; sample pH, 7.5; stirring speed, 600 rpm; extraction time, 10 min 36 s and applied voltage, 9 V.
Discussion
Experiments were carried to validate the applicability of two-phase AF-EME by using optimum extraction conditions (1-octanol as an organic solvent, sample solution at pH 7.5, 600 rpm as stirring speed, extraction time of 10 min 36 s and applied voltage of 9 V). In this study, the method was validated in terms of its linearity, LODs, EFs, accuracy and precision under the above-mentioned optimum extraction condition. The calibration curves were constructed by plotting the peak area of analytes vs. the concentration, and every concentration was performed in triplicate. The linearity of the method was evaluated using water samples spiked with the four selected of NSAIDs. Good linearity of response (peak area) for each analyte was observed (Table V) in the concentration range of 0.5–500μg L−1with coefficients of determination,r2≥0.9942. The proposed method showed good LODs and LOQs for the targeted anaytes in the range of 0.14–0.42μg L−1 and 0.52–1.21μg L−1, respectively. The results also showed high EFs in the range of 62–86. Method accuracy (or RR %) and precisions (expressed as RSD %) were evaluated on spiked water samples at two different
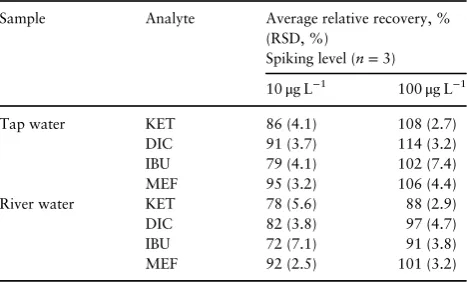
concentration levels: 10 and 100μg L−1. The results (Table VI) showed excellent relative recoveries in the range of 72–114% and good reproducibility with RSDs of <7.5%. Figure 8 shows that AF-EME coupled with HPLC-UV is suitable for the determination of NSAIDS in water samples.
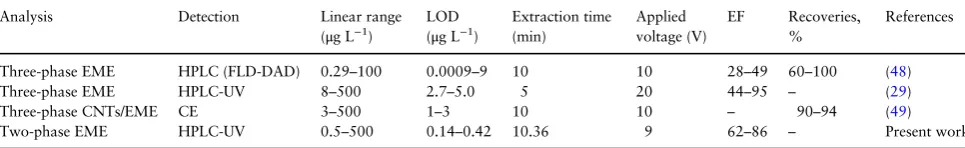
Comparison of AF-EME with other reported EME
methods
The comparison of analytical method between two-phase AF-EME and other reported EME methods is tabulated in TableVII. A few EME methods have been applied in the analysis of NSAIDs. In gen-eral, each method has its own advantages and disadvantages. Apparently, most of the EME is based on a three-phase system. Three-phase EME combined with HPLC resulted in good sensitivity with short extraction time for the quantification of six NSAIDs in wastewater samples (48). However, the EFs were not satisfactory. Very short extraction times were achieved in three-phase EME com-bined with HPLC-UV detection (29) but the EF and low sensitivity recoveries were not satisfactory as compared to the rest of the meth-ods. Three-phase EME method assisted by carbon nanotubes (CNTs) provided excellent pre-concentration factor and high recov-eries due to high adsorption capacity offered by the CNTs (49). However, this method utilized hollowfiber made of polypropylene impregnated with 1-octanol as SLM which might leak into the sam-ple under high agitation speed and application of electricalfield. As compared to other methods, the proposed two-phase AF-EME method revealed good performance in terms of extraction efficiency and showed excellent LODs, high EFs and high relative recoveries. A two-phase mode system is simple as it reduces the extraction pro-cedure and is compatible into wider range of instrumental analysis. In addition, this proposed method provides short extraction time, minute amounts of organic solvent consumption and utilizes bio-polymer AF impregnated with organic solvent as SLM thus support-ing the green chemistry concept.
Conclusion
A two-phase AF-EME combined with LC has been successfully applied for rapid, sensitive and efficient determination of four selected NSAIDs in water samples. Agarosefilms impregnated with 1-octanol have been used as SLM for EME procedure using a low voltage system. The application of two-phase system on this pro-posed method would reduce the extraction procedure and it is com-patible with many analytical instruments. Under the optimized conditions, good correlations were obtained for the two dependent variables (extraction time and applied voltage) in which the applied
Table V.Validation Data of Two-phase AF-μ-EME of NSAIDs from Spiked Tap and River Water Samples
Sample Analyte Linear range,
(μg L−1)
Coefficient of determination,r2
LOD, (μg L−1)
LOQ (μg L−1)
EF Precision (RSD, %) (n=3)
Tap water KET 0.5–500 0.9984 0.21 0.63 71 7.5
DIC 0.5–500 0.9979 0.18 0.58 82 8.8
IBU 0.5–500 0.9953 0.30 0.89 73 9.2
MEF 0.5–500 0.9989 0.14 0.52 86 6.5
River water KET 0.5–500 0.9954 0.28 0.84 62 4.1
DIC 0.5–500 0.9942 0.22 0.65 74 6.6
IBU 0.5–500 0.9976 0.42 1.21 65 9.4
MEF 0.5–500 0.9991 0.15 0.52 81 3.6
Analytes: KET=ketoprofen, DIC=diclofenac, IBU=Ibuprofen, MEF=mefenamic acid.
Table VI.Relative Recoveries (%) and Method Precisions (RSD %,
n=3) at Two Different Concentrations for Two-phase AF-μ-EME in
Tap Water and River Water Samples
Sample Analyte Average relative recovery, %
(RSD, %)
Spiking level (n=3)
10μg L−1 100μg L−1
Tap water KET 86 (4.1) 108 (2.7)
DIC 91 (3.7) 114 (3.2)
IBU 79 (4.1) 102 (7.4)
MEF 95 (3.2) 106 (4.4)
River water KET 78 (5.6) 88 (2.9)
DIC 82 (3.8) 97 (4.7)
IBU 72 (7.1) 91 (3.8)
MEF 92 (2.5) 101 (3.2)
voltage gave highest influence in AF-EME. The optimized extraction conditions obtained were 10 min 36 s of operation with 9 V driv-ing force, this method providdriv-ing excellent performance extraction in terms of sensitivity and selectivity. The new support biopoly-mer material (agarose film) utilized in two-phase EME showed excellent extraction efficiencies and is advantageous as it is biode-gradable and found abundant from natural sources. This devel-oped method provides rapid extraction, simple and utilizes biopolymer as interface to support the liquid membrane, thus meets the green chemistry concept.
Acknowledgments
The authors also acknowledge the support of Universiti Teknologi MARA (UiTM) for a study leave for N.S.M.H.
Funding
The authors would like to thank Universiti Teknologi Malaysia for facilita-tions and the Ministry of Higher Education Malaysia forfinancial supports through research grant number Q.J130000.2509.09H84.
References
1. McCarberg, B., Gibofsky, A.; Need to develop new nonsteroidal anti-inflammatory drug formulations;Clinical Therepeutics, (2012); 34: 1954–1963.
2. Singleton., J.A., Nissen, L.M., Barter, N., McIntosh, M.; The global pub-lic health issue of pharmaceutical waste: What role for pharmacists?; Journal of Global Responsibility, (2014); 5: 126–137.
3. Kosjek, T., Heath, E., Krbavcˇicˇ, A.; Determination of non-steroidal anti-inflammatory drug (NSAIDs) residues in water samples; Environment International, (2005); 31: 679–685.
4. Christensen, F.M.; Pharmaceuticals in the environment—A human risk?; Regulatory Toxicology and Pharmacology, (1998); 28: 212–221. 5. Halling-Sørensen, B., Nielsen, S.N., Lanzky, P.F., Ingerslev, F.,
Lützhøft, H.H., Jørgensen, S.E.; Occurrence, fate and effects of phar-maceutical substances in the environment—A review;Chemosphere, (1998); 36: 357–393.
6. Payán, M.R., López, M.A.B., Fernández-Torres, R., Bernal, J.L.P., Mochón, M.C.; HPLC determination of ibuprofen, diclofenac and sal-icylic acid using hollowfiber-based liquid phase microextraction (HF-LPME);Analytica Chimica Acta, (2009); 653(2): 184–190.
7. Toledo-Neira, C., Álvarez-Lueje, A.; Ionic liquids for improving the extraction of NSAIDs in water samples using dispersive liquid–liquid microextraction by high performance liquid chromatography-diode array–fluorescence detection;Talanta, (2015); 134: 619–626.
8. Ji, Y., Du, Z., Zhang, H., Zhang, Y.; Rapid analysis of non-steroidal anti-inflammatory drugs in tap water and drinks by ionic liquid dispersive liquid–liquid microextraction coupled to ultra-high performance super-criticalfluid chromatography;Analytical Methods, (2014); 6: 7294–7304. 9. Zgoła-Grzes´kowiak, A.; Application of DLLME to isolation and concen-tration of non-steroidal anti-inflammatory drugs in environmental water samples;Chromatographia, (2010); 72: 671–678.
10. Cha, Y.B., Mung, S.W.; Determination of non-steroidal anti-infl amma-tory drugs in human urine sample using HPLC/UV and three phase
Table VII.Comparison of the Proposed Method with Other EME Methods Applied for the Determination of NSAIDs in Water and Biological Samples
Analysis Detection Linear range
(μg L−1)
LOD (μg L−1)
Extraction time (min)
Applied voltage (V)
EF Recoveries, %
References
Three-phase EME HPLC (FLD-DAD) 0.29–100 0.0009–9 10 10 28–49 60–100 (48)
Three-phase EME HPLC-UV 8–500 2.7–5.0 5 20 44–95 – (29)
Three-phase CNTs/EME CE 3–500 1–3 10 10 – 90–94 (49)
Two-phase EME HPLC-UV 0.5–500 0.14–0.42 10.36 9 62–86 – Present work
Abbreviations: EME=Electromembrane extraction; HPLC=High performance liquid chromatography; FLD=Fluorescence detection; DAD=Diode array detection; EF=Enrichment factor; UV=Ultraviolet; CE=Capillary electrophoresis, CNTs=Carbon nanotubes; LOD=Limit of detection.
Figure 8.HPLC-UV chromatograms of NSAIDs extracted using two-phase AF-EME. (A) (a) tap water sample spiked with analytes at concentrations of 100μg L−1; (b) tap water sample spiked with analytes at concentrations of 10μg L−1; (c) non-spiked tap water sample. (B) (a) river water sample spiked with analytes at concentra-tions of 100μg L−1of each analyte; (b) river water sample with analytes at concentrations of 10μg L−1; (c) non-spiked river water sample. HPLC conditions: column, Agilent Zorbax Eclipse plus C18column (2.1×100 mm, 3.5μm); mobile phase, acetonitrile-acetate buffer (pH 3.2, 25 mM) (60:40, v/v) at aflow rate of 0.2 mL min−1; injection volume, 2μL and detector wavelength, 230 nm. Peak identities: ketoprofen (KET), diclofenac (DIC), ibuprofen (IBU) and mefenamic acid (MEF).
hollow fiber-liquid phase microextraction (HF-LPME);Bulletin of the Korean Chemical Society, (2013); 34: 3444–3450.
11. Rezaee, M., Yamini, Y., Faraji, M.; Evolution of dispersive liquid–liquid microextraction method;Journal of Chromatography A, (2010); 1217: 2342–2357.
12. Halvorsen, T.G., Pedersen-Bjergaard, S., Rasmussen, K.E.; Reduction of extraction times in liquid-phase microextraction;Journal of Chromatography B: Biomedical Sciences and Applications, (2001); 760: 219–226.
13. Balchen, M., Lund, H., Reubsaet, L., Pedersen-Bjergaard, S.; Fast, selective, and sensitive analysis of low-abundance peptides in human plasma by electromembrane extraction; Analytica Chimica Acta, (2012); 716: 16–23.
14. Krishna Marothu, V., Gorrepati, M., Vusa, R.; Electromembrane extrac-tion—A novel extraction technique for pharmaceutical, chemical, clinical and environmental analysis; Journal Chromatographic Science, (2013); 51: 619–631.
15. Fakhari, A.R., Tabani, H., Nojavan, S., Abedi, H.; Electromembrane extraction combined with cyclodextrin‐modified capillary electrophoresis for the quantification of trimipramine enantiomers; Electrophoresis, (2012); 33: 506–515.
16. Basheer, C., Tan, S.H., Lee, H.K.; Extraction of lead ions by electromem-brane isolation;Journal of Chromatography A, (2008); 1213: 14–18. 17. Seip, K.F., Stigsson, J., Gjelstad, A., Balchen, M., Pedersen‐Bjergaard, S.;
Electromembrane extraction of peptides—Fundamental studies on the supported liquid membrane;Journal of Separation Science, (2011); 34: 3410–3417.
18. Lee, J., Khalilian, F., Bagheri, H., Lee, H.K.; Optimization of some experi-mental parameters in the electro membrane extraction of chlorophenols from seawater;Journal of Chromatography A, (2009); 1216: 7687–7693. 19. Guo, L., Lee, H.K.; Electro membrane extraction followed by low-density solvent based ultrasound-assisted emulsification microextraction com-bined with derivatization for determining chlorophenols and analysis by gas chromatography–mass spectrometry;Journal of Chromatography A, (2012); 1243: 14–22.
20. Khajeh, M., Shakeri, M., Natavan, Z.B., Moghaddam, Z.S., Bohlooli, M., Moosavi-Movahedi, A.A.; Electromembrane extraction of organic acid compounds in biological samples followed by high-performance liq-uid chromatography;Journal of Chromatographic Science, (2015); 53: 1217–1221.
21. Kjelsen, I.J.Ø., Gjelstad, A., Rasmussen, K.E., Pedersen-Bjergaard, S.; Low-voltage electromembrane extraction of basic drugs from biological samples;Journal of Chromatography A, (2008); 1180: 1–9.
22. Seidi, S., Yamini, Y., Heydari, A., Moradi, M., Esrafili, A., Rezazadeh, M.; Determination of thebaine in water samples, biologicalfluids, poppy capsule, and narcotic drugs, using electromembrane extraction followed by high-performance liquid chromatography analysis;Analytica Chimica Acta, (2011); 701: 181–188.
23. Basheer, C., Lee, J., Pedersen-Bjergaard, S., Rasmussen, K.E., Lee, H. K.; Simultaneous extraction of acidic and basic drugs at neutral sa; mple pH: A novel electro-mediated microextraction approach;Journal of Chromatography A, (2010); 1217: 6661–6667.
24. Gjelstad, A., Pedersen-Bjergaard, S.; Recent developments in electromem-brane extraction;Analytical Methods, (2013); 5(18): 4549–4557. 25. Lee, J., Khalilian, F., Bagheri, H., Lee, H.K.; Optimization of some
experimental parameters in the electro membrane extraction of chlorophenols from seawater; Journal of Chromatography A, (2009); 1216(45): 7687–7693.
26. Alhooshani, K., Basheer, C., Kaur, J., Gjelstad, A., Rasmussen, K.E., Pedersen-Bjergaard, S., Lee, H.K.; Electromembrane extraction and HPLC analysis of haloacetic acids and aromatic acetic acids in wastewa-ter;Talanta, (2011); 86: 109–113.
27. Ramos-Payán, M., Villar-Navarro, M., Fernández-Torres, R., Callejón-Mochón, M., Bello-López, M.Á.; Electromembrane extraction (EME)—An easy, novel and rapid extraction procedure for the HPLC determination of
fluoroquinolones in wastewater samples; Analytical and Bioanalytical Chemistry, (2013); 405(8): 2575–2584.
28. See, H.H., Hauser, P.C.; Electricfield-driven extraction of lipophilic an-ions across a carrier-mediated polymer inclusion membrane;Analytical Chemistry, (2011); 83(19): 7507–7513.
29. Davarani, S.S.H., Pourahadi, A., Nojavan, S., Banitaba, M.H., Nasiri-Aghdam, M.; Electro membrane extraction of sodium diclofenac as an acidic compound from wastewater, urine, bovine milk, and plasma sam-ples and quantification by high-performance liquid chromatography; Analytica Chimica Acta, (2012); 722: 55–62.
30. Davarani, S.S.H., Morteza‐Najarian, A., Nojavan, S., Pourahadi, A., Abbassi, M.B.; Two‐phase electromembrane extraction followed by gas chromatography‐mass spectrometry analysis; Journal of Separation Science, (2013); 36: 736–743.
31. Sanagi, M.M., Hanapi, N.S.M., Ismail, A.K., Wan Ibrahim, W.A., Saim, N.A., Yahaya, N.; Two-phase electrodriven membrane extrac-tion combined with liquid chromatography for the determinaextrac-tion of tricyclic antidepressants in aqueous matrices; Analytical Methods, (2014); 6: 8802–8809.
32. Hanapi, N.S.M., Sanagi, M.M., Ibrahim, W.A.W., Tahiruddin, S.; Analysis of some anti-depressant drugs in aqueous samples using agarose
film micro-electro driven membrane extraction;Der Pharma Chemica, (2015); 7: 235–242.
33. Sambrook, J., Russell, D.W.;Molecular cloning—A laboratory manual, 3rd ed. Cold Spring Harbor, New York, (2001).
34. Song, X.Y., Shi, Y.P., Chen, J.A.; Novel extraction technique based on carbon nanotubes reinforced hollowfiber solid/liquid microex-traction for the measurement of piroxicam and diclofenac combined with high performance liquid chromatography; Talanta, (2012); 100: 153–161.
35. Balchen, M., Gjelstad, A., Rasmussen, K.E., Pedersen-Bjergaard, S.; Electrokinetic migration of acidic drugs across a supported liquid mem-brane;Journal of Chromatography A, (2007); 1152: 220–225.
36. Seidi, S., Yamini, Y., Rezazadeh, M.; Combination of electromembrane extraction with dispersive liquid–liquid microextraction followed by gas chromatographic analysis as a fast and sensitive technique for determina-tion of tricyclic antidepressants;Journal of Chromatography B, (2013); 913: 138–146.
37. Safari, M., Nojavan, S., Davarani, S.S.H., Morteza-Najarian, A.; Speciation of chromium in environmental samples by dual electromem-brane extraction system followed by high performance liquid chromatog-raphy;Analytica Chimica Acta, (2013); 789: 58–64.
38. Bezerra, M.A., Santelli, R.E., Oliveira, E.P., Villar, L.S., Escaleira, L.A.; Response surface methodology (RSM) as a tool for optimization in ana-lytical chemistry;Talanta, (2008); 76: 965–977.
39. Ahmad, M.A., Alrozi, R.; Optimization of preparation conditions for mangosteen peel-based activated carbons for the removal of Remazol Brilliant Blue R using response surface methodology; Chemical Engineering Journal, (2010); 165: 883–890.
40. Xia, J., Xiang, B., Zhang, W.; Determination of metacrate in water sam-ples using dispersive liquid–liquid microextraction and HPLC with the aid of response surface methodology and experimental design;Analytica Chimica Acta, (2008); 625: 28–34.
41. Joglekar, A.M., May, A.T.; Product excellence through design of experi-ments;Cereal Foods World, (1987); 32: 857–868.
42. Middelthon‐Bruer, T.M., Gjelstad, A., Rasmussen, K.E., Pedersen‐
Bjergaard, S.; Parameters affecting electro membrane extraction of basic drugs;Journal of Separation Science, (2008); 31: 753–759.
43. Kubánˇ, P., Strieglerová, L., Gebauer, P., Bocˇek, P.; Electromembrane extraction of heavy metal cations followed by capillary electrophoresis with capacitively coupled contactless conductivity detection; Electrophoresis, (2011); 32: 1025–1032.
44. Mosavian, M.H., Es’haghi, Z., Razavi, N., Banihashemi, S.; Pre-concentration and determination of amitriptyline residues in waste water by ionic liquid based immersed droplet microextraction and HPLC; Journal of Pharmaceutical Analysis, (2012); 2: 361–365.
45. Nojavan, S., Fakhari, A.R.; Electro membrane extraction combined with capillary electrophoresis for the determination of amlodipine
enantiomers in biological samples; Journal of Separation Science, (2010); 33: 3231–3238.
46. Eskandari, M., Yamini, Y., Fotouhi, L., Seidi, S.; Microextraction of me-bendazole across supported liquid membrane forced by pH gradient and electrical field; Journal of Pharmaceutical and Biomedical Analysis, (2011); 54: 1173–1179.
47. Domínguez, N.C., Gjelstad, A., Nadal, A.M., Jensen, H., Petersen, N.J., Hansen, S.H., Pedersen-Bjergaard, S.; Selective electromembrane extrac-tion at low voltages based on analyte polarity and charge;Journal of Chromatography A, (2012); 1248: 48–54.
48. Payán, M.R., López, M.Á.B., Torres, R.F., Navarro, M.V., Mochón, M.C.; Electromembrane extraction (EME) and HPLC determination of non-steroidal anti-inflammatory drugs (NSAIDs) in wastewater samples;Talanta, (2011); 85: 394–399.
49. Hasheminasab, K.S., Fakhari, A.R., Shahsavani, A., Ahmar, H.; A new method for the enhancement of electromembrane extraction efficiency using carbon nanotube reinforced hollow fiber for the determination of acidic drugs in spiked plasma, urine, breast milk and wastewater samples;Journal of Chromatography A, (2013); 1285: 1–6.