A METHOD FOR DIRECT GENERATION OF FLOOR ACCELERATION
SPECTRA FOR INELASTIC STRUCTURES
Vladimir Vukobratovi
1
Teaching assistant, Faculty of Technical Sciences, University of Novi Sad,
of Civil and Geodetic Engineering, University of Ljubljana, Slovenia ([email protected])
2
Professor, Faculty of Civil and Geodetic Engineering, University of Ljubljana, Slove
ABSTRACT
Seismic design of equipment in
spectra, which are often based on the assumption that the behaviour of the structure and the equipment is linear elastic. Essential reductions in peak values of floor response spectra can be
behaviour of the structure is taken into account. This paper presents the most important results of an extensive parametric study of floor response spectra, taking into account the inelastic behaviour of the structure and the linear elastic behaviour of the equipment. The structure and the equipment were modelled as single-degree-of-freedom
set of recorded ground acceleration time
influences of input ground motion, ductility, hysteretic behaviour and natural period of the structure, as well as damping of the equipment have been studied.
made, a simple practice-oriented method
spectrum is proposed. The method is intended for a quick estimation of approximate floor response spectra.
INTRODUCTION
The safety of the equipment is in many c
buildings like nuclear and thermal power plants. Floor response spect design and evaluation of mechanical and electrical equipment
The floor response spectra concept is ba
equipment, which means that the dynamic interaction between them is neglect accurate in cases of equipment whose mass is significantly smaller than the
a hundred times. The floor response spectra method is rational, simple in concept and very practical. It usually yields somewhat conservative results. By using it, one can avoid numerical problems due to large differences between dynamic properties of the structure and the equipment
In order to avoid long numerical integrations, several researchers have proposed methods that enable generation of floor response spectra directly fr
such methods started in early 1970s
Developments of early floor response
structures and equipment always remain in linear elastic region duri
great importance such as nuclear power plants, it is justified to allow some moderate amount of inelastic behaviour during strong earthquakes.
of existing structures) and neglect
reductions in peak values of floor response spectra can be obtained if inelastic behaviour of structure or/and equipment is taken into account.
In this paper, some results of an extensive parametric study, taking into ac behaviour of the structure and linear elastic behaviour of the
confirm the findings obtained by Fajfar and Novak (1995).
A METHOD FOR DIRECT GENERATION OF FLOOR ACCELERATION
SPECTRA FOR INELASTIC STRUCTURES
Vladimir Vukobratović1 and Peter Fajfar2
Teaching assistant, Faculty of Technical Sciences, University of Novi Sad, Serbia; PhD Student, Faculty of Civil and Geodetic Engineering, University of Ljubljana, Slovenia ([email protected])
Professor, Faculty of Civil and Geodetic Engineering, University of Ljubljana, Slovenia
Seismic design of equipment in industrial buildings is mostly conducted using the floor response spectra, which are often based on the assumption that the behaviour of the structure and the equipment is . Essential reductions in peak values of floor response spectra can be obtained if inelastic behaviour of the structure is taken into account. This paper presents the most important results of an extensive parametric study of floor response spectra, taking into account the inelastic behaviour of the elastic behaviour of the equipment. The structure and the equipment were freedom (SDOF) systems. Response-history analyses were performed for a set of recorded ground acceleration time-histories and for different properties of the
influences of input ground motion, ductility, hysteretic behaviour and natural period of the structure, as well as damping of the equipment have been studied. Based on the results obtained and the conclusions oriented method for direct generation of floor response spectra from the design The method is intended for a quick estimation of approximate floor response
The safety of the equipment is in many cases a primary issue in seismic design of industrial buildings like nuclear and thermal power plants. Floor response spectra are usually used for seismic
and evaluation of mechanical and electrical equipment.
The floor response spectra concept is based on separate (uncoupled) analysis of the structure and equipment, which means that the dynamic interaction between them is neglected. It has been proven cases of equipment whose mass is significantly smaller than the mass of the structure, at least a hundred times. The floor response spectra method is rational, simple in concept and very practical. It usually yields somewhat conservative results. By using it, one can avoid numerical problems due to large
tween dynamic properties of the structure and the equipment.
In order to avoid long numerical integrations, several researchers have proposed methods that r response spectra directly from the ground response spectrum.
in early 1970s. A historical overview was provided by Villaverde (1997). floor response spectra methods have been based on the
structures and equipment always remain in linear elastic region during earthquakes. Even in structures of great importance such as nuclear power plants, it is justified to allow some moderate amount of inelastic
iour during strong earthquakes. This fact is of great importance (especially in the
and neglecting it may lead to unrealistic and uneconomical design. Significant reductions in peak values of floor response spectra can be obtained if inelastic behaviour of structure
quipment is taken into account. Among the first to point out this were Lin and Mahin (1985) In this paper, some results of an extensive parametric study, taking into ac
and linear elastic behaviour of the equipment, are presented. The results mostly m the findings obtained by Fajfar and Novak (1995). Based on these results, a practice
A METHOD FOR DIRECT GENERATION OF FLOOR ACCELERATION
Serbia; PhD Student, Faculty of Civil and Geodetic Engineering, University of Ljubljana, Slovenia ([email protected])
nia
industrial buildings is mostly conducted using the floor response spectra, which are often based on the assumption that the behaviour of the structure and the equipment is obtained if inelastic behaviour of the structure is taken into account. This paper presents the most important results of an extensive parametric study of floor response spectra, taking into account the inelastic behaviour of the elastic behaviour of the equipment. The structure and the equipment were history analyses were performed for a ent properties of the structure. The influences of input ground motion, ductility, hysteretic behaviour and natural period of the structure, as Based on the results obtained and the conclusions for direct generation of floor response spectra from the design The method is intended for a quick estimation of approximate floor response
ases a primary issue in seismic design of industrial ra are usually used for seismic
sed on separate (uncoupled) analysis of the structure and ed. It has been proven mass of the structure, at least a hundred times. The floor response spectra method is rational, simple in concept and very practical. It usually yields somewhat conservative results. By using it, one can avoid numerical problems due to large
In order to avoid long numerical integrations, several researchers have proposed methods that om the ground response spectrum. Development of
s provided by Villaverde (1997).
the assumption that ng earthquakes. Even in structures of great importance such as nuclear power plants, it is justified to allow some moderate amount of inelastic case of evaluation may lead to unrealistic and uneconomical design. Significant reductions in peak values of floor response spectra can be obtained if inelastic behaviour of structure
irst to point out this were Lin and Mahin (1985). In this paper, some results of an extensive parametric study, taking into account inelastic
approximate method for direct generation of floor response spectra, which takes into account the inelastic behaviour of the structure, is proposed. The method is based on the method originally proposed by Yasui
et al. (1993) for elastic structures and on the idea for the extension of this method to inelastic structures
proposed by Novak and Fajfar (1994). A preliminary version of the direct method was proposed by Vukobratović and Fajfar (2012).
PARAMETRIC STUDY
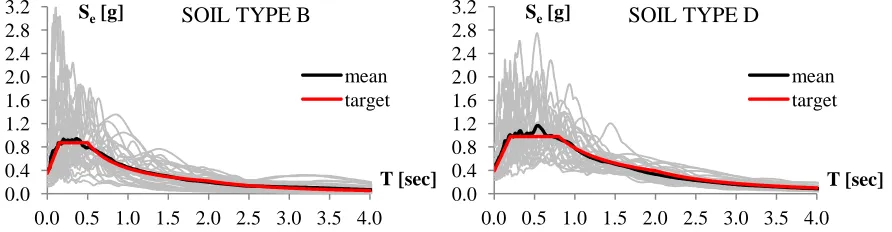
In the parametric study, a total of 12240 floor response spectra were calculated. In this paper only some typical results are presented. A SDOF model was used for both the inelastic structure and the linear elastic equipment, which were treated as uncoupled. The influences of natural period, hysteretic behaviour and ductility of the structure, as well as the influence of damping of the equipment have been studied. The influence of the ground motion characteristics was also investigated. Two different sets, consisting of 30 ground records each, were used in the study. They were taken from the European Strong-Motion Database (ESD) and PEER Ground Strong-Motion Database for soil types B and D, respectively. The records of each set were chosen so that their average spectrum matched a target spectrum. The target spectrum was the elastic spectrum defined by Eurocode 8 (2004). Type 1 spectra for soil types B and D (each for one set of records) were used with the peak ground acceleration equal to 0.35g and to 0.39g, respectively. The characteristic periods of ground motion TC are equal to 0.5 and 0.8 sec for soil types B
and D, respectively.
Target and mean spectra of the selected sets of records for both soil types are shown in Fig. 1. The natural periods of the structure amounted to 0.2, 0.3, 0.5, 0.75, 1.0 and 2.0 sec. Three different hysteretic models were assumed: elasto-plastic (EP) and stiffness degrading (Q) models with zero and 10% hardening, with unloading stiffness degradation coefficient equal to 0.5 in both cases. A constant ductility factor µ was assumed throughout the whole period range and it amounted to 1.5, 2.0 and 4.0. “Mass-proportional” damping amounted to 5% in the case of structure and to 1 and 5% in the case of equipment.
Figure 1. Elastic acceleration spectra of individual records, target and mean spectrum (soil types B and D, 5% damping of the structure)
Results of parametric study
The results obtained in the parametric study show some trends which can be considered as general characteristics of floor response spectra. Some representative results are presented and they provide the basis for the development of a method for the direct generation of floor response spectra for inelastic structures. The natural periods of the (primary) structure and the equipment (secondary structure) are denoted as Tp and Ts, respectively. Floor response spectra values are denoted as As in the case of
inelastic structures and Ase in the case of elastic structures. Peak acceleration of the structure is denoted as
Ap. The results shown in Figs. 2-4 were obtained for structures with Tp=0.3 sec (soil type B) and Tp=0.5 0.0
0.4 0.8 1.2 1.6 2.0 2.4 2.8 3.2
0.0 0.5 1.0 1.5 2.0 2.5 3.0 3.5 4.0 Se[g]
T [sec] mean target
SOIL TYPE B
0.0 0.4 0.8 1.2 1.6 2.0 2.4 2.8 3.2
0.0 0.5 1.0 1.5 2.0 2.5 3.0 3.5 4.0 Se[g]
T [sec] mean target
sec (soil type D). In all cases the damping of the structure (ξp) amounted to 5%, whereas the damping of
the equipment (ξs) amounted to 1% and 5%. EP and Q model with 10% hardening were taken into
account.
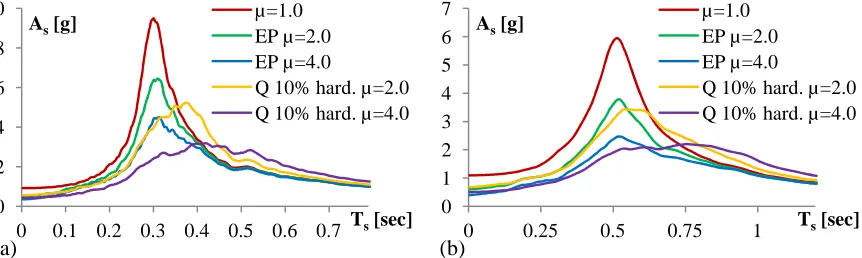
Fig. 2 presents mean values of floor response spectra As. The same results are presented in a
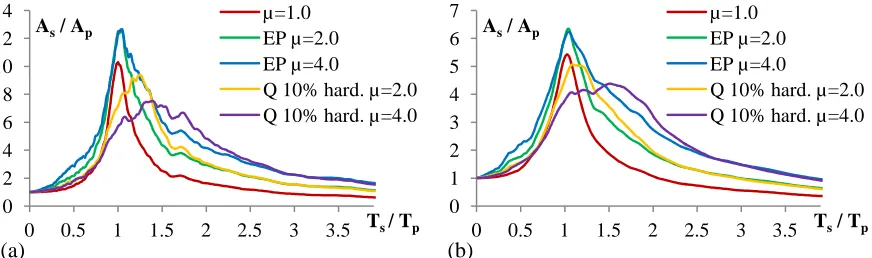
different form in Fig. 3, which shows the ratio of floor response spectra corresponding to inelastic and elastic structure.
Figure 2. Mean values of floor response spectra for structures (ξp=5%) with (a) Tp=0.3 sec (soil type B,
ξs=1%) and (b) Tp=0.5 sec (soil type D, ξs=5%)
Figure 3. The ratio of floor response spectra corresponding to inelastic and elastic structures (ξp=5%) with
(a) Tp=0.3 sec (soil type B, ξs=1%) and (b) Tp=0.5 sec (soil type D, ξs=5%)
The period range of a floor response spectrum can be roughly divided into three regions, depending on the ratio Ts/Tp: pre-resonance region (Ts/Tp<0.8), resonance region (0.8<Ts/Tp<1.25), and
post-resonance region (Ts/Tp>1.25). It is obvious that in the pre-resonance and in the resonance regions,
the behaviour of the equipment is strongly influenced by the behaviour of the structure. Both regions are characterized by a significant reduction of As due to inelastic structural behaviour. The shape of floor
response spectra is influenced by the hysteretic behaviour of the structure. In the case of the EP model the peak values of As occur in the resonance (Ts=Tp), whereas in the case of the Q model the peak values of
As are shifted towards higher periods, due to increasing Tp with increasing plastic deformations. In the
post-resonance region, floor response spectrum is controlled by the ground motion spectrum, and the inelastic structural behaviour has only a small influence on it. If Ts>>Tp, there is practically no reduction
due to inelastic behaviour for the EP model. For the Q model, even some slight amplification can be observed. In the case of infinitely rigid equipment, As is equal to Ap, whereas for an infinitely flexible
equipment the value of As is equal to peak ground acceleration.
Fig. 4 presents the floor response spectra normalized to the peak acceleration of the structure (As/Ap). This ratio is primarily influenced by the damping value of the equipment. It can be observed that
0 2 4 6 8 10
0 0.1 0.2 0.3 0.4 0.5 0.6 0.7 As[g]
Ts[sec] µ=1.0
EP µ=2.0 EP µ=4.0
Q 10% hard. µ=2.0 Q 10% hard. µ=4.0
(a)
0 1 2 3 4 5 6 7
0 0.25 0.5 0.75 1
As[g]
Ts[sec] µ=1.0
EP µ=2.0 EP µ=4.0
Q 10% hard. µ=2.0 Q 10% hard. µ=4.0
(b)
0.0 0.5 1.0 1.5
0 0.5 1 1.5 2 2.5 3 3.5 4 As/ Ase
Ts/ Tp EP µ=2.0 EP µ=4.0
Q 10% hard. µ=2.0 Q 10% hard. µ=4.0
(a)
0.0 0.5 1.0 1.5
0 0.5 1 1.5 2 2.5 3 3.5 4 As/ Ase
Ts/ Tp EP µ=2.0 EP µ=4.0
Q 10% hard. µ=2.0 Q 10% hard. µ=4.0
in the pre-resonance and the resonance regions, the ratio As/Ap slightly increases with increasing ductility
in the case of the EP model, whereas in the case of the Q model, in the resonance region, As/Ap decreases
with increasing ductility.
Figure 4. Floor response spectra normalized to the peak acceleration of the structure (ξp=5%) with (a)
Tp=0.3 sec (soil type B, ξs=1%) and (b) Tp=0.5 sec (soil type D, ξs=5%)
Fig. 5 presents a comparison between the floor response spectra obtained for the stiffness degrading Q models with zero and 10% hardening. The results are obtained for the soil type B and structures with Tp=0.3 and Tp=0.5 sec. Damping of the structure (ξp) amounted to 5%, whereas the
damping of the equipment (ξs) amounted to 1% and 5%.
Figure 5. A comparison between floor spectra obtained for the Q models with zero and 10% hardening in the case of structures (ξp=5%) with (a) Tp=0.3 sec (ξs=1%) and (b) Tp=0.5 sec (ξs=5%), soil type B
It is obvious from Fig. 5 that the floor spectra As obtained for the Q model with zero hardening
are lower than the spectra obtained for the Q model with 10% hardening. Interestingly, this fact has a very small influence on the ratio As/Ap, because also the absolute acceleration of the structure Ap is smaller in
the case of zero hardening. The following relation applies (α is the ratio of post-yield and elastic stiffness)
(
)
p p
A (hardening) / A (no hardening) 1= + α µ −1 (1)
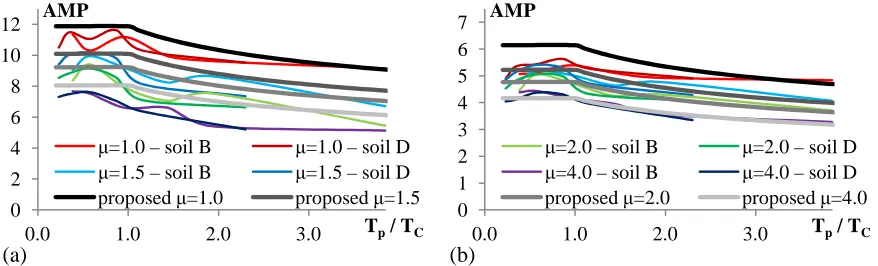
Figs. 6 and 7present maximum values of the ratio As/Ap, which will be hereinafter referred to as
amplification factor (AMP). Both the computed (in the parametric study) and the proposed values of AMP are presented. Results obtained for both sets of ground motions indicate that the shape of the response spectrum characterized by the characteristic period of ground motion TC has only a small
influence on the amplification factor, provided that the ratio Tp/TC is plotted on the x-axis instead of Tp. 0
2 4 6 8 10 12 14
0 0.5 1 1.5 2 2.5 3 3.5 As/ Ap
Ts / Tp µ=1.0
EP µ=2.0 EP µ=4.0
Q 10% hard. µ=2.0 Q 10% hard. µ=4.0
(a)
0 1 2 3 4 5 6 7
0 0.5 1 1.5 2 2.5 3 3.5 As/ Ap
Ts/ Tp µ=1.0
EP µ=2.0 EP µ=4.0
Q 10% hard. µ=2.0 Q 10% hard. µ=4.0
(b)
0 1 2 3 4 5 6
0 0.15 0.3 0.45 0.6 0.75 As[g]
Ts[sec] Q zero hard. µ=2.0 Q zero hard. µ=4.0 Q 10% hard. µ=2.0 Q 10% hard. µ=4.0
(a)
0.0 0.5 1.0 1.5 2.0 2.5
0 0.25 0.5 0.75 1 1.25 1.5 As[g]
Ts[sec] Q zero hard. µ=2.0 Q zero hard. µ=4.0 Q 10% hard. µ=2.0 Q 10% hard. µ=4.0
Figure 6. Computed and proposed amplification factors AMP in the case of EP model for (a) 1% and (b) 5% damping of the equipment
Figure 7. Computed and proposed amplification factors AMP in the case of Q model with 10% hardening for (a) 1% and (b) 5% damping of the equipment
For both the EP and the Q models, the main parameter that influences the amplitude of AMP is the damping of the equipment. AMP reaches its peak value in the region Tp/TC≤ 1, and it decreases with
increasing ratio Tp/TC if the ratio is larger than 1. As already stated above, AMP generally slightly
increases with increasing ductility in the case of the EP model, whereas for the Q model the opposite trend is visible. Our study showed that the difference between AMP obtained for two different Q models is insignificant, i.e. hardening practically does not influence the AMP.
PROPOSAL OF THE DIRECT METHOD
Original method
A very simple method for direct generation of floor response spectra was proposed by Yasui et al. (1993), who derived an equation which is valid in the whole period range for the case of linear elastic behaviour of structure and equipment, which were modelled as uncoupled SDOF systems. Floor response spectrum is calculated by Eqn. 2.
(
)
{
}
(
) (
)
{
(
) (
)
}
(
)
2
2 2
se 2 p s e p p e s s
2 2 2
p s p s p s
1
A T / T S T , S T ,
1 T / T 4 T / T
= ξ + ξ
− + ξ + ξ
(2)
0 2 4 6 8 10 12 14
0.0 1.0 2.0 3.0
AMP
Tp/ TC
µ=1.0 – soil B µ=1.0 – soil D
µ=1.5 – soil B µ=1.5 – soil D proposed
(a)
0 1 2 3 4 5 6 7
0.0 1.0 2.0 3.0
AMP
Tp/ TC
µ=2.0 – soil B µ=2.0 – soil D
µ=4.0 – soil B µ=4.0 – soil D proposed
(b)
0 2 4 6 8 10 12
0.0 1.0 2.0 3.0
AMP
Tp/ TC
µ=1.0 – soil B µ=1.0 – soil D
µ=1.5 – soil B µ=1.5 – soil D proposed µ=1.0 proposed µ=1.5
(a)
0 1 2 3 4 5 6 7
0.0 1.0 2.0 3.0
AMP
Tp/ TC
µ=2.0 – soil B µ=2.0 – soil D
µ=4.0 – soil B µ=4.0 – soil D proposed µ=2.0 proposed µ=4.0
In Eqn. 2 Ase is a floor spectrum value and Se is a value from the input elastic acceleration
spectrum. Damping values of structure and equipment are denoted as ξp and ξs respectively, whereas Tp
and Ts are the natural periods of structure and equipment, respectively.
Thus, in the direct method input data are dynamic properties of the structure and the equipment (damping and natural periods) and elastic acceleration spectrum representing the ground motion.
Our analyses indicate that, in the non-resonance regions, floor response spectra obtained by the proposed direct method are in good agreement with the “accurate” floor response spectra obtained by time-history analyses. In the resonance region, however, a considerable inaccuracy of the direct method was observed in our studies.
Extension and modification of the method
In order to improve the accuracy of the direct method and to make the method applicable for the case of inelastic structures some changes were made.
First, the elastic acceleration spectrum was replaced with the inelastic acceleration spectrum corresponding to the expected ductility demand, as originally proposed by Fajfar and Novak (1994). Several proposals have been made for inelastic acceleration spectra. One of them is the simplified form of spectra proposed by Vidic et al. (1994), which has been implemented in Eurocode 8. The inelastic spectrum, used also in the examples presented later in this paper, can be obtained by reducing the elastic acceleration spectrum by a reduction factor Rµ which is defined by Eqn. 3. It should be noted that in the
proposed direct method, generally, any inelastic acceleration spectrum can be used.
(
)
p
p C
C
p C
T
1 1, T T T
R
, T T
µ
µ − + <
=
µ ≥
(3)
In the case of zero post-yield stiffness, approximate inelastic absolute acceleration spectra can be obtained as Se/Rµ, where Se is elastic input pseudo-acceleration spectrum. If a post-yield stiffness is
included in the model, its influence on the absolute acceleration spectrum can be considered by dividing the reduction factor Rµ with (1+α(µ-1)), where α is the ratio of post-yield and elastic stiffness (see Eqn. 1)
(
)
(
)
R Eqn. 3 R
1 1
µ
µ= + α µ − (4)
Second, a change in the combination rule, used for combining the amplitudes of the vibration of the structure and the equipment, was made. In the original method, the SRSS combination rule is used to compute the floor spectrum throughout the whole period range. Results obtained in our parametric study suggest that the SRSS combination rule provides adequate results in the post-resonance region. In the pre-resonance region, the results are adequate in the case of elastic structures, whereas in the case of inelastic structures the results are in some cases unconservative. It should be noted that this trend is more pronounced in the case of Q models. In the pre-resonance region, more conservative results can be obtained if the sum of the amplitudes of the structure and the equipment is used instead of the SRSS combination rule in the formula for the determination of floor response spectra.
For the EP model of the structure, it is assumed that AMP is independent on ductility. As stated above, the main parameter that influences the AMP is the damping of equipment. In the region Tp/TC≤ 1,
values of AMP may be taken as independent of the period. Thus, for the case of the EP model, AMP is defined by Eqn. 5 (ξs should be entered in percents). Proposed values of AMP are presented on Fig. 6.
(
)
(
)
(
)
0.60
s p C
0.20 0.60
s p C p C
18 1 , T / T 1 AMP
18 1 T / T , T / T 1
−
− −
⋅ + ξ ≤
=
⋅ + ξ >
(5)
For the Q models of the structure, it is assumed that AMP does not depend only on the damping of the equipment, but also on the ductility of the structure. As in the case of EP model, values of AMP may be taken as constant in the region Tp/TC≤ 1. For the Q models, AMP is defined by Eqn. 6 (ξs should
be entered in percents). Proposed values of AMP are presented on Fig. 7.
(
) (
)
(
)
(
)
(
)
0.60 0.85
s p C
0.20
0.60 0.85
s p C p C
18 1 0.6 0.4 , T / T 1 AMP
18 1 T / T 0.6 0.4 , T / T 1
− −
−
− −
⋅ + ξ + µ ⋅µ ≤
=
⋅ + ξ + µ ⋅µ >
(6)
In the proposed direct method, considering the changes explained above, floor response spectra can be computed for both the EP and the Q models as follows:
1. In the pre-resonance region, the spectral values are obtained by Eqn. 7.
(
) (
)
(
)
(
)
(
)
{
}
(
) (
)
2 e p p
p s e s s
s 2
2 2 2
p s p s p s
S T ,
T / T 1 1 S T , R
A
1 T / T 4 T / T
µ
ξ
+ α µ − + ξ
=
− + ξ + ξ
(7)
2. In the post-resonance region, the spectral values are obtained by Eqn. 8.
(
) (
)
(
)
(
)
(
)
{
}
(
) (
)
2
2 e p p 2
p s e s s
s 2
2 2 2
p s p s p s
S T ,
T / T 1 1 S T , R
A
1 T / T 4 T / T
µ
ξ
+ α µ − + ξ
=
− + ξ + ξ
(8)
In the case of the stiffness degrading Q models, the ratio Tp/Ts in Eqn. 8 should be replaced with
the ratio Tp,µ/Ts, where Tp,µ represents the effective natural period of the structure. It depends on the
inelastic deformation which is expressed in terms of ductility. It can be defined by Eqn. 9 proposed by Akiyama (1985).
p, p
1 T T
3
µ
+ µ + µ
= (9)
(
)
(
)
e p p
s
S T ,
A AMP 1 1
Rµ
ξ
= + α µ − (10)
EVALUATION OF THE PROPOSED DIRECT METHOD
The proposed direct method was used to compute a large number of floor response spectra which were then compared with the “accurate” spectra obtained in the parametric study, in order to evaluate the accuracy of the method. Presented results are obtained for the set of ground records which corresponds to the soil type B and for structure with Tp=0.3 sec. Two different values of µ are considered. Damping of
structure amounted to 5%, whereas damping of equipment amounted to 1% and 5%.
The natural period of the structure (Tp) cannot be accurately determined due to uncertainties in
input parameters. In practice, these uncertainties are usually considered by broadening the peaks of floor response spectra. According to USNRC (1978), the frequency region where the spectrum should be broadened is obtained by considering a ±15% variation in the frequencies associated with the spectral peaks. This approach was used also in comparisons presented in this paper. Note that in the case of the Q models, the broadening was made considering both the initial natural period Tp and the effective natural
period Tp,µ, resulting in a quite broad plateau of the floor spectrum.
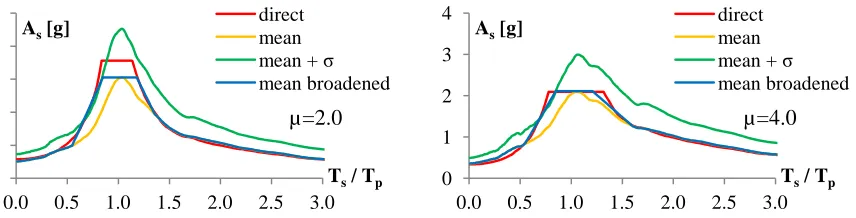
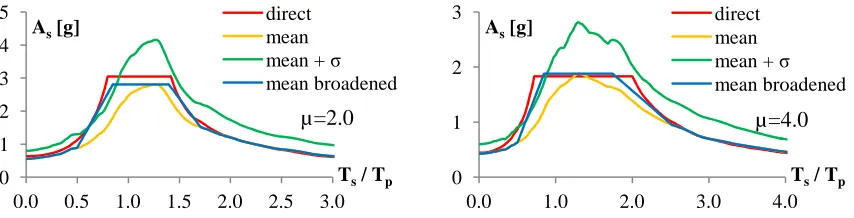
Figs. 8-13 show the mean, mean plus standard deviation (σ) and broadened mean values of “accurate” floor response spectra, as well as the approximate spectra computed by the proposed direct method, for the EP model and the Q models with zero and 10% hardening. It is obvious that the proposed direct method provides reasonably fair estimates of the broadened “accurate” spectra throughout the whole period range. Differences that occur in the resonance region are, inter alia, a result of the differences between the “accurate” inelastic design spectrum and the approximate spectrum obtained by using the idealized factor Rµ, according to Eqns. 3 and 4.
Figure 8. Floor response spectra for EP model of the structure (soil type B, Tp=0.3 sec, 5% damping of
the structure and 1% damping of the equipment)
Figure 9. Floor response spectra for EP model of the structure (soil type B, Tp=0.3 sec, 5% damping of
the structure and the equipment)
0 2 4 6 8 10
0.0 0.5 1.0 1.5 2.0 2.5 3.0 As[g]
Ts/ Tp direct
mean mean + σ
mean broadened
µ=2.0
0 1 2 3 4 5 6 7
0.0 0.5 1.0 1.5 2.0 2.5 3.0 As[g]
Ts/ Tp direct
mean mean + σ
mean broadened
µ=4.0
0 1 2 3 4 5
0.0 0.5 1.0 1.5 2.0 2.5 3.0 As[g]
Ts/ Tp direct
mean mean + σ
mean broadened
µ=2.0
0 1 2 3 4
0.0 0.5 1.0 1.5 2.0 2.5 3.0 As[g]
Ts/ Tp direct
mean mean + σ
mean broadened
Figure 10. Floor response spectra for Q model (with zero hardening) of the structure (soil type B, Tp=0.3
sec, 5% damping of the structure and 1% damping of the equipment)
Figure 11. Floor response spectra for Q model (with zero hardening) of the structure (soil type B, Tp=0.3
sec, 5% damping of the structure and the equipment)
Figure 12. Floor response spectra for Q model (with 10% hardening) of the structure (soil type B, Tp=0.3
sec, 5% damping of the structure and 1% damping of the equipment)
Figure 13. Floor response spectra for Q model (with 10% hardening) of the structure (soil type B, Tp=0.3
sec, 5% damping of the structure and the equipment)
0 1 2 3 4 5 6 7 8
0.0 0.5 1.0 1.5 2.0 2.5 3.0 As[g]
Ts/ Tp direct
mean mean + σ
mean broadened
µ=2.0
0 1 2 3 4 5
0.0 1.0 2.0 3.0 4.0
As[g]
Ts/ Tp direct
mean mean + σ
mean broadened
µ=4.0
0 1 2 3 4 5
0.0 0.5 1.0 1.5 2.0 2.5 3.0 As[g]
Ts/ Tp direct
mean mean + σ
mean broadened
µ=2.0
0 1 2 3
0.0 1.0 2.0 3.0 4.0
As[g]
Ts/ Tp direct
mean mean + σ
mean broadened
µ=4.0
0 1 2 3 4 5 6 7 8
0.0 0.5 1.0 1.5 2.0 2.5 3.0 As[g]
Ts/ Tp direct
mean mean + σ
mean broadened
µ=2.0
0 1 2 3 4 5
0.0 1.0 2.0 3.0 4.0
As[g]
Ts/ Tp direct
mean mean + σ
mean broadened
µ=4.0
0 1 2 3 4 5
0.0 0.5 1.0 1.5 2.0 2.5 3.0 As[g]
Ts/ Tp direct
mean mean + σ
mean broadened
µ=2.0
0 1 2 3
0.0 1.0 2.0 3.0 4.0
As[g]
Ts/ Tp direct
mean mean + σ
mean broadened
CONCLUSIONS
Inelastic behaviour of the structure significantly reduces peak values of floor response spectra. In the case of the EP model, peak values of inelastic floor response spectra occur when equipment and structure are in resonance (Ts=Tp), whereas they are shifted towards higher periods in the case of the
stiffness degrading Q models. The amplification factor, defined as the ratio between the peak value of the floor acceleration spectrum and the maximum acceleration of the primary structure, is primarily influenced by the damping of equipment. The characteristics of ground motion in terms of the characteristic period of ground motion TC have only a small influence on the maximum values of the
amplification factor, provided that the ratio Tp/TC is plotted on the x-axis.
Based on the results obtained in an extensive parametric study, a simple approximate practice-oriented method for the generation of floor response spectra for inelastic structures directly from the design response spectrum is proposed. The proposed method is based on the method originally proposed by Yasui et al. (1993), in which several changes have been made. Approximate inelastic spectra are introduced through a reduction factor Rµ. The effective natural period of the structure is described by an
approximate expression defined by Akiyama (1985). In the pre-resonance region sum of the amplitudes of the structure and the equipment is used instead of the SRSS combination rule in the formula for the determination of floor response spectra. In order to obtain realistic results in the resonance region, proposed amplification factors are used. The influence of hardening is taken into account throughout the whole period range. The method is applicable for both EP and Q models of the structure. The results obtained by the proposed method show a reasonable agreement with the broadened “accurate” results. The application of the proposed method is limited to the case of inelastic SDOF structures or MDOF structures which can be approximated as an equivalent SDOF system. The method can be used for a quick estimation of the floor response spectra, e.g. in conceptual design or when checking the results.
REFERENCES
Akiyama, H. (1985). Earthquake Resistant Limit State Design for Buildings, University of Tokyo Press. CEN (2004). Eurocode 8 - Design of structures for earthquake resistance. Part 1: General rules, seismic
actions and rules for buildings, European standard EN 1998-1, Brussels.
Fajfar, P. and Novak, D. (1995). “Floor response spectra for inelastic structures,” Transactions of the 13th
International Conference on Structural Mechanics in Reactor Technology (SMiRT 13), Porto
Alegre, Brazil, K044/1, 259-264.
Lin, J. and Mahin, S. A. (1985). “Seismic response of light subsystems on inelastic structures,” Journal of
Structural Engineering, ASCE, 111(2), 400-417.
Novak, D. and Fajfar, P. (1994). “Nelinearni etažni spektri odziva za racionalno aseizmično projektiranje opreme,” Zbornik 16. zborovanja gradbenih konstruktorjev Slovenije, Društvo gradbenih konstruk-torjev, Društvo za potresno inženirstvo, Bled, Slovenia, 95-102 (in Slovenian).
USNRC (1978). Development of floor design response spectra for seismic design of floor-supported equipment or components, Regulatory Guide 1.122, Revision 1, Washington, D.C.
Vidic, T., Fajfar, P. and Fischinger, M. (1994). “Consistent inelastic design spectra: strength and displacement,” Earthquake Engineering and Structural Dynamics, 23(5), John Wiley & Sons, 507-521.
Villaverde, R. (1997). “Seismic design of secondary structures: state of the art,” Journal of Structural
Engineering, ASCE, 123(8), 1011-1019.
Vukobratović, V. and Fajfar, P. (2012). “A Method for Direct Determination of Inelastic Floor Response Spectra,” Proceedings of the 15th World Conference on Earthquake Engineering, Lisbon, Portugal,
Paper No. 727.