KOO, JUNE MO Computational Nanofluid Flow and Heat Transfer Analyses Applied to
Micro-systems. (Under the direction of Professor C. Kleinstreuer).
The compactness and high surface-to-volume ratios of microscale liquid flow
de-vices make them attractive alternatives to conventional flow systems for heat transfer
aug-mentation, chemical reactor or combustor miniaturization, aerospace technology
implemen-tations, as well as biomedical applications, such as drug delivery, DNA sequencing, and
bio-MEMS, to name a few. While experimental evidence indicates that fluid flow in
mi-crochannels, especially in terms of wall friction and heat transfer performance, differs from
macrochannel flow behavior, laboratory observations are often inconsistent and
contra-dictory. Some researchers attributed the deviations to unknown microscale effects, which
often turned out to originate from inappropriate approaches to analyze the new phenomena.
Specifically, system parameters were neglected, which are not important on the macroscale
but play important roles in microscale analyses.
The main objectives of the study areto identify important parameters for microscale liquid
flows and nanoparticle suspensions, to find a physically sound way to analyze the new
phe-nomena, and to provide mathematical models to simulate them.
Scale analysis was found to be a valuable tool to determine which forces become important
on the microscale. With increasing system miniaturization surface forces, such as surface
tension and van der Waals forces, take over the control from body forces like gravity and
pressure. Furthermore, surface roughness, viscous dissipation, and entrance region effects
approach, in conjunction with appropriate closure models, is appropriate to analyze
mi-croscale effects.
Employing the porous medium layer (PML) idea, surface roughness effects on
momentum-and heat-transfer in micro-conduits were numerically investigated momentum-and verified with
experi-mental data. The friction factor and Nusselt number either increase or decrease depending
on the PML model parameters, expressed in terms of the relative surface roughness, Darcy
number, Reynolds number, and effective thermal conductivity. Variations in the viscous
dissipation effect were found to increasingly affect the friction factor and Nusselt number
with decreasing system size. Variations in entrance geometry may cause early
laminar-to-turbulent transition resulting in higher friction factor values.
When nanoparticles are added to liquid flow systems, scalar transport properties can be
significantly enhanced. Specifically, nanofluids, i.e., dilute suspensions of nanoparticles in
liquids, are used to enhance heat transfer performance or to maximize drug delivery.
Fo-cusing on micro-scale heat transfer, it was found that the particle Brownian motion and
the induced surrounding liquid motion are key mechanisms for the experimentally observed
high increase of the effective thermal conductivity of nanofluids. A new, experimentally
validated effective thermal conductivity model has been developed based on kinetic
the-ory. The model predicts both the effective thermal conductivity and dynamic viscosity of
nanofluids in terms of nanoparticle concentration, size, density and their interaction
poten-tial as well as the density, thermal capacity and dielectric constant of the base liquid.
sys-number together with nanoparticles of high thermal conductivity in a channel of high
as-pect ratio, form a desirable combination for optimal performance. In order to minimize
the problem of non-uniform suspensions, the selection of materials for the carrier fluid,
nanoparticles and conduit wall was found to be very important. For example, the dielectric
constants difference should be kept small, and appropriate surface treatment, by creating
either electrostatic or steric forces to maintain enough repulsion potential, should be
pro-vided.
In the case of nanotherapeutics, radial diffusion turns out to be the controlling
mecha-nism for drug delivery. Specifically, the time scale for radial diffusion should be kept small
enough to ensure efficient delivery. A shallow channel design together with a pressure
cham-ber to switch between drug delivery- and purging-process, is suggested over the alternative
by
JUNEMO KOO
A dissertation submitted to the Graduate Faculty of North Carolina State University
in partial satisfaction of the requirements for the Degree of
Doctor of Philosophy
MECHANICAL AND AEROSPACE ENGINEERING
Raleigh, NC 2005
Approved By:
Dr. C. Kleinstreuer Dr. J. P. Archie
Chair of Advisory Committee
To my considerate wife, Jungeun,
our lovely son, Daeone, and
Biography
The author was born on October 22, 1970 in Seoul.
After graduating from high school, he was admitted to the Korea Advanced
In-stitute of Science and Technology (KAIST) in 1990 and studied in the Department of
Mechanical Engineering. He continued his graduate study in the same department
concen-trating on internal combustion engines and earned his Master of Science degree in 1996.
Afterwards the author was employed as an engineer by POSCO Engineering and
Construction Co., Ltd. in Seoul, Korea. He worked in the Oversea Sales Department for
two years. Afterwards, he stayed at KAIST for three and a half years as a PhD student.
The author enrolled as a doctoral student August, 2001 in the Department of
Me-chanical and Aerospace Engineering at North Carolina State University in Raleigh, NC. His
dissertation research focused on computational nanofluid flow and heat transfer analyses
applied to micro-systems. He has been a McDonald-Kleinstreuer Fellow for three years and
is proud to be a member of Phi-Kappa-Phi honor society.
The author wed the former Jungeun Yeo in 2000. They have a lovely son, Daeone,
Acknowledgments
I would like to express a great deal of appreciation for Dr. C. Kleinstreuer, Chairman of
my advisory committee. His physical insight, guidance and encouragement have been the
impetus for me to keep working hard and to succeed. He has proven to be a very considerate
and patient advisor who serves as a role model for professional excellence and integrity.
I would like to express the greatest gratitude to Dr. J. P. Archie, Jr. and his wife Sarah for
the generous endowment of the McDonald-Kleinstreuer Fellowship and to him serving as a
committee member. Continuation of the McDonald-Kleinstreuer Fellowship over the years
was made possible via a commitment by the former Department Head, Professor M. Noori.
Without the financial support, I could not even have dreamt of coming to the United States
to pursue the degree.
Appreciation is also extended to Dr. S. McRae and Dr. T. Echekki for serving as committee
members, and offering superb computational fluid dynamics and combustion classes. Many
ideas in this dissertation were obtained from their classes.
Special thanks goes to Dr. S. Hyun (Mercer University, Macon, GA) for his considerate
care when I first arrived here. The author appreciates Dr. T. Lee in Duke University for
providing the background information on nano-drug delivery systems and Dr. J. Chang in
Intel for providing background information on micro heat-sinks. The author was happy to
be with all the members in our Computation Fluid-Particle Dynamics Laboratory, including
Dr. Z. Zhang, Dr. P. W. Longest, Dr. S. Hyun, Mr. Z. Li, Mr. H. Shi, Mr. Z. Li, and Mr.
B. W. Kennedy.
I feel indebted to professors in KAIST including Dr. C. Bae, Dr. H. Shin, Dr. S. Lee, Dr.
S. Choi, and Dr. S. Kim. Their teachings set a solid base to climb up to the top.
A special debt of gratitude should go to my wife and son, who spent most of their days
and nights without their husband and father, and to my parents and parents-in-law, who
supported me in every way to concentrate only on my studies. I should confess that I could
Contents
List of Figures viii
List of Tables xv
1 INTRODUCTION and LITERATURE REVIEW 1
1.1 Motivation . . . 2
1.2 Research Objectives . . . 3
1.3 Nanofluid Flow and Heat Transfer in Microchannels . . . 4
1.3.1 Characteristics of Nanofluids . . . 4
1.3.2 Driving forces for Microchannel flow . . . 15
1.3.3 Momentum and Heat Transfer in Microchannels . . . 29
1.4 Numerical Solution Techniques . . . 32
1.4.1 Molecular Dynamics (all Knudsen numbers) . . . 32
1.4.2 Direct Simulation Monte Carlo (0.16Kn6 10) . . . 37
1.4.3 Direct Numerical Simulation (Kn60.1) . . . 47
1.4.4 Approximate Methods (Kn60.5) . . . 51
1.4.5 Summary . . . 53
2.2 Governing Equations for Microchannel Flow . . . 56
2.3 Nanofluid Property Models . . . 59
2.3.1 Effective Thermal Conductivity Model . . . 59
2.3.2 Thermal conductivity due to thermo-phoresis . . . 69
2.3.3 Thermal conductivity due to the osmo-phoresis . . . 71
2.3.4 Comparisons . . . 72
2.3.5 Effective Dynamic Viscosity Model . . . 74
2.3.6 The effect of particle-wall interaction . . . 75
3 LIQUID FLOW in MICROCHANNELS 78 3.1 Introduction . . . 79
3.2 Friction Factor Analysis . . . 83
3.3 Surface Roughness Effect . . . 85
3.3.1 Effects on momentum transfer . . . 85
3.3.2 Effects on energy Transfer . . . 92
3.3.3 Summary . . . 104
3.4 Viscous Heating Effect . . . 106
3.4.1 Viscous dissipation effect . . . 106
3.4.2 Governing equations and scale analyses in tubes . . . 107
3.4.3 Numerical solution for rectangular ducts . . . 111
3.4.4 Model validations . . . 112
3.4.5 Results and Discussion . . . 115
3.4.6 Summary . . . 120
3.5 Entrance and other Microchannel Effects . . . 122
3.5.1 Entrance effect . . . 122
3.5.2 Non-Newtonian fluid effects . . . 122
3.5.3 Wall slip effects . . . 124
3.5.5 Summary . . . 129
3.6 Nanofluids Properties Model . . . 130
3.6.1 Higher thermal conductivities due to Brownian motion effect. . . 130
3.6.2 Interparticle interactions at high concentrations (αd>1 %) . . . 133
3.6.3 Examples of heat conduction in nanofluids. . . 134
3.6.4 Brownian motion effect on momentum transfer . . . 141
3.6.5 Particle non-sphericity effect on the thermal conductivity . . . 142
3.6.6 Summary . . . 146
4 NANOFLUID FLOW APPLICATIONS 148 4.1 Introduction . . . 149
4.2 Micro Heat-Sinks . . . 149
4.2.1 Introduction . . . 149
4.2.2 Theory . . . 152
4.2.3 Results and Discussion . . . 169
4.2.4 Summary . . . 185
4.3 BioMEMS . . . 186
4.3.1 Introduction . . . 186
4.3.2 Theory . . . 186
4.3.3 Results . . . 188
4.3.4 Summary . . . 201
5 CONCLUSIONS and FUTURE WORK 203 5.1 Conclusions and Novel Contributions . . . 204
5.2 Future Work . . . 207
List of Figures
1.1 Schematic of the operation principle with electronic ink. . . 18
1.2 A schematic for 2D gel electrophoresis on a microchip. The first dimension of separation operates by isoelectric focussing. From this level, the separated goups of molecules are conducted to the second dimension of separation. The separation of molecules occurs by electrophoresis. . . 20
1.3 Continuous electro-wetting (CEW) effect . . . 23
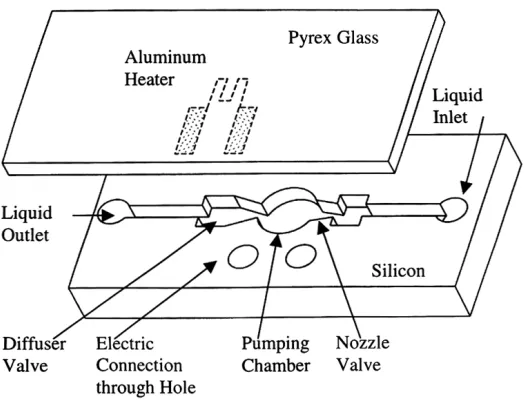
1.4 Schematic drawing of the nozzle-diffuser based bubble pump (Tsai & Lin, 2002) . . . 24
1.5 Schematic drawing of the exemplary integrated system of a micropump and a mixing channel. . . 25
1.6 Principle of bubble valve for micro-injector (Kim, 1999) . . . 26
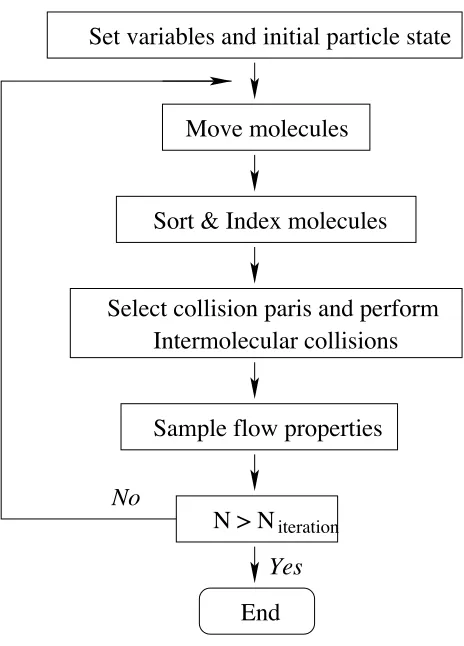
1.7 DSMC flowchart . . . 43
1.8 System sketch of shear-driven flow; U0 is the moving wall velocity. . . 44
1.9 Comparison of velocity profiles obtained with DSMC and conventional lam-inar flow theory. The velocity differences at the walls show the slip velocity, which increases with Kn. The slower flows show higher velocity fluctuations. 45 1.10 Two-dimensional axial velocity contours for the pressure-driven flow case with an inlet velocity of 1,000 m/sec . . . 45
1.11 Axial velocities at the entrance, mid-point, and exit of a two-dimensional
1.12 Two-dimensional number density contours for pressure-driven flow with an
inlet velocity of 1,000 m/sec . . . 46
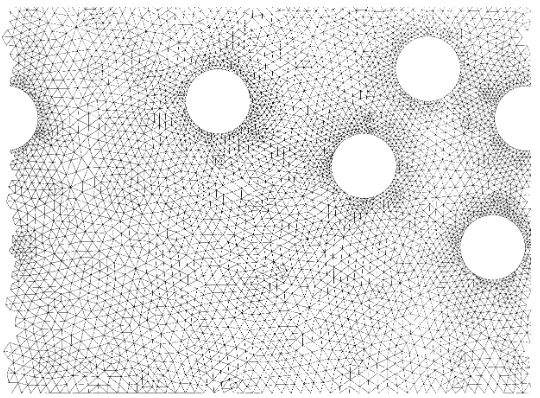
1.13 Unstructured grid for the ALE method . . . 49
1.14 Fixed triangular grid used in DLM computation. The same grid covers the
fluid and solid. The fluid in the circles is bordered by Lagrange multipliers
to move the particles (circles) as a rigid bodies. . . 50
1.15 Porous medium layer equivalent to surface roughness and simple
microchan-nel geometry: a) real surface roughness; b) homogeneous distribution of
iden-tical roughness elements; and c) mid-plane view of conduit with idealized
roughness layer, or porous medium layer (PML) . . . 52
2.1 Illustrative schematic explaining the particles’ Brownian-motion effect on
micro-mixing . . . 61
2.2 A traveling particle carries fluid around it due to viscous effect. For a low
Reynolds number flow, the amount of fluid travel with a particle could be
obtained by using Eq. (2.9). . . 64
2.3 Expectation for a particle to travel in thex-direction . . . 67
2.4 The particle size effect on kef f. . . 70
2.5 Comparison of three different particle dynamics effects on the thermal
con-ductivity enhancement . . . 73
2.6 The particle-liquid-wall interaction effect on nanoparticle distribution near
the wall . . . 76
3.1 Effect of the Darcy number on steady 2-D fully-developed flows (Brinkman
term only): (a) parallel-plate case and (b) circular tube case. . . 88
3.2 Effect of the Darcy number on steady 2-D fully-developed flows (Brinkman
term only): (a) parallel-plate case and (b) circular tube case. . . 89
3.3 Comparisons of porous medium layer (PML) model predictions with
3.4 PML thermal conductivity effect on the temperature profiles between parallel
plates (Da=10−3,SR = 2 [%]) . . . 97 3.5 Darcy number effect on the temperature profiles between parallel plates (SR
= 2 [%]) . . . 97
3.6 Effects of PML Darcy number and thermal conductivity on the Nusselt
num-ber for parallel plates (Re= 1000, SR = 2 [%]) . . . 98
3.7 Effect of the Reynolds number on the Nusselt number for different Darcy
numbers and the conductivity ratios (SR = 2 [%]) . . . 100
3.8 Effects of PML thickness on the Nusselt number (Re = 1000) . . . 100
3.9 Effects of PML Darcy number and thermal conductivity on the Nusselt
num-ber (Re = 1000, SR = 2 [%]) . . . 101
3.10 Effect of the Reynolds number on the Nusselt number (SR = 2 [%]) . . . . 102
3.11 Effect of PML thickness on the Nusselt number (Re = 1000) . . . 103
3.12 Effects of viscosity changes for different radial temperature distributions ∆T
on tubular velocity profiles . . . 108
3.13 Working fluid effect on mean temperature rise (L/D=1500, Re=300) . . . . 112
3.14 Comparison of temperature rises in rectangular channels (Pfhaler et al.,
1991). Note : the experimental trapezoidal channels of hydraulic diameter
30 and 40 µm were modeled as rectangular channels of the same hydraulic
diameters and the same aspect ratio . . . 114
3.15 Comparison between experimental data (Pfhaler et al., 1991) and
computa-tional results . . . 114
3.16 Tube size effect on temperature change, i.e., viscous dissipation (water, Re=2,000):
a) adiabatic wall case; b) constant wall temperature case . . . 116
3.17 Effect of channel aspect ratio on temperature change due to viscous
dissipa-tion for iso-propanol flows in channels of Dh= 6µmwith Re=0.2 . . . 116
3.19 Comparison of heat source term impact due to viscous dissipation, Sv, and
thermal boundary, Sh, for 100≤Re≤2000: a) in a 74 µm square channel;
and b) Fractions of source terms in 40µm and 74 µm square channels . . . 120
3.20 Comparison of friction factor deviations in a channel entrance (h/w=1.0)
based on experimental observations (Eq. (3.4)) and computer simulation
results for various Reynolds numbers . . . 123
3.21 Effect of height-to-width ratio on apparent friction factor for Re=1,000 . . . 123
3.22 Effect of non-Newtonian fluid behavior on the friction factor . . . 127
3.23 Schematic diagram of the geometry used in computing the effect of sudden
contraction on laminar-to-turbulent flow transition. . . 127
3.24 Evolution of velocity components, turbulent kinetic energy, apparent
vis-cosity and pressure in a microchannel (50 % contraction, Re = 2000): (a)
evolution of axial velocity profile, (b) evolution of radial velocity profile, (c)
evolution of turbulent kinetic energy and (d) pressure profile in axial direction.128
3.25 Experimental data sets . . . 131
3.26 Comparison of model predictions with experimental data sets . . . 131
3.27 Comparison ofβ-functions obtained from experimental data . . . 132
3.28 Comparison of effect of the exponent in the intermolecular potential on
im-pact distance . . . 134
3.29 The particle size effect on the effective thermal conductivity at T = 300
[K];f(T, αd)≡1 . . . 135
3.30 The particle type effect on the effective thermal conductivity at T = 300
[K];f(T, αd)≡1 . . . 136
3.31 Comparisons of temperature, temperature gradient, and effective thermal
conductivity profiles . . . 138
3.32 Volume fraction profiles . . . 139
3.33 Effect of volume fraction change on temperature-, temperature gradient-, and
3.34 The particle size effect on the effective viscosity for water-CuO nanofluids at
300 [K];f(T, αd)≡1 . . . 141
3.35 Schematic diagram to explain the effect of particle rotation . . . 144
3.36 Comparison of model constants β among nanotube (Choi et al., 2001), Cu
(Eastman et al., 2001), and CuO (Wang et al., 2003) suspensions . . . 145
4.1 Schematic diagrams of (a) 2-D ODE problems and (b) 3-D PDE problems . 153
4.2 Fin efficiency . . . 156
4.3 Porous medium analogy . . . 157
4.4 Comparison between the full partial-differential-equation solution ((a) atx=
0.0006 [m] and (b) atx= 0.008 [m]) and (c) the reduced
ordinary-differential-equation solution for the water based CuO nanofluid under the heat flux of
100 [W/cm2] . . . 171
4.5 Comparison between the full partial-differential-equation solution ((a) atx=
0.0006 [m] and (b) atx= 0.008 [m]) and (c) the reduced
ordinary-differential-equation solution for the Ethylene Glycol based CuO nanofluid under the
heat flux of 100 [W/cm2] . . . 172
4.6 Comparison of the pressure gradient increase, and effective thermal
conduc-tivity between ethylene glycol- and water-base CuOnanofluids . . . 173
4.7 Influence of temperature-function f on dimensionless pressure gradient and
effective thermal conductivity for water-based CuO nanofluids . . . 174
4.8 The viscous dissipation effect on non-dimensional temperature profiles for
ethylene glycol-based CuO nanofluids (αd = 4 [%], y∗ = y/H, f ≡ 1);(a)
x= 0.0006 [m], and (b) x= 0.008 [m] . . . 176
4.9 The viscous dissipation effect on non-dimensional temperature profiles for
water-basedCuOnanofluids (αd= 4 [%],f ≡1);(a)x= 0.0006 [m], and (b)
4.10 Comparison of temperature profiles of pure-fluid cooling and nanofluid
cool-ing cases (f ≡1) . . . 178
4.11 Nusselt number comparisons for ethylene glycol- and water-based nanofluids with different CuO-volume fractions (q00= 100 [W/cm2],f ≡1) . . . 180
4.12 The effect of functionf on temperature profiles . . . 181
4.13 The effect of functionf on the Nusselt number . . . 182
4.14 The particle-liquid-wall interaction effect on nanoparticle distribution near the wall . . . 184
4.15 Dispersion by convection; (Top) at t=0, (Bottom) at time t (sec) (Probstein, 2003) . . . 188
4.16 Velocity distribution in two-drug-stream system . . . 189
4.17 Concentration distribution at (a) the mid-plane (Z=0) and (b) at the wall (Z=200 [µm])at t = 10 [sec] . . . 190
4.18 Concentration distribution at (a) the mid-plane (Z=0) and (b) at the wall (Z=200 [µm])at t = 130 [sec] . . . 191
4.19 Prelimimary schematic sketch of the drug delivery channel (1) . . . 192
4.20 Prelimimary schematic sketch of the drug delivery channel (2) . . . 193
4.21 Sketch of the new system . . . 194
4.22 The function of a plenum chamber (top-view); the pressure gradients are uniform for all branches. . . 195
4.23 The function of a plenum chamber (top-view); the velocity fileds are uniform for all branches. . . 195
4.24 The function of a plenum chamber (side-view) . . . 196
4.25 Snapshots of concentration distributions during purging process; (a) 0.001 [sec]; (b) 0.017 [sec]; (c) 0.041 [sec] . . . 197
4.27 The snapshots of concentration distributions during drug supply process; (a)
0 [sec]; (b) 0.05 [sec]; (c) 1 [sec] . . . 199
List of Tables
1.1 Conventional models of effective thermal conductivity of solid/liquid
sus-pensions ke, thermal conductivity of base fluid km, thermal conductivity of
particle k2, thermal conductivity ratio α = k2/km, β = (α−1)/(α + 2),
particle shape factornand particle volume fraction v, Xue (2003) . . . 6
1.2 Experimental data; d : particle diameter, αd : volume fraction . . . 8
2.1 Particle speed due to the Brownian effect and corresponding particle Reynolds
number of Cu-nanoparticle-water suspensions . . . 61
2.2 Parameter values for different materials (see Eq. (4.75)) . . . 66
2.3 Comparison of augmented thermal conductivities . . . 67
3.1 Experimental observations of fluid flow characteristics in microchannels . . 80
3.2 Classification of experimental observations . . . 81
3.3 Typical values of relative surface roughness(h/Dh×100[%]) . . . 86
3.4 Typical PML parameters. . . 87
3.5 Mechanical and thermodynamic properties of various working fluids at 298K
(Zabransky, 1996; MatWeb, 1999) . . . 113
3.6 Magnitude comparisons between convective, diffusion and dissipation terms
Chapter 1
INTRODUCTION and
1.1
Motivation
Starting with the automobile airbag sensors, MEMS devices have been developed
for applications in engineering heat and mass transfer, biomedical drug delivery, aerospace
technology, micro reactors, etc. However, the understanding of microscale phenomena is
still in its infancy due to the fact that such devices have different length- and time-scales
than those of our everyday life.
As Trimmer and Stroud (2002) reported, different forces rule on different scales, and scaling
theory is a valuable tool to determine which force becomes important on the microscale.
For example, gravitational forces dominate on an astronomical scale, i.e., the motion of our
planet around the sun and our sun around the galaxy is driven mostly by gravitational
forces. Yet, on the macroscale of a desk top, the gravitational force between two objects,
e.g., a tape dispenser and stapler, is insignificant. Based on scale analysis, they showed that
on the microscale surface tension and wall effects becomes more important when compared
to electrostatic, pressure, biochemical and magnetic forces which rule on the macroscale.
From a literature review, it was found that experimental observations were, sometimes,
contradictory among researchers, and it is very important to identify the origin of the
dis-crepancies. In this study, various parameters such as surface roughness, viscous dissipation,
and entrance geometry, among others, were examined to explain the diverging experimental
observations.
For example, Pfhaler et al. (1990) raised pertinent questions concerning microscale flows:
• Is the continuum assumption still valid?
• Whether the Navier-Stokes equations adequately model the fluid flow in very small
scales, or they should be modified, if so, how?
• Do phenomena that are typically ignored in large-scale analyses become important in
small-scale channels?
To find answers to these questions, it is necessary to test the assumptions of various analysis
methods and to select a proper modeling method.
Over a decade, attempts have been made to use dilute nanoparticle suspensions as working
fluids in heat exchangers to improve the efficiency. Researchers observed unconventionally
high thermal conductivities with nanoparticle suspensions and suggested various ad-hoc
models to explain the phenomenon. In a conventional approach, the effect of the
parti-cle Brownian motion is neglected due to the assumed large partiparti-cle size. As the partiparti-cle
size scale approaches the nano-meter range, the particle Brownian motion and its effect on
surrounding liquids come to play an important role in heat and mass transfer. The
inter-particle interaction force which is negligible on the macroscale is found to be very important
for nanoparticle suspensions since the force scales are inversely proportional toL−2, while other body forces vary with L2. Thus, the design procedure for microscale systems should
be different from that for macroscale systems. Nevertheless, actual systems may work on
both the microscale and macroscale, and it is important to interface both scales in the
design phase.
As indicated, it is important to identify dominant forces and mechanisms for the analysis
and design of microscale systems.
1.2
Research Objectives
The objectives of this study are:
• to identify important parameters for microscale liquid flows and nanoparticle
suspen-sions;
• to find a proper way to simulate the phenomena; and
1.3
Nanofluid Flow and Heat Transfer in Microchannels
1.3.1 Characteristics of Nanofluids
Nanofluids, as coined by Choi (1995), represent a new class of engineered heat
transfer fluids, which contain metallic particles with average particle sizes of about 10
nanometers. They could be produced by using a physical gas-phase condensation process
or chemical synthesis technique in order to increase the thermal conductivity of working
flu-ids. Low thermal conductivity is a primary limitation in the development of energy-efficient
heat transfer fluids that are required in many industrial applications. Despite considerable
previous research and development efforts on heat transfer enhancement, major
improve-ments in cooling capabilities have been lacking because of the low thermal conductivities
of conventional heat transfer fluids (Choi, 1995). An innovative new class of heat transfer
fluids can be engineered by suspending metallic nanoparticles in conventional heat
trans-fer fluids. The resulting “nanofluids” are expected to exhibit high thermal conductivities
compared to those of currently used coolants, and they represent a clear possibility for
enhancement of heat transfer.
The basic idea is that by using the orders-of-magnitude larger thermal conductivities of
metals compared to those of fluids, very high conductivities are expected for nanofluids.
For example, the thermal conductivity of copper at room temperature is about 700 times
greater than that of water and about 3000 times greater than that of engine oil. Even
oxides such as alumina (Al2O3), which are insulators compared to metals such as copper,
have thermal conductivities more than an order-of-magnitude larger than water.
The most important benefit of the fluids is dramatic reductions in necessary pumping power
for heat exchangers, which results in significant energy and cost savings and supports the
current industrial trend towards component miniaturization. Heat exchangers are used in
vehicular and avionic cooling systems in the transportation industry, hydraulic heating and
cooling systems in buildings, and industrial process heating and cooling systems in
advantage of nanofluids over conventional suspensions of coarse-grained particles in fluid
systems is in their expected improved abrasion-related properties, since nanofluids will
im-part little impulse in collisions with component surfaces. For example, Hu and Dong (1998)
reported that titanium oxide suspension in oil could enhance the wear resistance because
of its deposition on rubbing surface.
In fact, numerous theoretical and experimental studies concerning effective thermal
con-ductivities of mixtures that contain solid particles have been conducted since Maxwell’s
theoretical work was published more than 100 years ago (see Table 1.1). However, all of
the studies on thermal conductivities of suspensions have been confined to millimeter- or
micrometer-size particles. Maxwell’s model shows that the effective thermal conductivity
of suspensions that contain spherical particles increases with the volume fraction of the
solid particles. It is also known that the thermal conductivity of suspensions increases with
the ratio of the surface area to volume of the particle. One of the problems identified for
micrometer-size particles in fluids is that they cause clogging. The influence of particle
loading and size on the pressure drop of slurries was reported by Liu et al. (1988). It states
that solid-particle suspensions in the 20 % volume fraction range incur little or no penalty
in pressure drop as compared to single-phase fluids at comparable flow rates. Therefore, it
is reasonable to assume that the nanofluid pressure drop behaves like that of a single phase
6 n and particle volume fractionv, Xue (2003)
Models Expressions Remarks
Maxwell kef f
km = 1 +
3(α−1)v
(α+2)−(α−1)v Spherical particles are considered
Spherical and nonspherical particles are considered: Hamilton-Crosser kef fkm = α+(αn+(−n1)−−1)+(1(n−1)(1−α−)vα)v n=3 for spheres, n=6 for cylinders
Jeffrey kef f
km = 1 + 3βv+
3β2+3β42 +916β32αα+2+3· ··v2 Spherical particles are considered
High-order terms represent pair interaction of
Davis kef f
km = 1 +
3(α−1) (α+2)−(α−1)v
v+f(α)v2+O(v3)
randomly dispersed spheres.
Lu-Lin kef f
km = 1 +αv+bv
2 Spherical and nonspherical particles are considered.
Near- and far-field interactions among two or more
Experimental data
In the ideal mode of the transient hot-wire (THW) apparatus, an infinitely long,
vertical, heat line source of zero heat capacity and infinite thermal conductivity is immersed
at timet=0 in an sample fluid in thermodynamic equilibrium. When a stepwise heat fluxq
per unit length is imposed, the energy is entirely conducted from the line source to the fluid.
For the heat line source of radiusr0 and a uniform initial temperature, the solution for the
temporal temperature rise of the wire can be obtained with a transient lumped-parameter
equation as:
∆T(r0, t) = q 4πkln
4at r20C
(1.1)
The slope of the line ∆T vs lnt determines the thermal conductivity of the fluid.
The important experimental observations are presented in Table 1.2. For example, Lee
et al. (1999) investigated the effect ofAl2O3 andCuOnano-particle suspensions inquiescent
water and ethylene glycol. They observed that the thermal conductivities of the suspensions
increase linearly with volume fraction, αd. In case of the 4 % Al2O3 suspension in ethylen
glycol, they observed about 20 % increase of the thermal conductivity compared to that of
single phase ethylen glycol. They confirmed that the mixture conductivity depends not only
on the conductivity ratio and volume fraction, but also on the particle shape, as indicated
Table 1.2 by comparing their data with data of Masuda et al. (1993). However, they
observed an abnormal increase of thermal conductivity compared to the values predicted
by the conventional relations. They attributed this to size dependence of the thermal
conductivity, which does not exist for mini- and micro-particles. Lee et al. (1999) concluded
that any new models of nanofluid thermal conductivity should include the surface area and
structure dependent behavior as well as the size effect and boundary resistance.
Xuan and Li (2000) carried out the same experiment with Cunano-particles in water and
transformer oil. They listed the reasons of the heat transfer performance enhancement
because of:
8
(nm) (%)
Lee et al. (1999) Al2O3/CuO Water, Ethylene
Glycol
38.4/23.6 1-5 Al2O3good agreement with H-C
model/CuO:showed higher conductivity than H-C model predicts. Ethylene Glycol based nanofluids showed higher value. Al2O3 suspensions showed
higher value.
Masuda et al. (1993) Al2O3 Water 13 4.3 showed higher conductivity than H-C model
pre-dicts. Considered non-spherical particles. Pak and Cho (1998) Al2O3,
T iO2
Water 13/27 1-4.5 both suspensions showed higher effective thermal conductivity than conventional theory predicts.
Al2O3suspension showed higher effective thermal
conductivity. Effective viscosity increased maxi-mum 200 [%]
Xuan and Li (2000) Cu Water 100 0.3-2 the suspension showed higher effective thermal
conductivity than Maxwell relation predicts. Eastman et al. (2001) Cu,Al2O3,
CuO
Water, Ethylene Glycol
<10 0.3 anomalously increased effective thermal conduc-tivity (40 %)
Choi et al. (2001) nanotubes α-olefin oil ∼25×50·
103
0-1 anomalously increased effective thermal conduc-tivity (160 %)
Xie et al. (2002) Al2O3 Ethylene Glycol,
Water, Pump Oil
12-302 0-5 All suspensions showed higher value than H-C model predicts. kef f,DW < kef f,EG < kef f,DE. They observed that pH value and specific surface area of nanoparticles affected the effective thermal conductivity.
Das et al. (2003) Al2O3/CuO Water 38.4/28.6 1-4 both suspensions showed higher value than
Maxwell relation predicts. Al2O3 suspension
showed higher value. They observed temperature dependence of the effective thermal conductivity.
Patel et al. (2003) Au −
citrate/Ag−
citrate
Water,Toluene 15/70 0.00013-0.011
both suspensions showed higher value than Maxwell relation predicts. Both suspensions showed measurable increase even with very small concentrations. They observed temperature de-pendence.
Xie et al. (2003) nanotubes Distilled Water, Ethylene Glycol, Decene
• increased apparent thermal conductivity
• interactions among particles, fluid and the flow passages
• intensified mixing due to velocity fluctuations (and turbulence) of the fluid
• flattened transverse temperature gradient of the fluid
They observed that the heat conductivities of nanofluids (≈100 nm) obey the
Hamilton-Crosser relationship. They compared the enhancement of the heat transfer characteristic
adopting nanofluids as working fluid. They adopted the dispersed model to take the
ran-dom movement of the particles in the bulk flow into account. The effect of dispersion or
backmixing results in flattening the temperature gradient. The contribution of the
nanopar-ticles to convective heat transfer enhancement can be understood from two aspects: The
particles increase the thermal conductivity of the fluid mixture and the chaotic movement
of the particles strengthens the energy transport process.
On the basis of the dispersion model, the governing differential equation for the heat transfer
process between the nanofluid flowing in a tube and the tube surface reads:
∂T
∂t +u
∂T
∂x =
αef f +
Dx
(ρCp)ef f
∂2T
∂x2 +
1 r
∂ ∂r
αef f +
Dr
(ρCp)ef f
r∂T ∂r
(1.2)
whereDx and Dr are the thermal dispersion coefficients to account for the contribution of
hydrodynamic dispersion and the irregular movement of the ultra-fine particles.
In general, the thermal dispersion coefficient should be determined experimentally;
al-though, there exist some analytic correlations for predicting this parameter under a number
of assumptions. It is expected that for nanofluid flow in a tube the thermal dispersion
co-efficient may have the form:
D αf
=f
Re, P r, α,kp kf
,(ρCp)p (ρCp)f
Xuan and Li (2000) obtained an analytic solution for heat transfer with plug flow and
con-cluded that the enhanced performance results not only from its high thermal conductivity
of the mixture, but also from the random movement and dispersion effect of the
nanoparti-cles. More details of the model was represented in their follow-up article (Xuan and Roetzel
(2000)) which is summarized in the next section.
Eastman et al. (2001) observed that a nanofluid consisting of copper nanometer-sized
par-ticles dispersed in ethylene glycol has a much higher effective thermal conductivity than
either pure ethylene glycol or ethylene glycol containing approximately 0.3 vol % of
Cu-nanoparticles of mean diameter < 10 nm. Since the surface-area-to-volume ratio is 1000
times larger for particles with a 10 nm diameter than for particles with 10µm diameter, a
much more dramatic improvement in effective thermal conductivity is expected as a result
of decreasing the particle size in a suspension than can be obtained by altering the shapes
of larger particles. Cu-nanoparticles with little agglomeration and an average diameter of
less than 10 nm were used with loadings up to approximately 0.5 vol %. For some samples,
a small amount of thioglycolic acid (< 1 vol %) was added to the nanofluid to improve
the particle dispersion behavior, for the case they observed most significant increase of the
effective heat conductivity. They reported three important points.
• Very significant increases in thermal conductivity were seen for all measured
nanoflu-ids, with conductivity enhancement of up to 40 % observed for particle loadings well
below one volume per cent.
• Nanofluids containing thioglycolic acid as a dispersion agent show improved behavior
compared to non-acid containing nanofluids. It should be noted that fluids containing
thioglycolic acid, but no particles, showed no improvement in thermal conductivity.
• Fresh nanofluids tested within two days of preparation exhibited slightly higher
con-ductivities than fluids that were stored up to two months prior to measurements.
Based on the Hamilton-Crosser relation (see Table 1.1), for the case of α → ∞, kef fkm →
1 + 1nv−v. For small volume fractions, the relation reduces to kef f
for their case, the increase of effective conductivity cannot exceed 1.5 % for spherical
par-ticles and 3 % for cylindrical parpar-ticles, which means that the experimental results cannot
be interpreted by way of the conventional theory. They mentioned that the lack of size
dependence in conventional formulas.
Choi et al. (2001) produced carbon nanotube-in-oil suspensions and measured their
effec-tive thermal conductivity. The measured thermal conductivity is anomalously greater than
theoretical predictions and is nonlinear with nanotube loadings. They observed a 160 %
increase in thermal conductivity by adding 1 vol % of nanotubes into a synthetic poly (α
-olefin) oil. They attributed this to the ballistic nature of the heat conduction in nanotube
with the organized liquid layer on the solid surface to avoid the acoustic impedance
mis-match, as well as nanotube-nanotube interactions due to the extremely high aspect ratio
and the astronomical number of nanotubes in the liquid.
Keblinski et al. (2002) reported that the origin of the remarkable increases in thermal
conductivity of nanofluids “eludes theoretical understanding” and explored four possible
explanations for the anomalous heat conductivity increase by seeding nano-particles in
fluids: Brownian motion of the particles, molecular-level layering of the liquid at the
liquid-particle interface, the nature of heat transport inside the nanoliquid-particles, and the effects of
nanoparticle clustering.
• Brownian motion
They compared the time scale of Brownian motion (τd= 3πηd
3
6kBT) and that of heating
the particle (τH = d
2Cpρ
6kf ), and conclude the heating time scale is much smaller than
the Brownian motion time scale. This implies that the movement of nanoparticles
due to Brownian motion is too slow to transport significant amounts of heat through
a nanofluid.
• Molecular layering at liquid-particle interface
size, contrary to the experimental results. By contrast, an interface effect that could
enhance thermal conductivity is the layering of the liquid at the solid-liquid interface,
by which the atomic structure of the liquid layer is significantly more ordered than
that of the bulk liquid. Given that the crystalline solids (which are obviously ordered)
display much better thermal properties than liquids, such ordered liquid layering at
the interface would be expected to lead to a higher thermal conductivity. Assuming
that the thermal conductivity of the interfacial liquid is the same as that of the solid,
the layer works as an extended volume of the solid and, hence, increases the volume
fraction,v orαd. However, the experiments and simulations of others showed that a
typical interfacial layer thickness is only on the order of a few atomic distances, i.e.,
≈1 nm. Thus, although the presence of an interfacial layer may play a role in heat
transfer, it is not likely to be solely responsible for an enhancement of the thermal
conductivity.
• Nature of heat transfer in nanoparticles
Macroscopic theories assume diffusive heat transfer. In crystalline solids, such as those
used in nanofluids, heat is carried by phonons, i.e., by propagating lattice vibrations.
Such phonons are created at random, propagate in random directions, are scattered
by each other or by defects, and thus justify the macroscopic descripton of heat
trans-port. In metals, the heat is primarily carried by electrons, which also exhibit diffusive
motion at the microscopic level. Keblinski et al. (2002) compared the mean free path
of a phonon and the particle size, and concluded that the phonon cannot diffuse but
move ballistically across the particle. This implies that the assumption of diffusive
heat transfer in nanoparticles is invalid; consequently, a macroscopic theory, such as
the Hamilton-Crosser theory, does not apply and a theoretical treatment based on
ballistic phonon transport is required. If the particles are so close (1 - 2 nm) that the
phonon can cross the matrix of the liquid, a major increase in thermal conductivity
• Effect of nanoparticle clustering
By creating paths of lower thermal resistance, clustering of particles into percolating
patterns would have a major effect on the effective thermal conductivity. Although
percolating structures cannot be set up, local clustering is possible and indeed has
been observed experimentally. Since within such clusters, heat can move very rapidly,
the volume fraction of the highly conductive phase is larger than the solid volume
and may significantly increase the thermal conductivity. They noted that, in general,
clustering may exert negative effect on heat transfer enhancement, particularly at low
volume fractions, by settling small particles out of the liquid and creating large regions
of “particle free” liquid with high thermal resistance.
Keblinski et al. (2002) asserted the non-effectiveness of Brownian motion and ballistic nature
of heat transfer in nanoparticles by using molecular dynamics. However, they mentioned
that the ballistic nature of heat transfer does not directly relate to the increase of thermal
conductivities.
Xue (2003) as well as Yu and Choi (2003) incorporated the ordered liquid layer
around a solid particle, they called it nanolayer, into a modified Maxwell model. They
proposed that the nanolayer acts as a thermal bridge between a solid and the bulk liquid
and so is key to enhancing the thermal conductivity. The thermal conductivity of the
nanolayer on the surface of the nanoparticle is not known. However, because the layered
molecules are in an intermediate physical state between a bulk liquid and a solid, the
nanolayer of liquid molecules is expected to lead to a higher thermal conductivity than that
of the bulk liquid. Based on this assumption, they modified the Maxwell equation for the
effective thermal conductivity of solid-liquid suspensions to include the effect of this ordered
nanolayer. To show a new connection between the nanolayers and a thermal conductivity
diffusive. This is feasible because the average interparticle distance in nanofluids is much
greater than the mean free path of the liquid molecules. Under this assumption they used
the conventional Maxwell relation as a representative of all other conventional models.
In order to include the effect of the liquid layer, they considered a nanoparticle-in-liquid
suspension with mono-size spherical particles of radiusrand particle volume concentration
φ. They assumed that the layer of thickness h around the particles is more ordered than
that of the bulk liquid and that the thermal conductivity klayer is higher than that of the
bulk liquid. To further simplify their analysis, they assumed that the nanolayer around
each particle could be combined with the particle to form a larger equivalent particle and
that the particle volume concentration is so low that there is no overlap of those equivalent
particles. The above assumptions resulted in an equivalent particle radius r+h and an
increased volume concentration φe, which can be calculated as:
φe=
4
3π(r+h)
3n= 4
3πr
3n(1 +h/r)3 =φ(1 +β)3 (1.4)
where n is the particle number per volume and β = h/r is the ratio of the nanolayer
thickness to the original particle radius. Based on the effective medium theory (Schwartz
et al., 1995), the equivalent thermal conductivity kpe of the equivalent particles can be
calculated as:
kpe =
[2(1−γ) + (1 +β)3(1 + 2γ)]γ
−(1−γ) + (1 +β)3(1 + 2γ) (1.5)
where γ = klayer/kp is the ratio of nanolayer thermal conductivity to particle thermal
conductivity. Plugging the above relation into the Maxwell relation yields the effective
conductivity.
ke=
kpe+ 2k1+ 2(kpe−k1)(1 +β)3φ kpe+ 2k1−(kpe−k1)(1 +β)3φ
k1 (1.6)
Yu and Choi (2003) observed the following:
• Ifklayer>10k1 thermal conductivity enhancement is strongly dependent on the
thick-ness of the nanolayer, but is almost invariant to the thermal conductivity of the
nanolayer. Therefore, they concluded that the thickness of the nanolayer is
impor-tant.
However, Xue (2003) as well as Yu and Choi (2003) adjusted the liquid molecular
layer-thickness and its thermal conductivity to match the experimental data, which turned out
to be non-physical. For example, Xue (2003) assumed a liquid molecular layer to be 3 [nm]
thick and its thermal conductivity to be 2.1 [W/mK]. According to Israelachvili (1992),
the thickness of such a structured layer cannot exceed 4 to 5 molecule diameters which is
usually below 1 [nm]. Furthermore, the intermolecular potential between particle surface
and liquid molecule decreases very fast with distance, so that the molecules of the outer
layer region are relatively free to move. Xue (2003) used the thermal conductivity value of
ice, i.e., 2.1 [W/mK], for the thermal conductivity value of the molecular layer assuming
that water molecule layers on the particle surface would be in a fixed structure just like ice,
which is not true. He referred to Ohara and Suzuki (2000) as evidence that such an
orga-nized “solid-like” structure of a liquid at the surface is a governing factor in heat conduction
from a solid wall to an adjacent liquid. However, Ohara and Suzuki (2000) reported that
the liquid molecular structure around a particle actually reduced the macroscopic heat flux.
Furthermore, Barrat and Chiaruttini (2003) reported that in the case of normal liquids
in contact with a solid, it can be expected that the Kapitza length should be of the order
of a few molecular diameters, which is the same order as the liquid molecular layer thickness.
1.3.2 Driving forces for Microchannel flow
The flow in a microchannel could be driven by a net pressure force as it is in
a macroscale conduits. However, considering the efficiency degradation of pressure driven
momen-tum equations of flows with uncommon driving forces, such as electro-osmosis and surface
tension, could be expressed by using a generalized momentum equation.
∂ρu
∂t +∇ ·(ρu⊗u)− ∇ ·(η·(∇u+∇u
T) +S= 0 (1.7)
whereuis the velocity vector,ρis the fluid density,ηis the fluid viscosity, andSis a source term.
For electro-osmosis driven flows the source termS can be expressed asρEE, whereρE and E are the electric charge density and electric field, respectively.
To simulate the flows using surface tension as the driving force, the boundary conditions at
the interface of the two fluids are changed while there is no source term in the governing
equations. At the interfaces, the boundary condition is specified as
fsα+fsβ+∇sσ = 0 (1.8)
whereαandβ denote the neighboring two fluids, thefsstands for the force at the interface,
and σ is the surface tension.
Detailed submodels and limiting case solutions may be found in Probstein (2003). Here,
application examples are listed.
Electrokinetic forces
Governing equations. The electro-osmotic velocity produced in a smooth circular
cap-illary by a uniform electric field applied along the axis is given as follows. If the
surface is assumed to be negatively charged, then the flow will be in the direction of
the cathode. With the electric body force per unit volume given by fE=ρEE where
the momentum equation can be written
ρDu
Dt =∇ ·τij+ρg+ρEE (1.9)
Neglecting gravitational forces and supposing the flow to be an inertia free capillary
flow, with no pressure gradient, Eq. 1.9 simply reduces to a balance between viscous
and electrical forces:
µ∇2u=−ρEE (1.10)
Applications. Ehrfeld (2003) listed products based on electrokinetic phenomena. He
re-ported that electrokinetic phenomena are based on the fact that a charge separation
occurs at the interface of electrochemical two-phase systems and an electrochemical
double-layer where a so-called electrokinetic or Zeta potential is created. This may
result from a selective dissolution or a specific adsorption of ions on the surface of the
solid phase.
He mentioned that electrophoresis has been widely applied in the life sciences as a
sep-aration technique for colloidal species or macromolecules in a suitable gel. Isoelectric
focusing is a special case of electrophoresis where the pH-dependence of the charge
properties of amphoteric charged species is utilized. These species (e.g., proteins,
pep-tides) are migrating in the electrical field along a continuous pH gradient in a gel to
the isoelectric point, i.e., a steady-state position where their net charge is zero and the
molecule comes to rest. He pointed out that a prerequisite for electro-osmosis is the
presence of immobilized surface charges at the capillary wall (typically a negatively
charged SiO unit) in contact with an electrolyte.
Electronic ink displays. As a real world applications, Ehrfeld (2003) referred to electronic ink displays. The worldwide development of flat panel displays aims
electri-18
externally applied electric field. A prerequisite for electroosmosis is the presence of immobilized surface charges at the capillary wall (typically a negatively charged SiO unit) in contact with an electrolyte. The surface charge density might either be due to ionizable groups, e.g. deprotonation of silanol groups in the case of glass or fused silica capillaries, or caused by strong adsorption of charged species which are present in the buffer solution. This surface charge leads to the forma-tion of an electric double layer by attracting oppositely charged ions from the buffer (e.g. alkali ions). When an electrical field is applied along the capillary the adsorbed ions are not affected while the counterions migrate and cause a movement of the bulk liquid.
Because of the small characteristic dimensions of the double layer and the suspended or dissolved species, respectively, electrokinetic effects can be favorably applied in microdevices. Two special examples will be shortly discussed in the following. It should become evident that electrochemistry is not only important for the production of microstructures but also the funda-mental basis for the functionality of special
microde-vices.
7.1. Electronic ink displays
The worldwide development of flat panel displays aims at wafer-thin, flexible, full-color and large area devices which have a low electrical power consumption and are producible at low cost. Besides advanced liquid crystal displays (LCD) and organic light emitting diode displays (OLED) a novel technology called electronic ink (e-ink) is avery promising approach in this respect
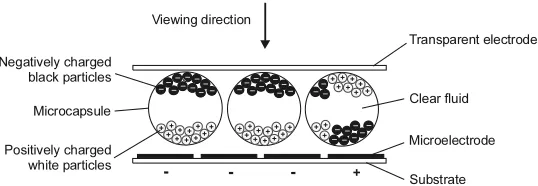
[26]. It has been developed by E-Ink Corporation and utilizes electrophoresis in microcapsules for image gen-eration. The microcapsules have a diameter in the order of 50mm and are filled with a clear fluid and a number of white and black particles which are oppositely charged and can be moved in opposite direction by applying an electrical field (Fig. 9). In order to process the capsules into a thin film millions of them are suspended in a carrier liquid allowing to transfer the suspension, e.g. by means of screen printing, onto a suitable substrate.
The principle of image generation is illustrated byFig. 9. The film comprising the microcapsules is coated with a transparent electrode on the top while addressable microelectrodes are deposited on the substrate at the bottom of the film. When avoltage is applied between the bottom and top electrodes, the oppositely charged black and white particles migrate into the corresponding directions. Evidently, e-ink technology is also applicable for realizing color displays.
For manufacturing electronic displays according to e-ink technology the suspension is printed onto a plastic film that is laminated to a layer of circuitry. The circuitry forms a pattern of pixels, which is controlled by a display driver.
Compared with transmissive LCDs or emissive tech-nologies like OLEDs, field emitter displays and plasma displays the power consumption of electronic ink dis-plays isvery low. This results firstly from the fact that electronic ink displays are fully reflective devices and require no backlight. Secondly, the generation of the image is based on a bistable mechanism, which does not require power for image refreshment. Further adv an-tages compared with reflective LCDs, which have also
very low power consumption, are much more favorable
values for reflectance, contrast ratio andviewing angle. Meanwhile, first portable electronic products like PDAs with e-ink displays are coming into the market and a widevariety of further products is under dev el-opment ranging from eBooks to fashion accessories. In the near future, displays with a size up to 14 in., a resolution of more than 100 pixels in.!1 and color capability are to be expected and, accordingly, micro-structures involving electrophoresis may play a signifi-cant role in information technology and entertainment.
7.2. Microfluidic devices (lab-on-a-chip)
The term ‘‘lab-on-a-chip’’ may still sound like science fiction but powerful microdevices for analytical bio-chemistry and medical diagnosis are meanwhile pro-duced by a number of companies. Usually, a distinction is made between two types of devices. So-called micro-arrays mainly aim at high throughput screening of a huge number of substances in drug development using
Fig. 9. Scheme of the operation principle of the electronic ink.
Figure 1.1: Schematic of the operation principle with electronic ink.
cal power consumption and are producible at low cost. Besides advanced liquid
crystal displays (LCD) and organic light emitting diode displays (OLED) a novel
technology called electronic ink (e-ink) is a very promising approach in this
re-spect. It has been developed by E-Ink Corporation and utilizes electrophoresis
in microcapsules for image generation. The microcapsules have a diameter in the
order of 50µm and are filled with a clear fluid and a number of white and black
particles which are oppositely charged and can be moved in opposite direction
by applying an electric field. The principle of image generation is illustrated by
Fig. 1.1. When a voltage is applied between the bottom and top electrodes,
the oppositely charged black and white particles migrate into the
correspond-ing directions. Compared with transmissive LCDs or emissive technologies like
OLEDs, field emitter displays and plasma displays the power consumption of
electronic ink displays is very low. Furthermore, it has much more favorable
val-ues for reflectance, contrast ratio and viewing angle. Meanwhile, first portable
electronic products like PDAs with e-ink displays are coming into the market and
a wide variety of further pproducts is under development ranging from eBooks
to fashion accessories.
Microfluidic devices. Microfluidic devices can be classified into two main groups. So called micro-arrays mainly aim at high throughput screening of a huge number
iden-tify specific binding of special bio-molecules to other reactants arranged as dots in
a large matrix pattern on a small substrate. More complex are so called
microflu-idic devices where often electrokinetic effects are applied for transport, pumping
and dispensing of small amounts of fluids as well as separation of biomolecules like
DNA fragments, peptides or proteins. Generally, molecules or reagents are moved
in microfluidic devices through a network of microchannels and microchambers
comprising several functions on one single chip like sampling, sample treatment
including filtration, concentration, mixing, reaction, separation, and detection.
The advantages of electrokinetically driven microsystems over, say,
pressure-driven microsystems are based in particular on positive scaling effects.
Microflu-idic devices using electrophoretic separation are superior due to faster speed and
smaller sample consumption. In addition, electro-osmosis allows realizing
accu-rate control of transportation and manipulation of liquid samples by means of
electrostatic forces without requiring movable mechanical parts.
Recent developments include 2D electrophoresis and free-flow electrophoresis.
Figure 1.2 shows a schematic representation of 2D capillary gel electrophoresis
on a substrate whose size might be finally only a few square centimeters.
Besides separation, transport and flow control in microchannels on a chip are
of major importance. In this respect, electro-osmosis is a powerful tool which
allows pumping fluids over a wide range of conductivity, including buffered
solu-tions and organic solvents.
Electrokinetic flow control is carried out on a microscale using pinched valves
and gated valves. By that means, a sample can be injected like a plug into a
microfluidic T-junction or a sample can be diluted by diffusive mixing of the
sample with the buffer solution. Diffusive mixing occurs in tens of seconds and
various designs have been reported to reduce the length of the mixing path and
corresponding timescale.
20
arranged as dots in a large matrix pattern on a small substrate. More complex products are so-called micro-fluidic devices where often electrokinetic effects are applied for transport, pumping and dispensing of small amounts of fluids as well as separation of biomolecules like DNA fragments, peptides or proteins. Generally, molecules or reagents are moved in microfluidic devices through a network of microchannels and microcham-bers comprising several functions on one single chip like sampling, sample treatment including filtration, concen-tration, mixing, reaction, separation, etc. and detection
[27,28].
The advantages of electrokinetically driven microsys-tems over other like pressure driven microsystems are based in particular on positive scaling effects mentioned above. Microfluidic devices using electrophoretic se-paration are superior due to faster speed and smaller sample consumption. In addition, electroosmosis allows realizing accurate control of transportation and manip-ulation of liquid samples by means of electrostatic forces without requiring movable mechanical parts. Also at small dimensions, the profound knowledge from mature electrokinetic research on conventional macro-scale devices remains directly adaptable.
istry. Since miniaturized devices have a larger surface to
volume ratio and, consequently, heat transport to the outside is more effective, microsystems are to consider when regarding the common enhancement of resolution and power dissipation with increasing electrical field intensity. As a result, higher field intensity is generally tolerable for electrophoretic separation in microchan-nels. Smaller characteristic dimensions in combination with higher field intensities evidently lead to an extre-mely short time scale for separation which is a funda-mental advantage compared with macroscopic devices. Recent developments in on-chip separation include 2D electrophoresis[29,30]and free-flow electrophoresis[31].
Fig. 10shows a schematic representation of a 2D-capillary gel electrophoresis on a substrate whose size might be finally only a few square centimeters.
Besides separation, transport and flow control in microchannels on a chip are of major importance. In this respect, electroosmosis is a powerful tool which allows pumping fluids over a wide range of conductivity, including buffered solutions and organic solvents[32]. Electrokinetic flow control is carried out on a microscale using pinched valves and gatedvalves [33]. By that means, a sample can be injected like a plug into a
Fig. 10. A scheme for 2D gel electrophoresis on a microchip. The first dimension of separation operates by isoelectric focussing (DpH). From this level, the separated groups of molecules will be conducted to the second dimension of separation. The separation of molecules occurs here by electrophoresis.
Figure 1.2: A schematic for 2D gel electrophoresis on a microchip. The first dimension of separation operates by isoelectric focussing. From this level, the separated goups of molecules are conducted to the second dimension of separation. The separation of molecules occurs by electrophoresis.
means of semi-permeable membranes which allow withdrawing selected species.
Microfluidic devices using electrokinetic effects have made great progress in
bio-chemical analysis and are becoming an indispensable tool for research and
de-velopment in the life sciences.
Surface tension and phase change (Probstein, 2003)
Boundary conditions As explained, surface tension becomes very important in
micro-scale conduits if there is any contact line of different materials. Lee et al. (2004) and
Li et al. (2004) investigated experimentally bubble dynamics in microchannels. They
reported that the bubble behaves differently from those in macro-scale channels in
terms of the growing rate and bubble frequency. They also reported that the surface
tension and drag force were the governing forces of the phenomena, where the gravity
force plays an important role in macro-scale conduits.
stresses at the interface and hence a surface attractive force that acts on the adjoining
fluid, giving rise to fluid motion in the underlying bulk liquid. The motion induced
by tangential gradients of surface tension is usually termed theMarangoni effect.
Spatial gradients in surface tension may arise from a variety of causes, surface
con-centrations of an impurity or additive, or in electric charge or surface potential. The
resulting flows are termed, respectively, thermocapillary flows, diffusocapillary flows,
and electrocapillary flows. Clearly, then, we must know the concentration,
tempera-ture, and charge distributions at the interface in order to define the surface tension
variation required to solve the hydrodynamic problem. However, these distributions
are themselves coupled to the equations of conservation of mass, energy, and charge
through the appropriate interfacial boundary conditions. The boundary conditions
are obtained from the requirement that the forces at the interface must balance. This
implies that the tangential shear stress must be continuous across the interface, and
the net normal force component must balance the interfacial pressure difference due
to surface tension.
If the surface tension varies along the interface, a tangential force per unit area will
exist on the interface, given by
fs=∇sσ (1.11)
where ∇s denotes the surface gradient and fs is the force component in the surface.
The positive sign on∇sσ indicates that the liquid tends to move in a direction from
lower to higher surface tension.
Let us denote the force per unit area exerted on the interface from the viscous stresses
and pressures associated with the boundary fluids as fα and fβ. The superscriptsα and β refer to the two different fluids on each side of the interface. With n the unit normal vector into the fluidβ, the forces may be written
fβ =−n·τijβ−npβ (1.12b)
We now can make a tangential and normal force balance. In the tangential direction
on the interface the forces fα and fβ are purely viscous, and from Eq. (1.12a) and (1.12b) we have
fsα+fsβ+∇sσ= 0 (1.13)
Thus the shear stress depends on the local surface tension gradient, in the absence of
which Eq. (1.8) simply reduces to the usual fluid dynamic boundary condition that
the tangential viscous stress is continuous at the interface of two different fluids. The
normal force balance simply gives the scalar equation
fnα+fnβ =σ
1 R1
+ 1
R2
(1.14)
which is called the Young-Laplace equation. The normal forces fn include both the
thermodynamic pressures as well as the normal viscous stresses.
Applications
Pumping. Kim (1999) reported that surface-tension-induced motion is possible by creating surface tension difference in fluid-fluid or fluid-solid interface. There are
several ways to control the surface tension, such as chemical (i.e., use of
surfac-tant), thermal (e.g. Marangoni force), and electrocapillary. Among them use of
electrocapillar appears most promising due to the energy efficiency (vs. thermal)
and potentially simple and long-lasting operation (vs. chemical), as well as the
simplicity in realizing by microfabrication.
While the electro-capillary, in general, refers to a relationship between surface
tension change of liquid metal due to applied voltage, continuous electro


![Fig. 1. Principle of bubble valve for micro injector [7,8] Fig. 2. Valveless micropump using bubbles [9] i c r o- i n j e c t or ( K i m, 1999)](https://thumb-us.123doks.com/thumbv2/123dok_us/1295174.1162073/44.612.201.450.226.510/principle-bubble-valve-injector-valveless-micropump-using-bubbles.webp)