BEHAVIOR OF PRESTRESSED CONTAINMENT WALL STRUCTURES
WITH LINER CONSIDERING LONG TERM LOSSES
Christian Lang1, Burkhard Wienand2
1
Dr.-Ing., Consulting Engineer, Im Erb 15, 67487 Maikammer, Germany ([email protected])
2
Dr.-Ing., AREVA NP, Kaiserleistraße 29, 63067 Offenbach, Germany ([email protected])
ABSTRACT
Currently, nuclear power plants of third+ generation are being erected world wide. One special representative of these third+ generation NPPs is AREVA’s EPRTM. Heart of this power plant is the reactor building with its prestressed inner containment. This containment consists of a cylindrical shell lower part and an upper dome part. Sturctural integrity and leaktightness in case of accidents shall be maintained by two means: prestressing of concrete in order to prevent cracking of concrete and steel liner attached to the inner containment surface by stud connectors.
One special feature of this containment layout concept is that full compression at the end of lifetime is maintained. Mean concrete section stress shall be compressive in membrane zones at the end of lifetime in normal operating conditions including pressure test. However, this design criterion implies that a very high level of prestressing must be provided at the beginning of lifetime to compensate losses due to creep & shrinkage of concrete. Further, the presence of the steel parts with their stiffness contribution result in a rearrangement of internal prestressing forces from the concrete to steel parts including liner with all its drawbacks (buckling of thin liner plate due to compressive forces).
Thus, in this paper a study will be conducted where the level of prestressing is reduced while the missing prestressing reinforcement will be substituted by regular rebars with equivalent section. It can be shown that the ultimate pressure resistance level is maintained while the section stress distribution is positively influenced. This method is known as limited (tensile stresses up to tensile strength of concrete allowed) or partial prestressing (tensile stresses exceed tensile strength of concrete) which is commonly known in bridge design and might be worth spending thoughts onto in containment design since leak tightness can be fully assigned to the liner. The behavior of full and partial prestressed containments is shown and discussed in this paper.
CONTAINMENT LAYOUT
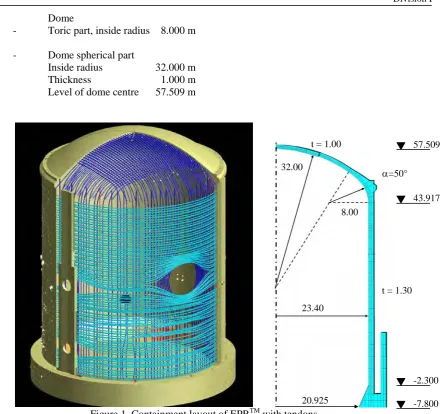
The layout of the EPRTM containment is shown in Figure 1. At its inner surface, the containment is equipped with a thin metallic liner which is attached to the concrete wall by shear studs in order to ensure leak tightness. The structure consists of 3 parts which are indicated in the following:
Cylinder part
- Inside radius 23.400 m - Thickness 1.300 m - Upper level 43.917 m - Lower level -2.300 m
Dome
- Toric part, inside radius 8.000 m
- Dome spherical part Inside radius 32.000 m Thickness 1.000 m Level of dome centre 57.509 m
Figure 1. Containment layout of EPRTM with tendons.
TENDON LAYOUT
The current design of standard EPRTM provides a prestressing system which consists of the following tendon arrangement:
Horizontal prestressing (cylinder) 119 hoop tendons (360° arrangement)
each tendon anchored at both sides of a buttress
Pure vertical tendons (cylinder) 47 pure vertical tendons anchored in tendon gallery below base slab and at dome girder
Gamma tendons (cylinder and dome) 104 gamma tendons anchored in tendon gallery below base slab and at opposite side of dome girder
23.40
8.00 32.00
57.509
43.917
-2.300 -7.800 20.925
α=50° t = 1.00
This tendon arrangement leads to a mean vertical distance of 65 cm of hoop tendons. Horizontal tendons are arranged in two layers, the outer layer is fully occupied (tendon spacing 65 cm) while at the inner horizontal tendon layer only every second tendon is occupied (tendon spacing 130 cm). Mean distance of vertical tendons and gamma tendons in cylinder part is given by 2x24.05 / 151 = 1.00 m. Further, in standard dome sections the tendon arrangement leads to an orthogonal mesh with distance 0.725 m. Tendons with 54 strands each of cross section 150 mm² (thus, in total 54x1.5 = 81 cm²) and characteristic strength fp0,1k / fpk = 1653 MN/m² / 1860 MN/m² are used.
Figure 2. Prestressing duct and reinforcement arrangement in cylinder and dome part of EPRTM.
INITIAL PRESTRESS
Initial prestressing is done with 0.8 fpk = 1488 MN/m². Computing all losses due to anchorage slip
and friction of tendon in ducts, this leads to the following mean stresses and forces in tendons. The full prestressing values apply for standard EPRTM design.
Full prestressing (100 %)
Hoop direction σp = 985 MN/m² Fp = 98.5x81x1.5/0.65 = 18412 kN/m
Vertical direction σp = 1350 MN/m² Fp = 135x81x151/1.00 = 10935 kN/m
Dome center σp = 1235 MN/m² Fp = 123.5x81x/0.725 = 13798 kN/m
Partial prestressing (66.7%) by reduction of installed tendon section and substitution by rebars Hoop direction σp = 985 MN/m² Fp = 18412x2/3= 12275 kN/m
Vertical direction σp = 1350 MN/m² Fp = 10935x2/3 = 7290 kN/m
Partial prestressing (33.3%) by reduction of installed tendon section and substitution by rebars Hoop direction σp = 985 MN/m² Fp = 18412/3= 6137 kN/m
Vertical direction σp = 1350 MN/m² Fp = 10935/3 = 3645 kN/m
Dome center σp = 1235 MN/m² Fp = 13798/3 = 4599 kN/m
LONG TERM BEHAVIOR OF CONCRETE – CREEP & SHRINKAGE
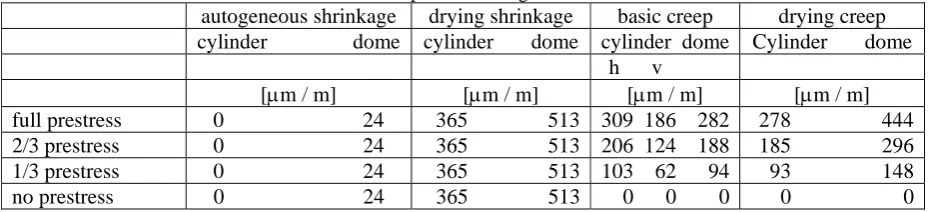
Creep and shrinkage characterize long term behavior of concrete. Shrinkage is independent of loading while creep depends on the level of concrete stress which means the higher the prestress the higher the creep effect. Taking into account creep and shrinkage laws of EN1992-2 with some slight modifications concerning biaxial state of compression which applies for the containment, the following values are obtained.
In Table 1, the corresponding values for the prestressed containment with different levels of prestressing are given. It is obvious while shrinkage remains constant, the creep effect decreases with decreasing prestressing level.
Table 1: Creep and Shrinkage of concrete
autogeneous shrinkage drying shrinkage basic creep drying creep cylinder dome cylinder dome cylinder dome Cylinder dome
h v d
[μm / m] [μm / m] [μm / m] [μm / m]
full prestress 0 24 365 513 309 186 282 278 444
2/3 prestress 0 24 365 513 206 124 188 185 296
1/3 prestress 0 24 365 513 103 62 94 93 148
no prestress 0 24 365 513 0 0 0 0 0
Table 2: Section properties of cylinder and dome
Full Prestress Cylinder horizontal Cylinder vertical dome
Concrete section 1.30 m 1.30 m 1.00 m
Liner section* (7 mm) 70 cm²/m (7 mm) 70 cm²/m (9 mm) 90 cm²/m
Inner rebars 22.6 cm²/m 23.8 cm²/m 19.9 cm²/m
Outer rebars 57.6 cm²/m 58.1 cm²/m 50.7 cm²/m
Middle rebars - - -
Tendon layer 1 62.3 cm²/m 81.0 cm²/m 111.7 cm²/m
Tendon layer 2 124.6 cm²/m -
2/3 Prestress Cylinder horizontal Cylinder vertical dome
Concrete section 1.30 m 1.30 m 1.00 m
Liner section* (7 mm) 70 cm²/m (7 mm) 70 cm²/m (9 mm) 90 cm²/m
Inner rebars 22.6 cm²/m 23.8 cm²/m 19.9 cm²/m
Outer rebars 57.6 cm²/m 58.1 cm²/m 50.7 cm²/m
Middle rebars 210.7 cm²/m 91.3 cm²/m 125.9 cm²/m
Tendon layer 1 41.5 cm²/m 54.0 cm²/m 74.5 cm²/m
Tendon layer 2 83.1 cm²/m -
1/3 Prestress Cylinder horizontal Cylinder vertical dome
Concrete section 1.30 m 1.30 m 1.00 m
Liner section* (7 mm) 70 cm²/m (7 mm) 70 cm²/m (9 mm) 90 cm²/m
Inner rebars 22.6 cm²/m 23.8 cm²/m 19.9 cm²/m
Outer rebars 57.6 cm²/m 58.1 cm²/m 50.7 cm²/m
Middle rebars 421.4 cm²/m 182.6 cm²/m 251.8 cm²/m
Tendon layer 1 20.8 cm²/m 27.0 cm²/m 37.2 cm²/m
Tendon layer 2 41.5 cm²/m -
No Prestress Cylinder horizontal Cylinder vertical Dome
Concrete section 1.30 m 1.30 m 1.00 m
Liner section* (7 mm) 70 cm²/m (7 mm) 70 cm²/m (9 mm) 90 cm²/m
Inner rebars 22.6 cm²/m 23.8 cm²/m 19.9 cm²/m
Outer rebars 57.6 cm²/m 58.1 cm²/m 50.7 cm²/m
Middle rebars 632.2 cm²/m 273.9 cm²/m 377.8 cm²/m
Tendon layer 1 - - -
Tendon layer 2 - -
(* Liner section including equivalent contributing stiffener section)
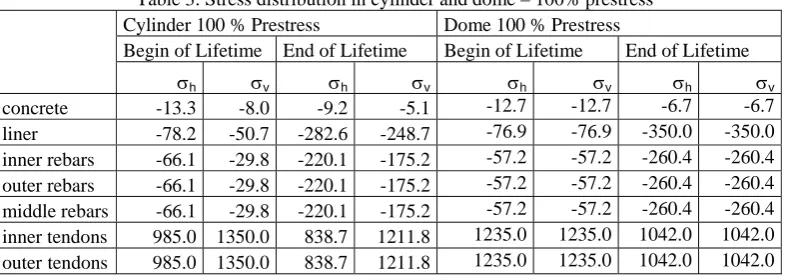
Table 3: Stress distribution in cylinder and dome – 100% prestress Cylinder 100 % Prestress Dome 100 % Prestress
Begin of Lifetime End of Lifetime Begin of Lifetime End of Lifetime
σh σv σh σv σh σv σh σv
concrete -13.3 -8.0 -9.2 -5.1 -12.7 -12.7 -6.7 -6.7
Table 4: Stress distribution in cylinder and dome – 66.7 % prestress Cylinder 66.7 % Prestress Dome 66.7 % Prestress
Begin of Lifetime End of Lifetime Begin of Lifetime End of Lifetime
σh σv σh σv σh σv σh σv
concrete -8.3 -5.2 -3.9 -2.4 -8.0 -8.0 -2.0 -2.0
liner -48.6 -32.8 -200.5 -186.5 -48.7 -48.7 -257.1 -257.1 inner rebars -40.7 -19.8 -153.2 -134.8 -36.2 -36.2 -191.3 -191.3 outer rebars -40.7 -19.8 -153.2 -134.8 -36.2 -36.2 -191.3 -191.3 middle rebars -40.7 -19.8 -153.2 -134.8 -36.2 -36.2 -191.3 -191.3 inner tendons 985.0 1350.0 878.2 1240.8 1235.0 1235.0 1087.7 1087.7 outertendons 985.0 1350.0 878.2 1240.8 1235.0 1235.0 1042.0 1042.0
Table 5: Stress distribution in cylinder and dome – 33.3 % prestress Cylinder 33.3 % Prestress Dome 33.3 % Prestress
Begin of Lifetime End of Lifetime Begin of Lifetime End of Lifetime
σh σv σh σv σh σv σh σv
concrete -3.9 -2.5 0.0 0.0 -3.8 -3.8 1.5 1.5
liner -22.8 -15.9 -129.4 -129.1 -23.2 -23.2 -173.7 -173.7 inner rebars -18.9 -9.8 -96.3 -96.0 -17.3 -17.3 -129.3 -129.3 outer rebars -18.9 -9.8 -96.3 -96.0 -17.3 -17.3 -129.3 -129.3 middle rebars -18.9 -9.8 -96.3 -96.0 -17.3 -17.3 -129.3 -129.3 inner tendons 985.0 1350.0 911.5 1268.2 1235.0 1235.0 1128.6 1128.6 outertendons 985.0 1350.0 911.5 1268.2 1235.0 1235.0 1128.6 1128.6
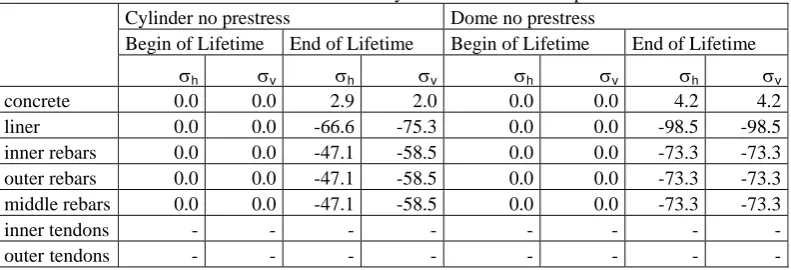
Table 6: Stress distribution in cylinder and dome – no prestress Cylinder no prestress Dome no prestress
Begin of Lifetime End of Lifetime Begin of Lifetime End of Lifetime
σh σv σh σv σh σv σh σv
concrete 0.0 0.0 2.9 2.0 0.0 0.0 4.2 4.2
liner 0.0 0.0 -66.6 -75.3 0.0 0.0 -98.5 -98.5
inner rebars 0.0 0.0 -47.1 -58.5 0.0 0.0 -73.3 -73.3 outer rebars 0.0 0.0 -47.1 -58.5 0.0 0.0 -73.3 -73.3 middle rebars 0.0 0.0 -47.1 -58.5 0.0 0.0 -73.3 -73.3
inner tendons - - - - - -
outertendons - - - -
In the dome center, an axxissymmetric state of stress and strain is given with σh = σv due to symmetry axis conditions. It has to be noted that a biaxial material law for both concrete and liner must be used; otherwise results will not reflect reality in a proper way.
σh = E / (1-ν²) ⋅ (εh + ν⋅εv) (2a)
σv = E / (1-ν²) ⋅ (ν⋅εh + εv) (2b)
Considering a test pressure of 500 kN/m², the following mean concrete stresses due to p = 500 kN/m² are obtained, differences are due to different ideal concrete section.
Table 7: Concrete stresses due to test pressure p = 500 kN/m² with Ai section
100% prestressing σh = 7.6 MN/m² σv = 4.0 MN/m² dome σ = 6.6 MN/m² 66.7% prestressing σh = 7.0 MN/m² σv = 3.8 MN/m² dome σ = 6.2 MN/m² 33.3% prestressing σh = 6.5 MN/m² σv = 3.7 MN/m² dome σ = 5.8 MN/m² No prestressing σh = 6.0 MN/m² σv = 3.6 MN/m² dome σ = 5.5 MN/m²
From the results, it can be seen that in the case of 100% prestressing the concrete stresses are fully in compression even at the end of lifetime. However, a very high level of prestressing at begin of lifetime is required to compensate the losses due to creep & shrinkage. Further, the liner is under biaxial compression while its yield limit is already reached (fyk = 275 MN/m² for P275NL2) with all
corresponding problems (problem of local liner buckling), see Table 3.
Thus, it should be worth while spending thoughts on reducing the level of prestressing and not to fulfill the design criterion full compression at end of lifetime under test pressure, since leak tightness is ensured by the metallic liner anyway. E.g. by reducing the level of prestressing to 66.7%, full prestress at begin of lifetime is still valid while at the end of lifetime mean tensile stresses occur which are actually smaller than the mean tensile strength fctm = 4.1 MN/m² for concrete C50/60. This concept is well known
especially in bridge design as limited prestressing according to design code DIN 4227 which is now substituted by EN 1992. In this case, the liner does not yield at end of lifetime and the prestressing losses due to creep are smaller than for 100% prestressing.
The same trend can be observed by further reducing the level of prestressing down to 33.3%. Here, the stresses due to test pressure at end of lifetime exceed the tensile strength of concrete. This is known as partial prestressing. Concrete will crack under test pressure situation. However, cracks will be compressed elastically when test pressure is removed.
ULTIMATE PRESSURE RESISTANCE
The ultimate pressure resistance of the containment in current zones (assumption of membrane behavior, no locks or hatches) is neither influenced by the level of prestressing nor creep & shrinkage. It is only depending on the amount of steel in the cross section which can withstand the pressure situation.
Full presstress
Cylinder horizontal p ⋅ R = fl⋅ Al + As⋅ fu + Ap⋅ fp
p = (320⋅0.007 + 80.2e-4⋅550 + 186.9e-4⋅1860)/24.05 = 1.72 MN/m² Cylinder vertical p ⋅ R/2 = fl⋅ Al + As⋅ fu + Ap⋅ fp
p = (320⋅0.007 + 81.9e-4⋅550 + 81.0e-4⋅1860)/24.05⋅2 = 1.81 MN/m² Dome center p ⋅ R/2 = fl⋅ Al + As⋅ fu + Ap⋅ fp
p = (320⋅0.009 + 70.6e-4⋅550 + 111.7e-4⋅1860)/32.5⋅2 = 1.69 MN/m²
66.7% prestress
Cylinder horizontal p = (320⋅0.007 + 290.3e-4⋅550 + 124.6e-4⋅1860)/24.05 = 1.72 MN/m² Cylinder vertical p = (320⋅0.007 + 173.2e-4⋅550 + 54.0e-4⋅1860)/24.05⋅2 = 1.81 MN/m² Dome center p = (320⋅0.009 + 196.5e-4⋅550 + 74.5e-4⋅1860)/32.5⋅2 = 1.69 MN/m²
33.3% prestress
No prestress
Cylinder horizontal p = (320⋅0.007 + 712.4e-4⋅550)/24.05 = 1.72 MN/m² Cylinder vertical p = (320⋅0.007 + 355.8e-4⋅550)/24.05⋅2 = 1.81 MN/m² Dome center p = (320⋅0.009 + 448.4e-4⋅550)/32.5⋅2 = 1.69 MN/m²
By substituting the prestressing tendons with equivalent rebar section taking into account the ultimate strength ratio fpk / fuk = 1860/550, the same ultimate pressure resistance is obtained. The
advantage in prestressing can be seen in the utilization of higher steel grades (in this case fp0,1k / fpk =
1653 / 1860) and in a positive influence on the serviceability limit state. The ultimate capacity is also not influenced by creep & shrinkage which results only in a decrease of strain difference between prestressing steel and concrete and thus has only effects on the serviceability limit state.
CONCLUSIONS
The EPRTM design provides a prestressing concept which ensures mean compressive concrete stresses in case of test pressure at the end of lifetime. Additional, a metallic liner is attached to the inner surface to provide leaktightness. However beside its advantages (especially the utilization of high steel grades), prestressing has one main drawback: creep & shrinkage reduce the initial tendon forces and prestresses the liner which tends to local buckling under high biaxial compression. So, a very high amount of prestressing tendons and a very high level of prestressing are needed just to ensure this design criterion. Since leaktightness is ensured by the liner, the prestressing level can be reduced without reduction of the ultimate pressure capacity but just by influencing the serviceability limit state. In this case, the SLS state is mainly characterized by the pressure level at which cracking of concrete takes place. Here, limited tensile stresses might be allowed also accounting for high concrete tensile strength (concept of limited or partial prestressing) with the corresponding effect of reduction of prestressing forces. The ultimate pressure capacity itself is only influenced by the installed amount of steel to balance the internal membrane forces.
ACKNOWLEDGEMENTS
This paper is dedicated to all colleagues, especially in Offenbach, in the AREVA EPRTM civil team, who realized the construction of the first EPRTM worldwide at Olkiluoto site, Finland. Among those, this paper is especially dedicated to Mr. Dipl.-Ing. Michael Freiman, who has been strongly involved in this project and has retired some years ago.
REFERENCES
Eurocode 2 Part 2 (2005). Design of Concrete Structures – Part 2: Concrete Bridges, Beuth (Berlin).
Rüsch, H. and Jungwirth D. (1976). Stahlbeton – Spannbeton, Berücksichtigung der Einflüsse von Kriechen und Schwinden auf das Verhalten von Tragwerken, Werner Verlag (Düsseldorf)
Chauvel, D. and Barre, F. (2005). Concrete delayed deformations of nuclear structures – comparison between monitoring analysis and theoretical values. CONCREEP-7, Proc Symp. Nantes, France, 12-14 September 2005: 317-322.