1265
Towards Adaptive Text Summarization:
How Does Compression Rate Affect Summary Readability of L2 Texts?
Tatiana Vodolazova, Elena Lloret
Dept. of Software and Computing Systems University of Alicante
Apdo. de Correos 99 E-03080, Alicante, Spain
{tvodolazova,elloret}@dlsi.ua.es
Abstract
This paper addresses the problem of read-ability of automatically generated sum-maries in the context of second language learning. For this we experimented with a new corpus of level-annotated simplified English texts. The texts were summarized using a total of 7 extractive and abstractive summarization systems with compression rates of 20%, 40%, 60% and 80%. We an-alyzed the generated summaries in terms of lexical, syntactic and length-based fea-tures of readability, and concluded that summary complexity depends on the com-pression rate, summarization technique and the nature of the summarized corpus. Our experiments demonstrate the impor-tance of choosing appropriate summariza-tion techniques that align with users needs and language proficiency.
1 Introduction
It is often the case that people, at some point in their lives, are incapable of benefiting from avail-able information due to various aspects of text complexity resulting from domain-specific termi-nology and grammatical structure complexity. The literature has identified specific instances of this, such as: diabetes patients with no medical training who try to make sense of recent scientific advances in the treatment of the disease (Ong et al.,2008); elderly people forced to embrace the technical ter-minology of the digital age when using comput-ers and mobile phones (Li and Perkins, 2007); parents trying to decipher the latest slang words used by their teenage children (Vizgirdaite,2009); people with different degrees of learning difficul-ties such as aphasia (Carroll et al.,1998), dyslexia (Rello et al.,2012) or autism (ˇStajner et al.,2012); and, second languag (L2) learners trying to infer
the meaning of idioms from the literal meaning of their constituents (Charteris-Black,2002).
Extensive research has been carried out in the field of automatic text simplification and text en-richment (Rello et al.,2014;Aranzabe et al.,2012;
Woodsend and Lapata,2011;Thomas and Ander-son, 2012; Barbu et al., 2015). But only a few studies integrate them into other applications of natural language processing (NLP), such as, for example, in text summarization for the purpose of improving readability. Text summarization is not considered to be primarily a simplification task. However, it becomes useful when long documents are involved as it aims to reduce text processing time and thus to access quicker the main concepts of the document. In this context most of the stud-ies apply text simplification to reduce redundant or less important information and to increase the informativeness of extractive summaries, but not their readability (Jing,2000). Lloret et al.(2019) point out that summaries are rarely evaluated for readability. But text summarization can clearly benefit from readability assessment to better serve its purpose of saving reading time and to avoid the generation of incomprehensible summaries. We take this idea further and suggest that to maintain an optimal level of summary complexity and to adapt it in a personalized way according to user needs and language proficiency, the summariza-tion aproach needs to identify and integrate the necessary degree of simplification.
ination (Heilman et al., 2007). Once identified these features can be used to measure variation in readability of automatically generated summaries. For this purpose we harvested a corpus of texts for L2 learners of English that are classified into 7 levels according to language proficiency . This dataset provides an appropriate setup to explore the distribution of different readability characteris-tics across the levels and to study how these char-acteristics change when summarization is applied.
The main contributions of this paper are:
• we experiment with a new dataset of graded L2 learner texts that can be used both for text simplification and text summarization tasks;
• we test a number of summarization ap-proaches on this corpus and demonstrate that compression rate always affects the complex-ity of generated summaries;
• we show that the domain of the corpus affects the results;
• we prove that the complexity of generated summaries varies depending on the summa-rization technique and the readability metric.
2 Related work
The present study spans two fields of NLP: text summarization and readability assessment as a part of the text simplification process.
Only a few studies address the problem of how text summarization affects summary readability.
Petersen and Ostendorf(2007) are among the first to point out that text summarization techniques alone do not control the degree of readability of generated summaries because sentences with challenging vocabulary and complex grammatical structures may be chosen. Lloret et al.(2019) fur-ther explore this idea, showing that text summa-rization does not maintain the same degree of text complexity as the original document. However, based on their experiments with a corpus of unsim-plified newswire documents for native speakers DUC 20021and contrary to the observation of Pe-tersen and Ostendorf(2007), they conclude that on some readability metrics the summaries generated with the compression rate of 20% score better and are easier to comprehend than the original texts. For their experiments Lloret et al. (2019) used a
1http://duc.nist.gov/
tures and a modular extractive text summarization approach that allowed the testing of how anaphora resolution, word sense disambiguation and textual entailment affect the readability of summaries.
Only a handful of text summarization meth-ods so far have integrated readability assessment to select not only the most informative, but also the most comprehensible sentences.Nandhini and Balasundaram (2014) designed one of such ap-proaches. They represent each document as a set of 4 informative features (sentence position, title similarity, etc.) and 5 readability features (word length, sentence length, etc.) and treat summariza-tion as an optimizasummariza-tion problem to maximize the average informative score of the summary and to improve its readability. However, their set of read-ability features is small and they do not study the relative importance of each feature with respect to the corpus or the target language proficiency level. In recent years, several studies appeared that address readability assessment and text simplifi-cation for L2 learners. Vajjala and Luˇci´c (2018) compiled the OneStopEnglish corpus of simplified level-annotated news articles for L2 learners with comparable texts across all levels.Xia et al.(2016) trained a machine learning algorithm for readabil-ity assessment on past Cambridge English Exam papers. Their set of readability features includes data from English Vocabulary Profile, an online vocabulary resource with integrated grading scale based on the Common European Framework of Reference for Languages (CEFR) (Council of Eu-rope,2001).
Our study has been inspired by the aforemen-tioned research and further expands on the idea of Lloret et al. (2019) by experimenting with a graded simplified corpus of texts for L2 learners of English, adding vocabulary-based and syntactic families of readability features, including an ab-stractive summarization system and testing these metrics with 4 different compression rates.
3 Data
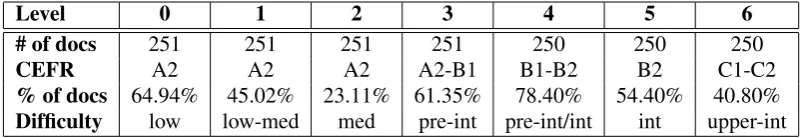
Level 0 1 2 3 4 5 6
# of docs 251 251 251 251 250 250 250
CEFR A2 A2 A2 A2-B1 B1-B2 B2 C1-C2
% of docs 64.94% 45.02% 23.11% 61.35% 78.40% 54.40% 40.80% Difficulty low low-med med pre-int pre-int/int int upper-int
Table 1: Statistics for the BNE corpus
corpus of simplified texts that are adapted to dif-ferent reading proficiency levels and also include the original source documents. To the best of our knowledge there is no such freely available level-annotated corpus of learner’s materials that can also be used for text summarization.
Motivated by this fact we harvested a cor-pus of texts for English learners from Breaking News English website2. Breaking News English (BNE) is a website with different resources for English language teachers created and maintained since November 2004 by an experienced ESL/EFL teacher Sean Banville3. This website was nomi-nated for a British Council ELTons award in the category “Innovation in Learner Resources” in 2014. We obtained permission from the author to use it for research purposes. The site contains materials classified into seven levels from 0 to 6 that roughly correspond to CEFR grading scale, comprising levels from A2 to C2 (see Table3). A new lesson, containing quizzes, reading and listen-ing activities, appears every two days. The main component of each lesson is a piece of news from 120 to 250 words long, depending on the level. Texts cover a broad range of topics, but try to avoid more emotive and sensitive ones (Banville,2005). As the vocabulary difficulty depends on the topic, each news article topic is assigned to one of two groups, representing linguistic levels 0 to 3 or 4 to 6, respectively. The grading process is the fol-lowing: first, the author manually creates a text for level 3 or 6 and then makes the easier levels by re-ducing sentence length, simplifying grammar, in-troducing easier vocabulary and avoiding idioms. We will revisit this grading policy in Section4.2, as it affects readability statistics of the corpus.
The distinguishing features of this resource are:
• each text is available at different levels of complexity.
• each text can be considered as a summary of a set of news articles that can be extracted from the provided URLs.
2
https://breakingnewsenglish.com/
3https://www.linkedin.com/in/seanbanville/
As mentioned in Section 2 the OneStopEnglish corpus (Vajjala and Luˇci´c, 2018) is a similar re-source for readability assessment that contains the same texts rewritten for elementary, intermediate or advanced reading proficiency levels. However, given the 7 levels from the BNE dataset we expect to be able to identify the more subtle readability differences between them. Going forward, with access to the original news articles via URLs, we will be able to develop and test an adaptive multi-document summarization approach on this corpus. The BNE website has been evolving since its creation in 2004, thereby level annotation is avail-able only starting from July 2013. We harvested all the suitable data, but for this initial research we used a subset from March 2016 to January 2019, resulting in 1,754 news articles in total and 250/251 articles for each of the 7 levels. Ta-ble1shows further statistics of the corpus where CEFRandDifficultyrows reflect grading informa-tion provided on the resource’s website.
To contrast BNE’s website CEFR level annota-tion with the CEFR annotaannota-tion of other state-of-the-art resources, we evaluated our corpus with the readability assessment method developed by Xia et al. (2016) and trained on past Cambridge En-glish Exam papers and on the set of 100 addition-ally annotated news articles. The row% of docs illustrates how many texts were identified by this method as belonging to the indicated CEFR level.
4 Readability
4.1 Features
Following previous research on assessing read-ability of summaries byLloret et al.(2019), we se-lected the same set of 9 readability features. How-ever, after detailed analysis of the set and the re-vision of other research in readability assessment of L2 texts, we added further lexical and syntactic features (Xia et al., 2016;Heilman et al., 2007). The rationale for this was twofold. First, exper-iments show that these families of features sig-nificantly improve performance of classifiers and therefore help to correctly identify the grade of text complexity (Pitler and Nenkova,2008). Sec-ond, the initial set of readability metrics would not be capable of grasping grammatical and vocabu-lary changes that are an integral part of second lan-guage acquisition. To cover these aspects of text complexity we added 12 more features4including the revised Dale-Chall formula (Chall and Dale,
1995). This formula calculates the proportion of words that do not belong to the list of 3,000 fa-miliar words. Some studies view this formula as a simplified version of a language model ( Collins-Thompson and Callan,2004). The complete set of 21 features, by families, is described below.
Traditional Features This family includes superficial length-based features and traditional readability formulas that are easy to compute, but provide a competitive baseline.
- Flesch Reading Ease (FRE) (Flesch,1948) - Avg. Word Length (AWL)
- Mean Length of a Sentence (MLS) - Avg. Number of Sentences (ANS) - Avg. Text Length in Tokens (ANT)
Lexical FeaturesOur final feature set does not include discourse features, although 4 already in-tegrated features from the original feature set of
Lloret et al.(2019) based on noun and proper noun ratios may be related to the entity-density features, which could cast some light on the discourse prop-erties of the corpus (Feng et al.,2009).
- Word variation index (OVIX) is a variety of type-token ratio measure (Hultman and Westman,
1977)
- Revised Dale-Chall formula (DC) - Proper Noun Ratio (PNR)
- Avg. Number of Unique Proper Nouns (uPNR)
- Noun Ratio (NR) - Pronoun Ratio (PR)
4We indicate them with an * in Table2
Heilman et al. (2007) em-phasize that grammatical features may play a more important role in readability assessment for the L2 learners than for the native speakers. Following their example, we calculate the last 4 features in this family on a per word basis.
- Parse Tree Depth (PTD) - Noun Phrase Ratio (NPR) - Verb Phrase Ratio (VPR) - Adjective Phrase Ratio (ADJPR) - Adverbial Phrase Ratio (ADVPR)
- Avg. number of SBARs per sentence (SBAR) - Ratio of Passive Voice constructions (PV) - Avg. number of Relative Clauses (RC) - Past Participles (VBN)
- Modal verbs (MD)
4.2 BNE Readability Statistics
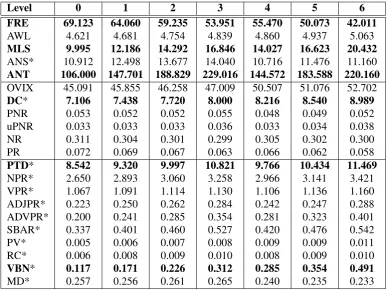
In Section3we explained how Sean Banville man-ually creates the news articles for each complex-ity level. His grading scheme does not corre-spond one-to-one to other established classifica-tions, such as for example CEFR level annotation. To analyze how readability varies across the 7 lev-els, we extracted statistics from the BNE corpus for each of the 21 features. Table2contains aver-age values by level for each of the selected read-ability measures and Table 3 Pearson correlation coefficient.
Length-based readability features reveal irregu-larities in the size of articles between levels 3 and 4 when the more complex topic replaces the eas-ier one. One can observe that the average number of tokens and sentences per article, as well as the mean sentence length (ANS, ANT, MLS) gradu-ally increase from level 0 to level 3, but then in level 4 decrease almost to the values of level 1, again increasing and surpassing previous values up until level 6. It affects FRE formula and in-troduces the same irregularity in its values. These size differences are intended by the author. In-deed, he states on his website that levels 4 and 5 texts are shorter than levels 2 and 3 respectively. Average word length is the only length-based fea-ture that grows linearly and slightly smooths out the values of FRE.
Level 0 1 2 3 4 5 6 FRE 69.123 64.060 59.235 53.951 55.470 50.073 42.011
AWL 4.621 4.681 4.754 4.839 4.860 4.937 5.063
MLS 9.995 12.186 14.292 16.846 14.027 16.623 20.432 ANS* 10.912 12.498 13.677 14.040 10.716 11.476 11.160 ANT 106.000 147.701 188.829 229.016 144.572 183.588 220.160 OVIX 45.091 45.855 46.258 47.009 50.507 51.076 52.702 DC* 7.106 7.438 7.720 8.000 8.216 8.540 8.989
PNR 0.053 0.052 0.052 0.055 0.048 0.049 0.052
uPNR 0.033 0.033 0.033 0.036 0.033 0.034 0.038
NR 0.311 0.304 0.301 0.299 0.305 0.302 0.300
PR 0.072 0.069 0.067 0.063 0.066 0.062 0.058
PTD* 8.542 9.320 9.997 10.821 9.766 10.434 11.469
NPR* 2.650 2.893 3.060 3.258 2.966 3.141 3.421
VPR* 1.067 1.091 1.114 1.130 1.106 1.136 1.160
ADJPR* 0.223 0.250 0.262 0.284 0.242 0.247 0.288 ADVPR* 0.200 0.241 0.285 0.354 0.281 0.323 0.401 SBAR* 0.337 0.401 0.460 0.527 0.420 0.476 0.542
PV* 0.005 0.006 0.007 0.008 0.009 0.009 0.011
RC* 0.006 0.008 0.009 0.010 0.008 0.009 0.010
VBN* 0.117 0.171 0.226 0.312 0.285 0.354 0.491
MD* 0.257 0.256 0.261 0.265 0.240 0.235 0.233
Table 2: Readability statistics for the BNE corpus
used to correctly identify the level of a BNE docu-ment. Among lexical features, we want to point out the OVIX and the DC metrics that together with the AWL suggest that the best approach to au-tomatically assess complexity of this corpus may involve a statistical language model.
Based on the values of Pearson correlation coef-ficient we reduced our readability set to 3 features including FRE, DC and PTD - one feature per fam-ily - as the most reliable readability indicators for the given corpus (see Table3). Since average sen-tence length is one of the components of FRE, we included FRE and not MSL in this set, even though it has a higher correlation coefficient. We will use this reduced set in the next experiments.
5 Summarization Methods
For this research we considered 7 state-of-the-art methods with different summarization tech-niques that include graph-based and frequency-based methods, methods that implement language models, incorporate such heuristics as word sense disambiguation and anaphora resolution and in-volve abstractive text summarization. Implemen-tations of 2 of them were obtained from the au-thors (ExL19, AbL15), while the remaining 5 were provided by the sumy framework5. Each
5https://github.com/miso-belica/sumy
Feature Pearson correlation r p-value
FRE -0.6197 0
AWL 0.4133 0
MLS 0.6459 0
ANS -0.1167 0
ANT 0.6154 0
OVIX 0.4080 0
DC 0.5429 0
PNR -0.0197 -0.410 uPNR 0.0527 -0.0272 NR -0.0597 -0.0125
PR -0.1393 0
PTD 0.5454 0
NPR 0.4114 0
VPR 0.2279 0
ADJPR 0.0753 -0.0016
ADVPR 0.3218 0
SBAR 0.2555 0
PV 0.2430 0
RC 0.1252 0
VBN 0.5199 0
MD -0.0493 -0.0388
Luhn’s classical technique was one of the first summarization algorithms ranking sentences on word and phrase frequencies (Luhn, 1958). It weighs each sentence according to the number of significant words it contains ignoring high fre-quency common words from a stop word list.
SumBasic (Nenkova and Vanderwende, 2005) is another frequency-based summarizer that incor-porates context information. It assumes that dis-tribution of words in a human summary is similar to that of the original text. The authors reported that it outperformed many of the DUC 2004 sys-tems, so it is frequently used in the literature as a baseline summarizer.
KLSum (Haghighi and Vanderwende, 2009) uses Kullback-Leibler divergence to measure the similarity between a sentence and the language model of the document and selects a set of sen-tences such that the distribution of words in the selected sentences is as similar as possible to the overall distribution of words in the document.
ExL196 Lloret et al.(2019) designed a modu-lar extractive text summarization approach based on frequencies. For this experiment we selected the combination that includes anaphora resolution, word sense disambiguation and textual entailment, scoring sentences on concept frequencies.
LexRank(Erkan and Radev,2004) is a graph-based approach that uses cosine similarity of TF– IDF vectors to calculate pairwise similarity be-tween two sentences. The final score of each sen-tence is the sum of the weights of all the edges connected to it. The sentences are ranked by ap-plying PageRank to the resulting graph.
TextRank (Mihalcea and Tarau, 2004) is an-other graph-based approach that uses PageRank to rank the sentences. In the case of TextRank, the similarity between two sentences is calcu-lated as the number of words they have in com-mon normalized by sentence length. In contrast to LexRank, TextRank recursively changes the weights of the sentences incorporating in this man-ner how all the sentences in the graph relate to each other.
AbL15 (Lloret et al., 2015) is an abstractive text summarization approach that incorporates the stages of text interpretation, transformation and summary generation. Each text passes through the
6We will refer to the systems developed by Lloret et al.
using ExL19 for extractive and AbL15 for the abstractive one.
plex sentences into shorter ones. Subsequently, the system extracts subject-verb-object triplets, iden-tifies named entities and head nouns in nouns phrases, and supplies all this information to the summarizer. The summarizer scores each sen-tence representation based on the extracted infor-mation. In the final step the system translates each sentence into its surface representation and selects the highest rated sentences with respect to the maximum allowed summary size.
6 Results
The final setup of our experiment includes: 7 sum-marization methods (Luhn, SumBasic, ExL19, LexRank, TextRank, KLSum, AbL15); 4 com-pression rates (20%, 40%, 60% & 80%); and, 3 readability metrics (FRE, DC and PTD). To evalu-ate how much readability of generevalu-ated summaries (sread) differs from that of the original documents (oread) we calculated for each documentithe per-cent deviation (PD)
P Di=
(sreadi−oreadi)
oreadi
∗100 (1)
and then averaged it across the entire set. This value can be both negative and positive and indi-cates whether the summary is more or less com-plex than the original text.
Another way to assess the summarizer’s perfor-mance on readability is to calculate the average absolute deviation from the original text’s com-plexity, in other words from 0. With this infor-mation we can determine the degree to which the summaries, independently from being more com-plex or simple, differ from the original documents across all the compression rates. Although the complexity of a system may vary across all the compression rates, their average variation may be very small.
AADs=
P4
n=1|P Dn−0|
4 (2)
whereAADsis the average absolute deviation of a given systemsandP Dnis its percent deviation for the compression raten.
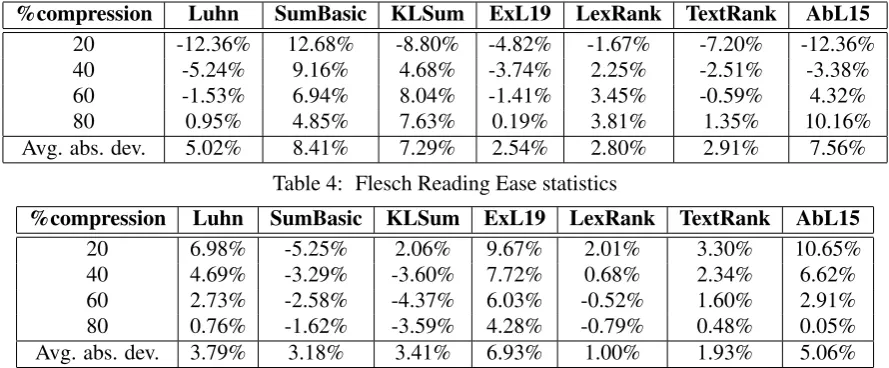
6.1 Length-based readability results
%compression Luhn SumBasic KLSum ExL19 LexRank TextRank AbL15 20 -12.36% 12.68% -8.80% -4.82% -1.67% -7.20% -12.36%
40 -5.24% 9.16% 4.68% -3.74% 2.25% -2.51% -3.38%
60 -1.53% 6.94% 8.04% -1.41% 3.45% -0.59% 4.32%
80 0.95% 4.85% 7.63% 0.19% 3.81% 1.35% 10.16%
Avg. abs. dev. 5.02% 8.41% 7.29% 2.54% 2.80% 2.91% 7.56%
Table 4: Flesch Reading Ease statistics
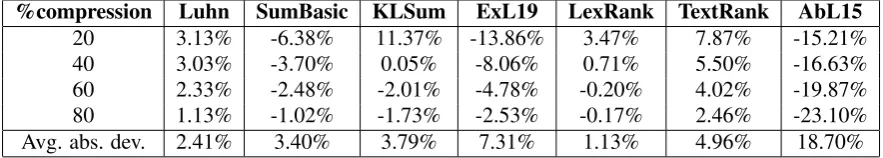
%compression Luhn SumBasic KLSum ExL19 LexRank TextRank AbL15
20 6.98% -5.25% 2.06% 9.67% 2.01% 3.30% 10.65%
40 4.69% -3.29% -3.60% 7.72% 0.68% 2.34% 6.62%
60 2.73% -2.58% -4.37% 6.03% -0.52% 1.60% 2.91%
80 0.76% -1.62% -3.59% 4.28% -0.79% 0.48% 0.05%
Avg. abs. dev. 3.79% 3.18% 3.41% 6.93% 1.00% 1.93% 5.06%
Table 5: Dale-Chall statistics
sentence and syllables per words; the higher the score, the easier is the text. Thus when the percent deviation is negative, the summary is less compre-hensible than the original text. This occurs across almost all of the settings where the summary com-prises only 20% of the original text. The only ex-ception is SumBasic that, with higher compression rates7, tends to select shorter words and shorter sentences. For this readability feature SumBasic simplifies summaries across all the compression rates. However, other frequency-based summa-rization systems show a different tendency: Luhn and ExL19 tend to generate more complex sum-maries with longer words and sentences for almost all the compression rates. Graph-based approach TextRank shows the same tendency. In turn, KL-Sum and AbL15 for higher compression rates gen-erate more complex summaries and for the lower compression rates more simple ones. The degree of difficulty for compression rate 20% is almost the same as the degree of simplification for 80% rate. For example, consider AbL15 that for 20% rate generated 12.36% more complex summaries, while for 80% rate 10.16% more simple.
The overall average degree of deviation from the readability of the original document also needs to be taken into account. ExL19 has the lowest av-erage absolute deviation. It generates summaries with closest complexity to the original (2.54%) across all the compression rates.
Contrary to the findings of Lloret et al.(2019), who showed that for the DUC 2002 corpus, ExL19 generated more comprehensible summaries with
7Under “higher compression rates” we understand shorter
summaries; in our study compression rate of 20% is the high-est
respect to FRE, for the BNE corpus, ExL19 tends to select longer words and sentences. We believe the variation in original document complexity is what causes this difference because the BNE co-prus contains texts simplified for L2 learners rang-ing mostly from A2 to B2 CEFR levels, whereas DUC 2002 is comprised of unsimplified newswire documents that are instrinsically more complex. This may indicate that present analysis of selected summarization systems and their impact on read-ability cannot be extended to other domains be-yond L2 learner materials, since the performance of any summarizer depends on the corpus.
6.2 Lexical readability results
Lexical complexity of summaries was evaluated with the help of Dale-Chall formula; lower values of this metric indicate easier to comprehend sum-maries. Results in Table5show that in this evalua-tion SumBasic again simplifies summaries across all the compression rates. KLSum reveals simi-lar values, except for the setting with 20% com-pression rate. Luhn, ExL19 and AbL15 include sentences with high percentage of complex words in summaries. In terms of lexical complexity, summarizers based on graphs (LexRank and Tex-tRank) demonstrate the lowest average absolute deviation across all the compression rates and thus maintain lexical complexity of summaries that are closest to the original documents. For the length-based readability metric, graph-length-based approaches were also among the most similar.
6.3 Syntactic readability results
Parse tree depth statistics can be found in Table
20 3.13% -6.38% 11.37% -13.86% 3.47% 7.87% -15.21%
40 3.03% -3.70% 0.05% -8.06% 0.71% 5.50% -16.63%
60 2.33% -2.48% -2.01% -4.78% -0.20% 4.02% -19.87%
80 1.13% -1.02% -1.73% -2.53% -0.17% 2.46% -23.10%
Avg. abs. dev. 2.41% 3.40% 3.79% 7.31% 1.13% 4.96% 18.70%
Table 6: Parse tree depth statistics.
summaries with more complex syntactic construc-tions and negative percent of deviation indicates that the respective system selects syntactically less complex sentences. For this feature SumBasic again simplifies summaries with respect to the original documents; and graph-based LexRank, by maintaining the lowest average absolute deviation, preserves the original text complexity. For parse tree depth and the other two readability features, KLSum tends to simplify summaries on lower compression rates, but for the compression rate of 20% it generates more complex summaries. Due to the integrated syntactic simplification step, ab-stractive system AbL15 generates sentences with shorter parse trees across all the settings. It also displays the highest average absolute deviation to the original values. Extractive system ExL19 re-veals a similar tendency, namely, while selecting more complex sentences in terms of lexical com-plexity, it tends to include syntactically more sim-ple sentences in summaries.
7 Conclusion and Future Work
In this paper we experimented with a new dataset of level-annotated L2 learner texts that can be used both for text simplification and text summariza-tion tasks. We analyzed its syntactic, lexical and length-based readability features and evaluated its level annotation with a machine learning system trained on data annotated by Cambridge exam an-notators.
We further conducted a novel analysis on how different extractive and abstractive summarization techniques at different compression rates affect readability of simplified L2 learner texts. Our ex-periments showed how this impact varied depend-ing on the system used: 1) frequency-based sys-tem SumBasic consistently simplified summaries with respect to the original texts across all the compression rates, and thus may be considered a competitive baseline, not only in terms of recall but also readability; 2) graph-based approaches, especially LexRank, tended to maintain the same
complexity as the original document; 3) Luhn’s classical frequency-based method generated more complex summaries; 4) KLSum method based on Kullback-Leibler divergence produced com-plex summaries at higher compression rates, while simplifying them at lower compression rates; 5) integration of anaphora resolution, textual entail-ment and word-sense disambiguation led to syn-tactically more simple, but lexically more com-plex summaries; 6) abstractive summarizer AbL15 oversimplified syntactic structures and maintained at the same time a high complexity of lexical read-ability component. Hence no common pattern among the summarization approaches was identi-fied with respect to the effect of compression rate on readability.
This work has provided an insight on the be-haviour of different summarization approaches and permitted the discovery of a necessary dataset, as well as the analysis of the dataset’s readability. These findings can be viewed as the first important step for designing a summarization system aimed at people with different levels of language profi-ciency. Future lines of research will consider inte-grating second language acquisition and discourse readability metrics.
Acknowledgments
Lu, and Dex Tarantan. 2008. Simplifying text in medical literature. Journal of Research in Science, Computing and Engineering4(1):37–48.
Sarah E. Petersen and Mari Ostendorf. 2007. Text sim-plification for language learners: a corpus analysis. In Workshop on Speech and Language Technology in Education.
Emily Pitler and Ani Nenkova. 2008. Re-visiting readability: A unified framework for predicting text quality. In Conference on Empirical Methods in Natural Language Pro-cessing, EMNLP 2008. ACL, pages 186–195.
http://www.aclweb.org/anthology/D08-1020.
Luz Rello, Clara Bayarri, Azuki G`orriz, Ricardo Baeza-Yates, Saurabh Gupta, Gaurang Kanvinde, Horacio Saggion, Stefan Bott, Roberto Carlini, and Vasile Topac. 2012. Dyswebxia 2.0!: more ac-cessible text for people with dyslexia. Proceed-ings of the 10th International Cross-Disciplinary Conference on Web Accessibility pages 41–44.
https://doi.org/10.1145/2140446.2140455.
Luz Rello, Horacio Saggion, and Ricardo Baeza-Yates. 2014. Keyword highlighting improves compre-hension for people with dyslexia. In Proceed-ings of the 3rd Workshop on Predicting and Im-proving Text Readability for Target Reader Pop-ulations (PITR). Association for Computational Linguistics, Gothenburg, Sweden, pages 30–37.
https://www.aclweb.org/anthology/W14-1204.
S. Rebecca Thomas and Sven Anderson. 2012. Wordnet-based lexical simplification of a document. In Jeremy Jancsary, editor, Proceedings of KON-VENS 2012. ¨OGAI, pages 80–88.
Sowmya Vajjala and Ivana Luˇci´c. 2018. On-eStopEnglish corpus: A new corpus for auto-matic readability assessment and text simplifica-tion. In Proceedings of the Thirteenth Workshop on Innovative Use of NLP for Building Educational Applications. Association for Computational Lin-guistics, New Orleans, Louisiana, pages 297–304.
https://doi.org/10.18653/v1/W18-0535.
Jurgita Vizgirdaite. 2009. Filling the child-parent re-lationship gap via the parent self-education and in-tergenerational education on internet slang. Social Sciences (1392-0758)64(2).
Sanja ˇStajner, Richard Evans, Constantin Orasan, and Ruslan Mitkov. 2012. What can readability mea-sures really tell us about text complexity? In Luz Rello and Horacio Saggion, editors, Proceed-ings of the LREC’12 Workshop: Natural Lan-guage Processing for Improving Textual Accessibil-ity (NLP4ITA). European Language Resources As-sociation (ELRA), Istanbul, Turkey.
Kristian Woodsend and Mirella Lapata. 2011. Learn-ing to simplify sentences with quasi-synchronous
ceedings of the 2011 Conference on Empiri-cal Methods in Natural Language Processing. Association for Computational Linguistics, Edinburgh, Scotland, UK., pages 409–420.
https://www.aclweb.org/anthology/D11-1038.
Menglin Xia, Ekaterina Kochmar, and Ted Briscoe. 2016. Text readability assessment for second lan-guage learners. InProceedings of the 11th Work-shop on Innovative Use of NLP for Building Ed-ucational Applications. Association for Computa-tional Linguistics, San Diego, CA, pages 12–22.