University of Windsor University of Windsor
Scholarship at UWindsor
Scholarship at UWindsor
Electronic Theses and Dissertations Theses, Dissertations, and Major Papers
1-28-2019
Numerical and Experimental Analysis of Single Layer Multi-Track
Numerical and Experimental Analysis of Single Layer Multi-Track
Deposition of Clad Beads with Variable Overlap Percentages
Deposition of Clad Beads with Variable Overlap Percentages
Parvaneh ZarehUniversity of Windsor
Follow this and additional works at: https://scholar.uwindsor.ca/etd
Part of the Engineering Commons
Recommended Citation Recommended Citation
Zareh, Parvaneh, "Numerical and Experimental Analysis of Single Layer Multi-Track Deposition of Clad Beads with Variable Overlap Percentages" (2019). Electronic Theses and Dissertations. 7664.
https://scholar.uwindsor.ca/etd/7664
This online database contains the full-text of PhD dissertations and Masters’ theses of University of Windsor students from 1954 forward. These documents are made available for personal study and research purposes only, in accordance with the Canadian Copyright Act and the Creative Commons license—CC BY-NC-ND (Attribution, Non-Commercial, No Derivative Works). Under this license, works must always be attributed to the copyright holder (original author), cannot be used for any commercial purposes, and may not be altered. Any other use would require the permission of the copyright holder. Students may inquire about withdrawing their dissertation and/or thesis from this database. For additional inquiries, please contact the repository administrator via email
Numerical and Experimental Analysis of Single Layer Multi-Track Deposition of Clad Beads with Variable Overlap Percentages
By
Parvaneh Zareh
A Thesis
Submitted to the Faculty of Graduate Studies
through the Department of Mechanical, Automotive and Materials Engineering
in Partial Fulfillment of the Requirements for
the Degree of Master of Applied Science
at the University of Windsor
Windsor, Ontario, Canada
2019
Numerical and Experimental Analysis of Single Layer Multi-Track Deposition of Clad Beads with Variable Overlap Percentages
by
Parvaneh Zareh
APPROVED BY:
______________________________________________ V. Roussinova
Department of Mechanical, Automotive and Materials Engineering
______________________________________________ A. Azab
Department of Mechanical, Automotive and Materials Engineering
______________________________________________ J. Urbanic, Advisor
Department of Mechanical, Automotive and Materials Engineering
iii
DECLARATION OF ORIGINALITY
I hereby certify that I am the sole author of this thesis and that no part of this thesis
has been published or submitted for publication.
I certify that, to the best of my knowledge, my thesis does not infringe upon anyone’s
copyright nor violate any proprietary rights and that any ideas, techniques,
quotations, or any other material from the work of other people included in my
thesis, published or otherwise, are fully acknowledged in accordance with the
standard referencing practices. Furthermore, to the extent that I have included
copyrighted material that surpasses the bounds of fair dealing within the meaning of
the Canada Copyright Act, I certify that I have obtained a written permission from
the copyright owner(s) to include such material(s) in my thesis and have included
copies of such copyright clearances to my appendix.
I declare that this is a true copy of my thesis, including any final revisions, as
approved by my thesis committee and the Graduate Studies office, and that this
thesis has not been submitted for a higher degree to any other University or
iv
ABSTRACT
Laser cladding offers some distinct advantages for surface modifications, and is one
of the direct energy deposition processes used for metal additive manufacturing. In
this study, the effect of variations in the percentage of bead overlap was studied for
6 different scenarios. The overlap percentage varied from 30 % to 47 % along the
length of the beads. The temperature evolution and melt pool depth as well as the
hardness and distortion fields were studied using experimental and numerical
methods. A three-dimensional (3D) transient uncoupled thermo-elastic–plastic
model was generated to simulate a thermal process, hardness and distortion for the
single track and multi-track laser cladding models. The latent heat and phase
transformations effects were considered in the thermal analysis. The numerical
results were validated by experimentally-measured values. To identify the effects of
the length of the clad beads on hardness and distortion, a sensitivity analysis was
performed for a set of single track and multi-track clad beads where the bead length
was doubled. The experimental data values were collected by measuring the clad
hardness (Vickers hardness testing). and a height gage was used to measure
distortion of the base plates before and after the experimental runs. The studies
indicate that the overlap percentage affects the hardness, but not distortion. The
hardness in the multi-track models reduces when the overlap percentage increases.
It has revealed that the depth of the melt pool has a reverse relation with hardness.
Additional studies must be performed, as many parameters, including the tool path,
v
DEDICATION
vi
ACKNOWLEDGEMENTS
I would first like to thank my thesis advisor, Dr. Ruth Jill Urbanic. The door to Prof.
Urbanic office was always open whenever I ran into a trouble spot or had a question
about my research or writing. She consistently allowed this work to be my own
work, but steered me in the right the direction whenever she thought I needed it.
I would also like to thank the experts who were involved in the experimental survey
for this research project: Mr. Bob Hedrick and Mr. Andrew Jenner. Without their
passionate participation and input, the experimental survey could not have been
successfully conducted.
Lastly, I would like to thank my Spouse for helping me to have an organized mind
vii
TABLE OF CONTENTS
DECLARATION OF ORIGINALITY ... iii
ABSTRACT ... iv
DEDICATION ... v
ACKNOWLEDGEMENTS ... vi
LIST OF TABLES ... xi
LIST OF FIGURES ... xii
LIST OF APPENDICES ... xvii
CHAPTER 1 GENERAL INTRODUCTION ... 1
Background ... 1
Additive Layered Manufacturing Processes (ALM) ... 2
1.2.1 Types of Additive Manufacturing Processes ... 3
1.2.1.1 SLA – Stereolithography ... 4
1.2.1.2 SLS Selective Laser Sintering ... 4
1.2.1.3 3D Printing ... 5
1.2.1.4 SCP Smooth Curvatures Printing ... 5
1.2.1.5 LOM Laminated Object Modeling ... 5
1.2.1.6 FDM Fused Deposition Modeling ... 5
1.2.1.7 Laser Cladding Process and Applications ... 6
1.2.2 Laser Cladding Pros & Cons... 8
Motivation and Research Objectives... 9
1.3.1 Motivation ... 9
1.3.2 Thesis Objective... 12
Outline of the Thesis ... 13
CHAPTER 2 REVIEW OF THE LITERATURE ... 14
Introduction ... 14
Microstructural Evaluation of Stainless Steel in Laser Cladding ... 15
viii
Cooling Rate and Solidification in Laser Cladding ... 20
Fatigue Life Consideration of Deposited Material Life by Laser Cladding ... 23
Hardness in Laser Cladding ... 25
Distortion Consideration in Laser Cladding Process: ... 28
Summary ... 30
CHAPTER 3 DESIGN OF EXPERIMENT ... 31
Experimental Design and Methodology ... 31
The Experimental Design Parameters ... 35
Equipment Needed for the Experiments ... 37
Sample Preparation ... 37
Experimental Runs ... 38
3.5.1 First Experimental Run ... 38
3.5.2 Second Experimental Run... 38
3.5.3 Third Experimental Run ... 39
3.5.4 Forth Experimental Run ... 40
3.5.5 Fifth Experimental Run... 40
3.5.6 Sixth Experimental Run ... 41
Distortion Measurement ... 41
3.6.1 Distortion Measurement Before the Experiments... 42
Distortion Measurement After the Cladding Processes ... 43
Hardness Measurement ... 43
3.8.1 Hardness Measurement Approach ... 44
CHAPTER 4 THERMAL AND STRUCTURAL FINITE ELEMENT ANALYSIS METHODOLOGY ... 45
Thermo-Mechanical FE Modeling ... 45
Thermal Analysis ... 47
4.2.1 Thermal Boundary & Initial Conditions ... 50
Mechanical Analysis ... 51
4.3.1 Mechanical Boundary/Initial Conditions ... 52
ix
Melt pool configuration ... 53
Finite Element Model ... 54
4.6.1 Geometric Models Generation ... 55
4.6.2 Mesh Generation ... 58
Material Model ... 67
CHAPTER 5 NUMERICAL RESULTS AND VERIFICATION ... 68
Thermal Results... 68
5.1.1 Single Track Model Thermal Results ... 68
5.1.1.1 Temperature Distribution ... 68
5.1.1.2 Temperature Plots ... 69
5.1.2 Multi-Track Laser Cladding Model Thermal Results ... 70
5.1.2.1 Temperature Distribution ... 70
5.1.2.2 Multi-Track Models Temperature Plots ... 75
5.1.3 Melt pool Size: Experiment vs. Simulation ... 78
5.1.3.1 Melt Pool Size in Single Track Model ... 78
5.1.3.2 Melt Pool Size in Multi-Track Models ... 79
Heat Affected Zone ... 81
5.2.1 Heat Affected Zone Size: Experiment vs. Simulation ... 83
5.2.1.1 Heat Affected Zone Size in Multi-Track Models ... 83
Distortion Evaluation ... 84
5.3.1 Distortion Distributions ... 85
5.3.2 Effects of the Holes on Distortion ... 89
5.3.3 Distortion Validation ... 92
Hardness Evaluation ... 94
5.4.1 Hardness Validation ... 102
CHAPTER 6 SENSITIVITY ANALYSIS ... 104
Distortion of Samples with Different Number of Beads and Lengths ... 104
Sensitivity of the Bead Lengths on Distortion ... 107
6.2.1 Distortion Variation by Increasing Bead Numbers ... 109
x
CHAPTER 7 CONCLUSION AND FUTURE WORK ... 116
Conclusion ... 116
Future Work ... 120
REFERENCES ... 121
APPENDICES ... 136
xi
LIST OF TABLES
Table 1. Literature review summary of microstructural evaluation. ... 16
Table 2. Critical literature review summary regarding thermal analysis. ... 19
Table 3. Literature review summary regarding solidification & cooling rate. ... 22
Table 4. Literature review summary regarding fatigue life. ... 25
Table 5. Literature review summary regarding hardness... 27
Table 6. Literature review summary regarding distortion. ... 29
Table 7. Chemical composition of the substrate and cladding powder. ... 32
Table 8. The static parameters used for the experiments. ... 35
Table 9. Experimental design parameters. ... 36
Table 10. Equipment used for the experiments. ... 37
Table 11. Thermal properties of AISI 1018 and AISI 420. ... 48
Table 12. Electrical resistivity and laser beam wavelength. ... 49
Table 13. The sizes of the s for geometry generation. ... 58
xii
LIST OF FIGURES
Fig. 1. A schematic diagram of the laser cladding process. ... 2
Fig. 2. Different methods of additive layered manufacturing processes. ... 4
Fig. 3. Schematic of the LDMD process [8]. ... 7
Fig. 4. Application of laser cladding process [12-13]. ... 8
Fig. 5. Constant and variable overlap of clad beads on substrate. a) convex substrate. b, c) circular surfaces. ... 12
Fig. 6. Flowchart of experimental sets. ... 31
Fig. 7. Laser cladding work cell utilized for this research. ... 32
Fig. 8. Mapping for distortion measurement on plate with 180 mm length ... 33
Fig. 9. Mapping for distortion measurement on plate with 100 mm length. ... 33
Fig. 10. Variable overlap beads. a) one bead, b) two beads, c) four beads... 34
Fig. 11. Optimal microscope attached with computer. ... 38
Fig. 12. Top view of the single track on 180 mm length substrate. ... 38
Fig. 13. Top view of two beads on 180 mm length substrate. ... 39
Fig. 14. Top view of four beads on 180 mm length substrate. ... 39
Fig. 15. Top view of the single track on 100 mm length substrate. ... 40
Fig. 16. Top view of two beads on 100 mm length substrate. ... 40
Fig. 17. Top view of four beads on 100 mm length substrate. ... 41
Fig. 18. Height gage used for distortion measurements... 41
Fig. 19. Displacement of the plates before the experiments with a) 100mm length, b)180mm length. ... 42
xiii
Fig. 21. Flowchart of uncoupled thermal and mechanical finite element model. .. 47
Fig. 22. FE model set up illustrating the constrained base plate. ... 52
Fig. 23. The effect of the Eq. 17 on element activation. ... 53
Fig. 24. Generation of the finite element models... 55
Fig. 25. Effective bead width for single bead model. ... 57
Fig. 26. The geometric model of two clad beads illustrating the variable overlap regions and its cross-section. ... 60
Fig. 27. The geometric model of two clad beads. ... 61
Fig. 28. The geometric model of four clad beads. ... 62
Fig. 29. a) Geometry, b) FE model for single track laser cladding model, c) Element shape testing summary. ... 64
Fig. 30. a) Geometry, b) FE model for multi-track laser cladding model with two beads, c) Element shape testing summary. ... 65
Fig. 31. a) Geometry, b) FE model for multi-track laser cladding model with four beads, c) Element shape testing summary. ... 66
Fig. 32. Temperature dependent material properties of AISI 1018 and AISI 420, (a) Thermal properties, (b) Mechanical properties [116]. ... 67
Fig. 33. Temperature distribution of single track model. ... 68
Fig. 34. Temperature evolution versus cladding time: single-track laser cladding. a) location of points that their temperatures where considered, b) temperature evolution. ... 69
xiv
Fig. 36. Temperature distribution in multi-track laser cladding model with four
beads. ... 74
Fig. 37. The temperature distribution in multi-track laser cladding with two beads.
a) Points on the first bead, b) Points on the second bead. ... 76
Fig. 38. The temperature distribution in multi-track laser cladding model with four
beads. a) Points on the first bead, b) Points on the second bead, c) Points on the third
bead, d) Points on the fourth bead. ... 78
Fig. 39. Melt pool configuration in single track model. ... 79
Fig. 40. Comparison between numerical and experimental melt pool depth of
multi-track model with two beads. Melt pool depth at, a) the end of 30% overlap, b) the
beginning of 47% overlap. ... 80
Fig. 41. Comparison between numerical and experimental melt pool depth of
multi-track model with four beads. Melt pool depth at, a) the end of 30% overlap, b) the
beginning of 47% overlap. ... 81
Fig. 42. HAZ configuration in single track model. ... 81
Fig. 43. HAZ in cross-section of multi-track model with two beads at, RHS) the end
of 30% overlap, LHS) the beginning of 47% overlap. ... 82
Fig. 44. HAZ in cross-section of multi-track laser cladding model with four beads
at, RHS) end of 30% overlap, LHS) beginning of 47% overlap. ... 83
Fig. 45. Comparison between numerical and experimental heat affected zone depth
of multi-track model with two beads. HAZ depth at, a) the end of 30% overlap, b)
xv
Fig. 46. Comparison between numerical and experimental heat affected zone depth
of multi-track model with four beads. HAZ depth at, a) the end of 30% overlap, b)
the beginning of 47% overlap. ... 84
Fig. 47. Distortion, and b) Thermal gradient distributions in single bead model. . 86
Fig. 48. Distortion, and b) Thermal gradient distributions in multi-track model with
two beads. ... 87
Fig. 49. a) Distortion, and b) Thermal gradient distributions in multi-track model
with four beads. ... 88
Fig. 50. Thermal gradient in Y direction. t=36 S. ... 90
Fig. 51. Higher cooling rate in the left hand side of the part. ... 91
Fig. 52. The location of the nodes for distortion measurements on the intersections.
... 92
Fig. 53. Averaged differences of numerically modeled and experimentally
measured distortion results. a) single track model, b) multi-track with two beads, c)
multi-track with four beads. ... 93
Fig. 54. Hardness distribution in single track model. ... 95
Fig. 55. Hardness Distribution in multi-track model with two bead. a) 30% overlap
cross-section, b) 47% overlap cross-section. ... 95
Fig. 56. Hardness Distribution counters in multi-track model with two beads. a)
30% overlap cross-section, b) 47% overlap cross- section. ... 96
Fig. 57. Hardness, temperature and thermal gradient variation for the nodes N1, N2
xvi
Fig. 58. Hardness, temperature and thermal gradient variation for the nodes N3, N4
specified in Fig. 56a. ... 99
Fig. 59. Hardness, temperature and thermal gradient variation for the nodes N5, N6 specified in Fig. 56b. ... 100
Fig. 60. Hardness, temperature and thermal gradient variation for the nodes N7, N8 specified in Fig. 56b. ... 101
Fig. 61. Comparison of numerical and experimental hardness results. ... 103
Fig. 62. Distortion Distribution in 100 mm base plate samples... 105
Fig. 63. Distortion Distribution in 180 mm base plate samples... 106
Fig. 64.The effects of sample length on distortion. ... 107
Fig. 65. Maximum distortion for the samples with a 100 mm and 180 mm length. ... 108
Fig. 66. The effects of deposited bead number on distortion... 109
Fig. 67. The maximum distortion variation in samples which have 100mm and 180 mm base plates length. ... 110
Fig. 68. Hardness variation in samples with different lengths. ... 111
Fig. 69. Variation of overlap effects on hardness of the samples. ... 112
xvii
LIST OF APPENDICES
Appendices. 1. Distortion experimental results ... 136
1
CHAPTER 1 GENERAL INTRODUCTION
Background
Several heat based procedures are available to improve the mechanical properties of
surfaces for metallic parts which could suffer from erosion or corrosion; for example,
plasma sprays and arc welding techniques have been established for coating surfaces.
When applying one of these techniques, some common problems occur such as the
manifestation of porosity, a poor bonding zone between the applied layer to the base
material, and thermal distortion of the work-piece.
One technique that overcomes these problems is laser cladding. Laser cladding is a
technique which has highly controlled energy input characteristics. In the laser cladding
process, there is a laser beam to melt the coating powder and substrate to create the bonding
between the clad material and the substrate surface. The dilution zone, the region between
the substrate and the clad bead, can be minimal. The desired laser cladding process results
in bonding between the surface and beads generated from the powder material with
minimal residual stress, deformation, dilution, maximal wear resistance, high hardness, a
narrow heat affected zone, and the desired bead geometry. These characteristics can be
controlled by changing the process parameters. The process parameters which can vary and
change the heat affected zone (HAZ), dilution zone, geometry, and mechanical properties
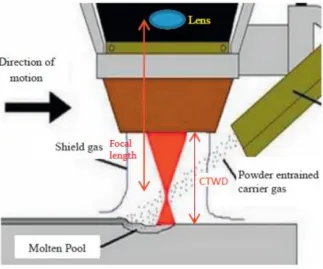
of the clad bead layers are the following (Fig. 1): Laser power (kW), Powder feed rate
(grams/second), Laser speed (mm/sec), Focal length (mm), and Contact tip to work-piece
distance (mm). Due to the ability to focus the energy and create repeatable bead geometry,
2
Fig. 1. A schematic diagram of the laser cladding process.
Additive Layered Manufacturing Processes (ALM)
Additive Layered Manufacturing (ALM) utilizes a high energy heat source to produce a
near-net-shape (3D parts generated by stacking clad bead layers) product. The heat source
in the laser cladding process is used to melt and blend a metallic powder onto a substrate
surface or to produce a near-net-shape product [1]. Based on the way that the powder
particles are deposited on a surface, there are two kinds of ALM. First, the powder is
deposited on the surface by the powder flow through a nozzle, and the laser beams which
moves with the nozzle, and melts powder particles on surface. Secondly, the powder is
pre-placed and laser beam moves across the powder bead to melt powder and create bonding
3
powder particles, which is known as powder bed additive manufacturing [2]. In both forms,
although the way for delivering the powder is different, the moving heat source melts
powder particles. In depositing powder via flowing through a nozzle, the powder is directly
deposited on the surface of the work-piece [3-4], while in powder bed additive
manufacturing the powder is deposited on the work-piece through hoppers and applied on
the surface by a raking or rolling mechanism [5-6].
For producing parts using a layering build strategy, there are many technologies which are
available to produce the parts, and more solutions are being pioneered by industry. In each
additive layered manufacturing technology, the means by which the layers are applied on
top of each other to create a part is different. These are described in the next section.
1.2.1 Types of Additive Manufacturing Processes
Fig. 2 shows the main Additive Manufacturing Processes (AM) that are utilized in industry
- they are stereolithography (SLA), selective laser sintering (SLS), fused filament or
material extrusion processes such as fused deposition modelling (FDM), 3D printing (3DP)
or binder jetting, laminated object manufacturing (LOM) and laser cladding (LC). The
advantages of AM are:
i. Low cost of production because of being free from geometric complexity.
ii. Final fabrication and distribution. (Each product can be fabricated without need of
building a new assembly line or tooling machines)
iii. Effective management of increased complexity of parts without increasing process
planning time.
iv. Reducing manufacturing waste. (In additive manufacturing process each 2D layer
4
Fig. 2. Different methods of additive layered manufacturing processes [7].
Each type of additive manufacturing is defined as follows:
1.2.1.1SLA – Stereolithography
A pool of liquid photopolymer resin is cured by selective exposure to light (by laser or a
projector). After exposing the polymer to light (ultraviolet), it initiates polymerization and
converts the exposed areas to a solid part [7].
1.2.1.2SLS Selective Laser Sintering
Powdered materials are melted by using a heat source such as a laser or electron beam and
then consolidated. The powder surrounding the consolidated part support may support
overhanging features, but support structures may be required for a domed shape, holes not
perpendicular to the build plane, and so forth. [7].
AM
SLA
SLS
3D
Printing
SCP
LC
5
1.2.1.33D Printing
For 3D printing or binder jetting, liquid bonding agents are applied onto thin layers of
powdered material to generate the final parts layer by layer. Bonding agents can be organic
and inorganic materials. The powder for metal or ceramic materials is used in this process
[7].
1.2.1.4SCP Smooth Curvatures Printing
Material droplets are deposited layer by layer to make 3D parts. Common varieties include
jetting a photo curable resin and curing it with UV light, as well as jetting thermally melted
materials that solidify in ambient temperatures [7].
1.2.1.5LOM Laminated Object Modeling
Laminated object manufacturing is a technology that applies sheets of a material on top of
each other to form a part. Unneeded regions are cut out layer by layer and removed after
the object is built. [7].
1.2.1.6FDM Fused Deposition Modeling
The fused deposition modelling process involves using thermoplastic materials (a polymer
that changes to a semi-liquid state upon the application of heat and solidifies when heat
source is eliminated) which are injected onto a platform through nozzles. The nozzles move
6
1.2.1.7Laser Cladding Process and Applications
Laser cladding is defined as the process of protecting one metal by applying a second metal
on its surface. Materials with high quality in mechanical and physical properties are used
to produce coating on the worn-out surfaces [8]. The laser cladding technique uses a laser
beam to fuse coating material with different mechanical and metallurgical properties onto
a substrate surface. The laser beam has to melt a thin layer of the substrate surface to create
metallurgical bonding between coating material and work-piece (this is the dilution zone).
The thickness of this melt layer should be small to restrict the dilution of the substrate
material and the coating to preserve the primary characteristics of the coating material.
The coating material usually is powdered and can have similar mechanical-metallurgical
properties with respect to substrate or it can be dissimilar to the substrate. In industry, for
improving the substrate surface properties, dissimilar metals are used for the coating
materials [9].
In the laser cladding process, a laser beam acts as the heat source to melt the coating
material powder or wire when it is being deposited onto the substrate surface. This process
uses an off-axis or coaxial nozzle to inject the powder into the melt pool on the substrate
as shown in Fig. 3. Laser cladding is a pioneer coating technology which creates a strong
bonding between the substrate surface and coating material [10]. Today, laser cladding is
7
Fig. 3. Schematic of the LDMD process [8].
The laser cladding process can be applied for both coating and repairing, as well as for
rapid prototyping [11]. The laser cladding technology is widely used for repairing and
refurbishing of expensive components (Fig. 4). Laser cladding can be used to support rapid
design changes (local modifications), functional coatings, and generation of 3D
8
1.2.2 Laser Cladding Pros & Cons
Today, interest for applying the laser cladding technique to make large metallic
components, or generating coating for parts is increasing. Most of the components which
are needed to be produced should have high wear and corrosion resistance as well as high
hardness. Laser cladding is one of the best technologies to satisfy most of these
requirements [11]. Advantages of laser cladding include:
i. Different types of powders could be mixed and the feed rate for each powder is
controllable.
ii. Laser cladding can cause the hardness, yield strength and fatigue strength of the
component to increase [14].
9
iii. In order to reach a narrow heat affected zone (HAZ), energy of beam has the ability
to be focused to a very small spot [15].
iv. Mechanical failures can be restricted by minimizing the heat affected zone (HAZ).
Disadvantages of laser cladding include:
i. High investment cost,
ii. Low efficiency of the laser source,
iii. Lack of control over cladding- some process parameters should be set at the
beginning of the process and cannot change during deposition, and
iv. Skilled operators are required.
Motivation and Research Objectives
The laser cladding technology has been noticed by more manufacturers due to the
advancement of laser techniques. This technology needs high investment, but because of
its high potential for different areas of industry (coating creation, repair, rapid prototyping
and so forth,) much research has been done related to understanding the different aspects
of this technique. Unlike the other technologies, laser cladding has the ability to restrict the
heat affected zone (HAZ) and create a high strength bonding connection between a coating
and the substrate surface, and as a result enhance the physical and metallurgical properties
of the components. In this process the depth of dilution should be as small as possible to
maintain the unique properties of coating material.
1.3.1 Motivation
As explained previously and in more detail in chapter 2, many aspects of the laser cladding
10
additive manufacturing processes, as it can create a component or coating without any
restrictions which have limited the other technologies. Some researchers have investigated
multi-track bead configurations with constant overlap beads both experimentally and by
simulation, and have considered the effects of different input parameters on the mechanical
and metallurgical properties of the components. The effects of the manufacturing processes
on the bead geometry has been investigated as well. However, most of the parts which are
being coated by laser cladding do not have rectangular surfaces. Their complex geometry
makes the generation of coating tool paths complicated. Multi-track beads with a constant
overlap cannot be a solution. In this study a solution to reduce the uncoated spots on the
substrate surface is introduced. Fig. 5 shows different shapes of a substrate which need to
be coated with a variable overlap percentage in some regions. By deposition of beads with
a constant overlap percentage, there are still some uncovered regions. The only solution to
solve this problem is to introduce a variable overlap. Coating complex parts is a common
problem in industry, and the problem is greater for parts to be made by an additive
manufacturing approach. However, any solution to eliminate this problem has not been
investigated previously. This study aims to investigate mechanical properties of multi-track
beads with variations in their overlap percentage to reach a deep understanding about their
final characteristics. This will help process planning strategies for complex parts.
In today’s industry, there are many expensive parts. These parts may need to be coated to
be durable, otherwise they will have to be replaced during usage. On the other hand, some
parts are used in situations that are subject to corrosive fluids or are used in abrasive
environments. Parts replacement is not economical. Covering them with a high quality
11
with high mechanical quality to that covers all of the worn out surfaces equally and
minimizes the uncovered areas. This will also be a problem when fabricating near net shape
components as each layer may be different. New AM based tool path solutions need to be
introduced. This study aims to understand the impact of introducing a variable overlap
percentage between adjacent beads, and considers the mechanical properties of a final
coating for this approach. Fig. 5 clearly illustrate the problem and the intended solution.
12
Fig. 5. Constant and variable overlap of clad beads on substrate. a) convex substrate. b, c) circular surfaces.
1.3.2 Thesis Objective
In laser cladding a layer of clad material is placed on a substrate to improve its mechanical
and metallurgical properties. Based on the different thermal properties of the coated
material and the substrate, an uneven temperature distribution is created in this area. In
laser cladding a very sharp thermal gradient exists near the heat source. This thermal
gradient has a significant effect on the mechanical properties of the deposited clad, and
impacts the substrate. The high temperature reduces quickly and causes distortion of final
component. Therefore, the final dimensions, as well as the mechanical, and physical
characteristics are impacted by the process settings, the materials being used, and the tool
path parameters.
In depositing a clad layer on a substrate one of the main points is that all the surface of the
substrate should be covered by the clad layer to achieve the desired results. Uncovered or
partially covered areas can create failure points and reduce the component life. Using a
constant bead overlap has been considered by different researchers, which will be discussed
more in chapter 2. However, in many cases the overlap is not constant, especially at a
boundary (Fig. 5). In this study a controlled variable overlap condition is introduced. The
13
novelty of this study is that the thermal zone, hardness, and distortion in multi-track laser
cladding models with variable overlap percentages are explored and quantified.
The long term goal of this study is to model 3D parts generated by stacking clad bead layers
and predicting the resultant quality. New layering tool paths need to be developed. Here,
this research will quantify a surface coating problem (2D) for a variable overlap percentage
scenario to understand the influence of the percentage overlap on the mechanical
properties.
Outline of the Thesis
This thesis is divided into six chapters, which are summarized as the following:
Chapter 1 provides the general information and different additive manufacturing methods.
The laser cladding process is defined and its advantages and disadvantages are expressed.
Also, the research objective and its motivation are presented.
Chapter 2 provides a review of the literature related to this research topic to identify the
contribution of this work. The background for hardness and distortion analyses, phase
diagrams and thermal control are also discussed. The experimental setup and data
acquisition system is discussed in chapter 3. The simulation methodology is presented in
chapter 4. The experimental and numerical results of thermal and structural analyses are
discussed in chapter 5. The sensitivity of bead lengths on hardness and distortion are
presented in chapter 6. The final section, chapter 7, the conclusions and future perspectives
14
CHAPTER 2 REVIEW OF THE LITERATURE
Introduction
In comparison to physical vapor deposition [16,17], chemical vapor deposition [18,19],
and spraying processes [20,21], laser cladding is more valuable because it can deposit clad
layers to achieve high hardness, good wear resistance and can be highly resistant to
oxidation [22]. Laser cladding can be affected by the laser power, powder feed rate, laser
travel speed etc. Laser cladding is a complex thermal and metallurgical process. This
technology has the potential to grow significantly for both cladding and additive
manufacturing. Research activities are being investigated all around the world to
understand and enhance the quality of this process. Many researchers have focused on
finding the optimized process parameters to increase the efficiency of the process.
Laser cladding technology is a combination of laser technology, (CAD/CAM) design,
powder metallurgy and so on to create a coating layer or parts via a layering strategy. This
technology’s existence originated from the lasers’ discovery [23]. The term “laser” is an
abbreviation for “Light Amplification by Stimulated Emission of Radiation”. A laser beam
is generated by emitting light coherently which has the ability to be focused on a spot. This
attribute of lasers, is leveraged for laser cladding, laser cutting, etc. applications. Ciraud
[24] in 1971 introduced laser based additive manufacturing for the first time. He suggested
a powder-based direct deposition additive manufacturing technique. In his research, he
focused on non-metallic powders. One of the primary methods of using laser cladding for
metallic materials was investigated in 1982 by Brown et al. [25]. They suggested
production of a part by depositing some thin layers of clad beads to reach a near-net-shape
15
Other research related to the usage of a laser for surface treatments was conducted in the
70’s by Gnanamuthu [26], Seaman [27] and Weerasinghe et al. [28].
Microstructural Evaluation of Stainless Steel in Laser Cladding
Based on the desired mechanical-metallurgical properties of deposited materials, the
microstructures for both the deposited layers and the substrate are important factors for the
laser additive manufacturing process [29].
Gas tungsten arc cladding [30], plasma spraying [31], laser cladding, and high velocity
oxygen fuel spraying (HVOF) [32] etc. are the technologies used for surface treatments.
Among them, laser cladding generates a strong metallurgical bonding between a dense
coating and work-piece surface. Laser cladding has different advantages with respect to
conventional procedures [33-35]. The microstructures for many metallic materials were
studied by different researchers in laser cladding process. AISI 316 steel has outstanding
corrosion resistance in most chemical, salty and acidic environments and its high amount
of Mo helps to increase wear resistance in marine environments [36].
The low carbon AISI 316 is called AISI 316 L, is used for vivo applications [37-38]. Today,
AISI 316 L is used in laser cladding technology for production of dental caps, ultra-light
structures and channels for aircraft, automotive, and medical industries.
Ready [39] investigated the tensile strength, yield strength and total elongation of AISI 316
depositions. The relationship between the final material properties of the deposited beads
and input parameters of AISI 316L deposition were evaluated by Pinkerton and his
colleagues [40]. David et al. [41] considered the rapid solidification effects on the
microstructure for austenitic stainless steels used in welding processes. Zhang et al. [42]
16
microstructure and properties of the laser direct deposited coatings. Mazumder et al. [43]
investigated the microstructure and mechanical properties for the H13 alloy deposition for
production of a 3D component.
Table 1. Literature review summary of microstructural evaluation.
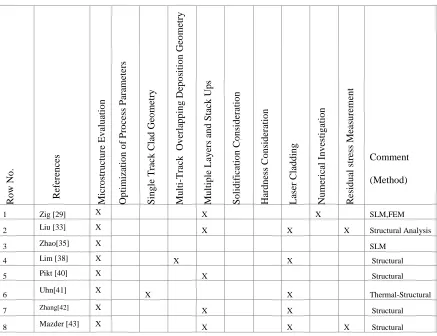
R o w No . R ef er en ce s Mic ro str u ctu re E v al u atio n Op tim izatio n o f Pro ce ss Par am eter s Sin g le T rac k C lad Geo m etr y Mu lti -T rac k Ov er la p p in g Dep o sitio n Geo m etr y Mu ltip le L ay er s an d Stack U p s So lid if icatio n C o n sid er atio n Har d n ess C o n sid er atio n L aser C lad d in g Nu m er ical In v esti g atio n R esid u al str es s Me asu rem en t Comment (Method)
1 Zig [29] X X X SLM,FEM
2 Liu [33] X X X X Structural Analysis
3 Zhao[35] X SLM
4 Lim [38] X X X Structural
5 Pikt [40] X X Structural
6 Uhn[41] X X X Thermal-Structural
7 Zhang[42] X X X Structural
8 Mazder [43] X X X X Structural
It can be seen that many studies have been conducted to analyse the microstructure of the
clad beads. No foundation for process parameter optimization was provided. Thermal
models, which would quantify solidification, are not studied, except for reference [41],
where a thermal structural analysis for a single bead is explored. No one has considered
the effects of overlap variations for the laser cladding process considering the thermal,
17
Thermal Control in Laser Cladding
The physical-metallurgical properties of the clad layers depend on the solidification of the
deposited materials. The thermal history impacts the solidification structure and the texture
of the deposited material. Solidification affects the texture of the deposited material and is
controlled by the cooling rate [44]. The heat flow supplied by the laser beam is selected to
balance the heat affected zone, size of the fusion regions, the microstructure and properties
of deposited layers [45,46]. Heavy heat input causes the strength of the structure to be
reduced and increases the residual stress [47,48]. Bi et al. [49] evaluated the thermal cycle
of AISI 316L for depositing a thin clad layer onto a work-piece. The melt pool temperature
was measured, and it was found that the variation in the melt pool temperature and cooling
rate causes dimensional and microstructure errors. Doubenskaia et al. [50] monitored the
temperature of the melt pool with pyrometers and special cameras in laser cladding process
with a coaxial powder injection, and clarified instabilities caused by varying the operating
parameters in cladding area. Hu et al. [51] used two thermocouples to specify a laser
cladding temperature distribution. The temperature of the deposition varied in the range of
1650 ℃ and 1800 ℃ under different processing situations. The effects of the powder feed
rate, scanning speed of the laser, spot size, laser power, and flow rate of shielding gas on
the melt pool were investigated by Hua et al. [52]. They found a relation between the melt
pool temperature and the clad bead thickness.
The prediction of the clad bead shapes was conducted by Peyre and his colleagues [53].
Wang et al. [54] presented a 2D thermal model to anticipate the temperature distribution
while laser cladding of metal on stainless steel 316. They illustrated the thermal profiles
18
history influence on the properties and microstructure of deposited stainless steel 410 was
investigated by Zahng et al. [55]. Vasudevan et al. [56] monitored the melt pool by infrared
thermography. They measured the temperature profiles by using a combination of
thermocouples and IR thermography to specify emissivity.
Some researchers controlled the melt pool temperature in the laser cladding process by
installing closed-loop controllers. A predictive control system to control the melt pool
temperature was presented by Song et al. [57]. A PID controller was developed by Salehi
and Brandt [58] to monitor melt pool temperature and to control it during the laser cladding
process. The clad layer quality as well as the dilution zone and the extent of the Heat
Affected Zone (HAZ) was considered. They understood by only controlling the melt pool
temperature, the desired cladding results can not be reached. Controlling the melt pool size
and other process parameters are also essential to control the cladding process and improve
19
Table 2. Critical literature review summary regarding thermal analysis.
Although several experimental thermal analysis studies have been conducted with multiple
beads, limited researchers assessed hardness, or the solidification. These researchers,
except for references [53] and [55], did not develop simulation models, so they did not
report trends along the geometry. The effects of variation of the overlapping beads on the
thermal behaviour of the work-piece also has not considered yet.
Ro w No . Re fe re n ce s M icro stru ct u re Ev al u ati o n Op ti m iza ti o n o f P ro ce ss P ara m ete rs S in g le T ra ck Clad Ge o m etry M u lt i-T ra ck Ov erlap p in g De p o si ti o n Ge o m etry M u lt ip le L ay ers an d S tac k Up s S o li d ifi ca ti o n Co n sid era ti o n Th erm al An aly sis Ha rd n ess Co n si d era ti o n Nu m erica l In v estig ati o n Re sid u al stre ss M ea su re m en t Comment (Method)
1 Koryn
[44] X X X
Thermal Analysis
2 Bonfaz
[45] X X
Thermal Analysis
3 Yue [46] X X X Thermal/
Structural.
4 Barr [47] X X X X Thermal
Analysis
5 Fallah
[48] X X X X
Thermal/ Structural.
6 Gasser
[49] X X X X
Thermal/ Structural.
7 Douen
[50] X X X X
Thermal/ Structural.
8 Hu [51] X X Thermal Analysis,
9 Hua [52] X X X X Thermal
Analysis,
10 Peyre [53] X X X Thermal
Analysis
11 Wang
[54] X X
Thermal Analysis
12 Zhang
[55] X X X X
Thermal Analysis
13 Vadvn
[56] X X Melt Pool
14 Song [57] X X X X PID Controller
15 Salehi
[58] X X X
20
Cooling Rate and Solidification in Laser Cladding
Much research has been done for melt pool temperature analyses, but few researchers have
worked on cooling rate measurements for laser additive manufacturing. Griffith and
Hofmeister [59] utilized metallographic and thermal imaging for Laser Engineered Net
Shaping processing of stainless steel 316 and H13. They [59] used a 12-bit digital
charge-couple camera for the radiant intensity measurements and utilized thermal imaging for
temperatures, gradients, and cooling rates around the melt pool measurements. They [59]
figured out that it is not practical to use a thermal imaging system in real time to measure
cooling rates, because of the complexities of the process. Griffith and his colleagues [59]
reported a range for cooling values between 200–6000 𝐾𝑠−1 for the solid-liquid interfaces.
For the melt pool, length range was from 0.5 𝑚𝑚 to 1.5 𝑚𝑚.
The thermal behavior of Laser Engineered Net Shaping processing of stainless steel 410
was characterized by Wang et al. [60] with the usage of a two-wavelength imaging
pyrometer. They found that the melt pool maximum temperature is approximately 1600°C.
They [60] realized that the melt pool size and cooling rate depend on the travel velocity
and the laser power. Yamashita et al. [61] used two high-speed cameras and one two-color
thermometry to measure the temperature during laser cladding. They measured the
temperature distribution and the temperature history precisely and found that the cooling
rate is high during laser cladding.
Yu et al. [62] utilized two different methods for measuring temperature in the laser cladding
process of AISI 304. The first one was an online measurement of the melt pool by
real-time tracking, in which the sensor and laser head moved with each other and focused on
21
at a fixed-point, in which the sensor focused on the midpoint of the clad bead without
movement. They [62] found that cooling rate decreases with the powder feed rate reduction
and increases with the laser power and scanning velocity for a single layer deposition
experiment. The cooling rate increases with an increase in number of the deposition layers.
For prediction and controlling the laser cladding process, understanding the theory of
solidification is crucial. Solidification determines the microstructure of the cladding
deposit. So, it is an important factor to predict the morphology of the cladded structures
[63].
The deposited materials have an either equiaxed or columnar grain structure during
solidification [64]. The desired structure has a columnar morphology. The ratio of the
temperature gradient to the solidification rate, G/R, determines the solidification
morphology. A high ratio of G/R causes a columnar morphology and a low ratio of G/R
causes an equiaxed morphology [63-69]. Process parameters influence the thermal history
of the cladded materials. Gaumann et al. [67] noticed a reduction in the laser power causes
the temperature gradient to increase when laser cladding the CMSX-4 super alloy. Zhang
et al. [70] determined that a lower laser power for cladding Inconel 718 alloy causes a finer
microstructure. A reduction in input energy is aligned with a cooling rate increase and a
22
Table 3. Literature review summary regarding solidification & cooling rate.
R o w No . R ef er en ce s Mic ro str u ctu re E v al u atio n Op tim izatio n o f Pro ce ss Par am eter s Sin g le T rac k C lad Geo m etr y Mu lti -T rac k Ov er la p p in g Dep o sitio n Geo m etr y Mu ltip le L ay er s an d Stack U p s So lid if icatio n C o n sid er atio n Har d n ess C o n sid er atio n Nu m er ical In v esti g atio n R esid u al str es s Me asu rem en t Comment (Method)
1 Hofmester
[59] X X X LENS Processing
2 Wang [60] X X X X X LENS Processing
3 Yamashita
[61] X Melt Pool
4 Yu [62] X X Interfacial tensions,
5 Roberts [63] X X X dendrite arm spacing
6 Nie [64] X X X Element birth
7 Xiangyi [65] X X X X Secondary dendrite
8 Hunt [66] X X X Columnar spacing
9 Gäumann
[67] X X X X gas-turbine blade
10 Gan [68] X X X X Plasma spray
11 Madison
[69] X X X X Dendritic growth
12 Zhang [70] X X X X X X Heat treatment
13 Bonifaz [71] X X X X gas welding
Although many researchers considered the solidification effects on mechanical properties
of clad bead area, there is a lack of consideration of the mechanical properties of the clad
areas for their experiments (i.e. hardness). Many researchers explored the microstructure
evolutions, and had developed thermal models, but reported limited hardness data. No one
23
Fatigue Life Consideration of Deposited Material Life by Laser Cladding
For controlling laser cladding process, the main output parameters should be known. The
clad geometry and the microstructure of clad tracks are two of the important output
parameters and used to specify the mechanical and metallurgical properties of the
deposition. Additionally, other parameters such as the bonding, hardness, wear resistance,
residual stress, crack formation, and surface roughness have high importance in order to
produce a part or a coating on a work-piece, repair a mold, and so on.
Although the laser cladding process has many advantages, the high heat gradient which
causes rapid heating and cooling characteristics during laser cladding process and
solidification causes residual stress which is one of the critical factors that influences the
life time of a part [72-76].
The generation of residual stresses is divided into to events: (1) solidification or primary
cooling which happens when temperature of melt pool reduces which results in the
solidifying of the cladding structure; and (2) rapid cooling or secondary cooling which
happens when temperature of whole of the structure that consists of the substrate and
coating reduces to room temperature [33]. Residual stress in a clad bead consists of thermal
stress, structural stress, and restraint stress. Among them residual stress generated by the
thermal gradient is predominant. Tensile residual stress concentrated in the clad bead and
compressive residual stress is concentrated in the Heat Affected Zone area (HAZ) and
substrate [77].
Previously, several methods have been used by researchers to reduce residual stress;
including designing cladding material compositions, optimizing process parameters, and
24
stainless steel doped with V2O5. They determined that the cracks number were significantly
reduced by increasing content of V2O5. Weng et al. [79] prepared coatings on Ti6Al4V
substrates by laser cladding a Co42 self-fluxing alloy with TiN and Y2O3 mixtures.
Coating with 1.0% Y2O3 (mass fraction) resulted in good metallurgical bonding with the
substrate and it did not have cracks. Riquelme et al. [80] fabricated a coating by Al matrix
reinforced by SiC on a ZE41 magnesium alloy. They found that the optimum parameters
for laser cladding was 650 W of laser power and 17 mm/s of laser speed to improve the
coating mechanical properties. Zhou et al. [81] considered crack susceptibility in Ni-based
composite coatings on A3 mild steel with different input parameters and found that crack
susceptibility increases with an increase in laser power.
Different researchers have worked on the composition of coatings or on finding optimal
input parameters; however, the selected composition or input parameters are suitable for a
specific laser cladding process. Fallah et al. [82] focused on the reduction of residual stress
by preheating the substrate before deposition and found this can help to prevent crack
initiation. Lestan et al. [83] considered Metco 15E powder deposition by the
Laser-Engineering Net Shaping technology onto cast iron and found this technology decreased
number of cracks in the coating. Nazemi et al. [84] considered effects of heat treatment on
residual stress and found putting the cladded component in a furnace with temperature of
565 ± 5 C reduces residual stress and results in crack sustainability reduction. They
determined that optimal time for the heat treatment was 1 hour and realized that the residual
25
Table 4. Literature review summary regarding fatigue life.
Hardness in Laser Cladding
The resistance of a material from penetration of a semi-static force is named hardness.
Hardness has a direct relationship with scratch proof ability which means harder materials
are hard to scratch. It also has a direct correlation with the yield strength or ultimate tensile
strength of materials [85]. A well known hard material is diamond and one of the softest
material is Aluminum. Diamond is an excellent candidate to be used as a coating material.
R o w No . R ef er en ce s Mic ro str u ctu re ev alu atio n Op tim izatio n o f p ro ce ss p ar am eter s Sin g le T rac k clad g eo m etr y Mu lti -T rac k o v er lap p in g d ep o sitio n g eo m etr y Mu ltip le lay er s an d s tack u p s So lid if icatio n co n sid er atio n Har d n ess co n sid er atio n Nu m er ical in v esti g atio n R esid u al str es s C rac k in g s u sce p tib ilit y Comment (Method)
1 Alam [72] X X X X Bead Geometry
2 Liu [73] X X X Corrosion Reduction
3 Nazemi[74] X X X Thermal/ Structural
4 Vundru [75] X X X Mechanical model
5 Köhlera [76] X X Mechanical model
6 Nazemi [77] X X X X Distortion
7 Wang [78] X X X X Distortion
8 Weng [79] X X X Composite coating
9 Riqulme [80] X X X X Melt pool
10 Zhou [81] X X X X X Laser rapid cladding
11 Fallah [82] X X X X Preheating process
12 Lestan [83] X X X X (lens™) technology
26
Its high thermal conductivity and low thermal expansion have made it a perfect material to
be used in laser cladding [85]. Diamond can be used as a tool for measurement of hardness
in other clad layers. Some input process parameters and the complex temperature
distribution cause variations in hardness values of the clad beads [87-91].
Wang et al. [92] investigated the deposition of Ni60 with CeO2, Y2O3, and La2O3 on a
surface of 6063 aluminum alloys. Both with the rare earth content and without the rare
earth content, the hardness of coating of the layers decreased from the clad coating toward
substrate. In comparison to the Ni60 cladding layer without the rare earth content, the
added rare-earth materials enhanced the surface hardness of the Ni60 cladding layer [92].
Some researchers have worked on the hardness pattern in clad layers generated with
amorphous alloys on the substrates. Amorphous alloys are meta-stable products fabricated
by rapid cooling. A series of FeNiP(Si)B amorphous coatings were generated through
flame spraying in 1984 by Miura et al. [93]. After that, amorphous coatings were fabricated
widely by laser cladding [94-97]. The hardness of these coatings is very high [98-100].
Nazemi et al. [101] considered hardness in multi-track laser cladding models with 40%,
50% and 60% overlap both experimentally and numerically and found that in all cases, the
hardness decreased from the first bead to the third bead. The highest average of hardness
for the first, second and third bead belonged to the 60%, 40% and 50% overlap,
respectively. However, Nazemi et al. determined that the hardness varies at the joint
27
Table 5. Literature review summary regarding hardness
R o w No . R ef er en ce s Mic ro str u ctu re ev alu atio n Op tim izatio n o f p ro ce ss p ar am eter s Sin g le b ea d clad g eo m etr y Mu lti -tr ac k o v er lap p in g d ep o sitio n g eo m etr y Mu ltip le lay er s an d s tack u p s So lid if icatio n co n sid er atio n Har d n ess co n sid er atio n Nu m er ical in v esti g atio n R esid u al str es s C rac k in g s u sce p tib ilit y Comment (Method)
1 Pavlina [85] X Yield Strength, Tensile
Strength
2 Iravani [86] X X X X Diamond
3 Lewis [87] X X X X Near-Net Shape Accuracy
4 Mazumder
[88]
X X X Closed-Loop Controlled
Process
5 Mazumder
[89]
X X X X Closed Loop Optical
Feedback System
6 Shin [90] X X X X X Heterogeneous Solid
Modeling
7 Yu [91] X X X Fabricating Stability
8 Wang [92] X X X Rare-Earth Oxides
9 Liu [93] X Fe-Based Amorphous
Coatings
10 Zhou X X X X Re-Melting Clad Beads
11 Cao [95] X X X X Composite Coating
12 Zhu [96] X X X Amorphous Composite
Coating
13 Wu [97] X X Amorphous Alloy
Coating
14 Lu [98] X X X X Triple Laser Scanning
Strategy
15 Tan [99] X X X X Composite Coatings
16 Köster
[100]
X X X Amorphous Composite
Coating
17 Nazemi
[101]
X X X Thermal/ Structural
Analysis
Based on the research that has done on laser cladding processes, it was revealed that the
deposition of multi-track beads causes reduction of hardness from the first bead to the last
28
Based on the effects that the overlap percentages have on hardness, there is a research gap
regarding hardness behavior in multi-track clad beads with variations of the overlap
amount, which considers the thermal gradients, solidification, hardness and bead geometry,
and have experimental data which correlates well to a simulation model. One of the
contributions of this study is to understand this build condition.
Distortion Consideration in Laser Cladding Process:
The distortion that a part experiences through cladding process is similar to the distortion
that it would experience during welding processes [102], as the laser cladding process has
a lot in common with welding processes. The number of passes, the deposited material
volume, and not having a specific joint geometry are differences between laser cladding
and welding [102]. Lindgren et al. [103] investigated welding distortion and residual stress
formation by utilizing finite element methods. Chiumenti et al. [104] considered the ways
that laser cladding process can influence final distortion quantities to find that the final
mechanical properties resulted from different deposition passes. Fessler et al. [105]
investigated the sequences of the deposition passes. Klingbeil et al. [106] considered the
effects of pre-heating on the final distortion. Vayre et al. [107] analysed the fixturing effects
on distortion. All of the aforementioned researchers used a variety of different materials
and different process parameters. Although they checked the final distortion, they did not
consider the accumulation of distortion during the cladding process.
Grum et al. [108] measured the strain evolution during the laser cladding process for
different deposition patterns and laser energy. Plati et al. [109] used their model to measure
deformation and found that plastic deformation causes residual stresses generation also led
29
Ocelí k et al. [110] measured in situ strain and deformation during single and multi-pass
laser cladding with several powder materials and used steel and stainless steel as substrate.
They figured out that the displacement at the beginning and the end of the laser tracks were
approximately the same, which showed the plate bending symmetry.
Table 6. Literature review summary regarding distortion.
R o w n o . References Mic ro str u ctu re ev alu atio n Op tim izatio n o f p ro ce ss p ar am eter s Sin g le b ea d clad g eo m etr y Mu lti -tr ac k o v er lap p in g d ep o sitio n g eo m etr y Mu ltip le lay er s an d s tack u p s Dis to rtio n Har d n ess co n sid er atio n Nu m er ical in v esti g atio n R esid u al str es s C rac k in g s u sce p tib ilit y Comment (Method)
1 Heigel [102] X X In Situ Measurements
2 Lindgren [103] X X X X Welding Process
3 Chiumenti [104] X X X X Deposition Pass Orientation
4 Fessler [105] X X X Sequence of Deposition Passes
5 Klingbeil [106] X X X X Pre-Heating
6 Vayre [107] X Electron Beam Melting
7 Grum [108] X X X X X Part Fixturing
8 Plati [109] X X X Composite Deposition Martial
9 Ocelí [110] X X X X X Re-Melting
As explained in this section many researchers considered distortion in different laser
cladding processes, but as it can be noted, no one considered the affects that variation of
30
Summary
The laser cladding process, as a material processing technique, is being used to fabricate
coating layers or near-net 3D components directly from their CAD models. The laser
cladding setup consists of a positioning device, a laser beam, and a material deposition
system. In the laser cladding process, a laser beam is used as a heat source to melt a small
spot on a substrate, placed on a work station, which moves along predefined toolpaths. By
delivering the powder material into the melt pool, a track is formed and as the heat source
moves away the melted material solidifies.
It is evident from the summary matrixes provided in this chapter that researchers have used
the cladding process for additive manufacturing and contributed significantly in analyzing
and modeling of the single and multi-track beads with constant overlap percentages.
A research gap is identified in the areas of multiple beads with overlapping conditions, and
the effects of variable overlap on the mechanical properties and distortion, which is the
focus of this research. In this research we generate a calibrated numerical model to find the
effects of the overlap percentage variation on hardness and distortion. This model will be
extended to be used for multiple layers and thin wall bead stacking scenarios.
This study introduces variable overlap percentage multi-track laser cladding models to
enhance the quality of coatings by increasing the coverage of the work-piece surface. The
31
CHAPTER 3 DESIGN OF EXPERIMENT
Experimental Design and Methodology
To explore the influence of variable overlap on the melt pool depth, distortion, and
hardness, 18 sets of samples were generated. All of the experimental procedures are
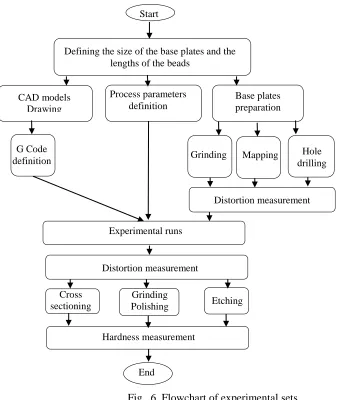
summarized in a flowchart shown in Fig. 6.
Fig. 6. Flowchart of experimental sets. Defining the size of the base plates and the
lengths of the beads
CAD models Drawing
G Code definition
Distortion measurement Start
Process parameters
definition Base plates preparation
Mapping
Grinding Hole
drilling
Experimental runs
Distortion measurement
Cross
sectioning Polishing Grinding Etching
Hardness measurement
32
Single bead and multi-track bead laser cladding experiments are conducted to deposit AISI
420 onto a mild steel substrate (AISI 1018) using a 2.4kW diode laser and a coaxial nozzle.
The compositions of the materials are shown in Table 7.A robotic based laser cladding cell
is used for cladding process (Fig. 7).
Fig. 7. Laser cladding work cell utilized for this research.
Table 7. Chemical composition of the substrate and cladding powder.
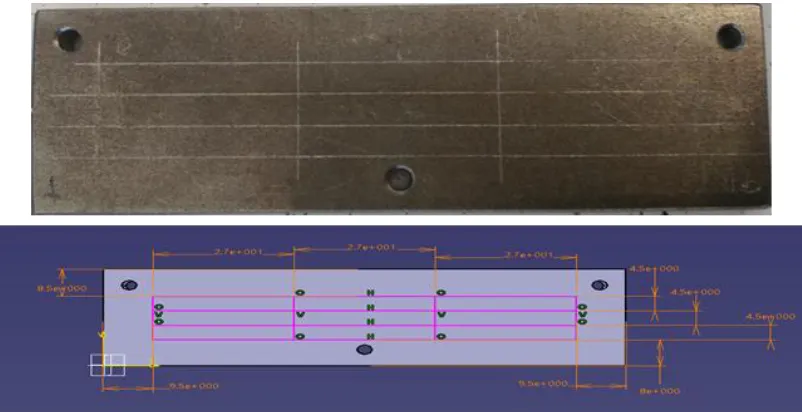
All the plates have the same width and height, 30 mm and 5 mm, respectively. Three
samples have a 180 mm length and the other three samples have a 100 mm length. A Speed
Grinder & Polisher with an Automet 3000 Power head were used to polish the base plates
prior to deposition. Distortion measurements were conducted on the face of the specimens
which is not cladded. In order to have the same reference level for distortion measurements,
the basic 3-2-1 fixturing principle was used. Three 3 mm holes are drilled through the plate.
33
The same three locations will be used on each specimen. Ball bearings were placed
underneath the holes on the surface plate. This will establish a planar surface for reference
and a stable, static method for locating all samples (Fig. 8,9). For all the samples a
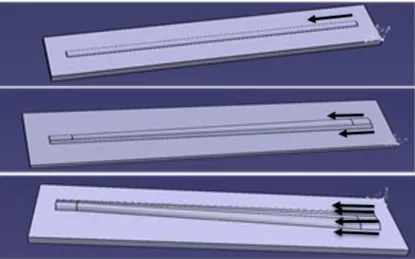
one-way deposition pattern is used (Fig. 10).
Fig. 8. Mapping for distortion measurement on plate with 180 mm length
34
Fig. 10. Variable overlap beads. a) one bead, b) two beads, c) four beads.
A 2400 W power level was used when depositing the powder material onto substrate and
the 4.4 mm laser spot size is kept constant through the experiments. AISI 420 powder (gr/s)
is delivered through a nozzle onto the plate surface through a concentric nozzle with argon
gas. The nozzle assembly is a part of the laser beam delivery head and is mounted on the
Z-axis, while the work piece stays stationary.
To avoid a potential time of lag between powder hopper and the melt pool, the powder
feeder is turned on 5 s before the deposition starts. Argon gas is also used as carrier and
35
The Experimental Design Parameters
In this research, facility of an industrial partner is used to conduct the experiments. Before
designing the experiments, the static factors for all the experimental runs are specified
(Table 8). Due to the equipment limitations, the focal length, contact tip to work-piece
distance and laser spot size were fixed. The detailed process parameters can be seen in
Table 9.
Table 8. The static parameters used for the experiments.
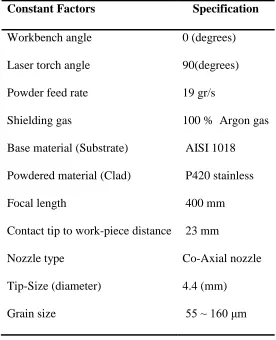
Constant Factors Specification
Workbench angle 0 (degrees)
Laser torch angle 90(degrees)
Powder feed rate 19 gr/s
Shielding gas 100 % Argon gas
Base material (Substrate) AISI 1018
Powdered material (Clad) P420 stainless
Focal length 400 mm
Contact tip to work-piece distance 23 mm
Nozzle type Co-Axial nozzle
Tip-Size (diameter) 4.4 (mm)
![Fig. 2. Different methods of additive layered manufacturing processes [7].](https://thumb-us.123doks.com/thumbv2/123dok_us/1499609.1183603/22.612.208.455.77.323/fig-different-methods-additive-layered-manufacturing-processes.webp)
![Fig. 3. Schematic of the LDMD process [8].](https://thumb-us.123doks.com/thumbv2/123dok_us/1499609.1183603/25.612.123.497.77.390/fig-schematic-ldmd-process.webp)
![Fig. 4. Application of laser cladding process [12-13].](https://thumb-us.123doks.com/thumbv2/123dok_us/1499609.1183603/26.612.131.520.79.308/fig-application-laser-cladding-process.webp)