Comparative Study of Tool-Chip Temperature
and Chip Formed Under Flooded and MQL
Conditions
Shaikh Shoeb
1, Rahul Shelke
2P.G. Student, Department of Mechanical Engineering, Everest Educational Society’s Group of Institutions Aurangabad,
Maharashtra, India
1Associate Professor, Department of Mechanical Engineering, Everest Educational Society’s Group of Institutions
Aurangabad, Maharashtra, India
2ABSTRACT
:
Hard turning is mainly used in industries to increase dimensional
accuracy and surface finish so as to
fulfill functional requirement of the product. In H
ard turning cutting velocity (Vc) is high due to which high amount of
heat is generated at the chip-tool interface which not only increase the
tool wear and deteriorates the job quality but
also has an effect on chips formation as chip formation indirectly indicate the rate of heat transfer under the influenced
of machining environment. Therefore large amount of cutting fluid (flooded lubrication) is used to increase the
performance of hard turning operation due to which it becomes easier to keep tight tolerances but on the other hand use
of cutting fluid has become more problematic in terms of cost, disposal, wastage and environmental pollution.
Minimum quantity lubrication (MQL) is a good alternative to this flooded lubrication. This study compares
performance of MQL with flooded lubrication in turning EN-31 by using Response Surface Methodology (RSM).
ANOVA was used to find out the significant parameters. The results indicated that when range of cutting parameters
(cutting velocity, feed & D.O.C) was low to medium turning with MQL provides some favorable chips but with
increase in Vc MQL totally fails to provide better results both in terms of favorable chips formation and reduction in
chip- tool interface
temperature (θ ) as compared tofloodedlubrication, thereby restricting the application of MQL to a
certain range of parameteronly.
KEYWORDS
: Hard turning, MQL,
chip-tool interface
temperature (θ ), chip formation, RSM
.
I.
INTRODUCTION
Turning is the most widely used machining process in industries. Industries mainly focus on the achievement of high
quality turned parts in terms of surface finish, production rate, less wear on the cutting tools , economy in machining
based on cutting fluids and favorable chip formation (chip shape, color and thickness) as it indirectly indicate the nature
of chip-tool interaction which is helpful for determining the sources of increase in temperature, Hard turning is mainly
used to increase surface finish and productionratebutinhardturninglargeamountofheatis generated at the
chip-tool
high velocity on the cutting zone through the nozzle. The Manner of lubricant supply is as important as total amount of
lubricant supplied. That means the amount which actually reaches in the chip-tool interface as maximum heat is
generated at chip –toolinterface.
II.
L
ITERATURER
EVIEWPrianka B. Zaman and N. R. Dhar [1] studied the effects of MQL on different machinability characteristics (cutting temperature, chip thickness ratio, tool wear and machined surface quality) of hard turned parts by using different cutting fluids as compared to complete dry machining. The thickness of the chips was repeatedly measured by a slide caliper. The results indicated that the use of MQL with VG 68 cutting oil performed better in comparison to other cutting fluids and dry environment in respect of chips thickness ratio, cutting temperature, tool wear, surface roughness and dimensionaldeviation.
Khan and Dhar [2] investigated the role of MQL (Air: 7 bar; Flow rate: 60ml/h through external nozzle) using vegetableoil(food-grade,Viscosity:84centipoiseat20°C)ascomparedtodrymachininginturningAISI-1060 steel having hardness 245BHN at industrial speed-feed combinations. Results include significant reduction in tool wear rate, surface roughness by MQL mainly through reduction in the cutting zone temperature.
Panda.A et al. [3] has done study on hard turning of EN 31 steel (55HRC) under varying process parameters such as cutting speed, feed and depth of cut with respect to surface roughness using TiN/TiCN/Al2O3 multilayer coated carbide inserts through Taguchi L16 orthogonal array design by investigating Ra under dry environment. Machining time was fixed as 3 minute for each run. The surface quality appered better with increase in cutting velocity and with low feed rate, where as an increase in feed deteriorated surafce finish noted as detrimental factor from ANOVAstudy.
Prasanna P Kulkarni et al. [4] has performed experiments to determine the effect of cutting fluids and cutting parameters on chip formation mode and cycle time in turning of EN-24 and EN-31 material under dry & flooded condition. Based on the results of experimental investigation in wet condition Chip thickness is decreased at 210rpm to 450 rpm range as compared to dry with bright color (Golden color and light blue color) with smooth surface due to reduction in temperature for both materials.
III.
EXPERIMENTALCONDITIONANDPROCEDUREExperiments were carried out by plain turning of 38mm diameter and 75mm long rod of EN-31steel using a powerful and rigid semi-automatic geared lathe (Pioneer 250-PL, Rajkot, India) and new cutting edge for each run at different cutting velocities(Vc) and feedrates(So)andD.o.C (t) combination each at three different levels using Response Surface Methodology to study the effect of cutting parameters on chip-tool interface temperature and favorable chip formation under flooded and MQL conditions. The experimental condition is given in table.1 and output response with DOE is given in table.2. External MQL set up was designed in such a way that a mist is produced having a flow rate of 480 ml/hr. at a pressure of 4 bar impinged at cutting zone so that the aerosol or mist (air + coolant) reaches as close to the chip-tool and the work-tool interfaces as possible. The photographic view of the MQL set-up is shown in Fig.1.a,b.
Particulars Description
Material EN31(C:1.02 Si:0.26 Mg:0.42 Cr:1.25Ni:0.14 Mo:0.025 S:0.022 P: Cutting Tool & tool
geometry
(Coated carbide insert SNMG 120404) Tool Holder PSBNR 2525M 12, Tool geometry -6°,-6°,6°,15°,75°,0.4 mm
Input parameters (Vc_59.69, 92.519, 143.256 m/min,So _ 0.1,0.15,0.23 mm/rev and t _0.5, 0.8, 1.0 mm) MQL Parameters Supply pressure ( 4 bar ), flow rate 480 ml/hr , aerosol jet velocity 75.26mm/s
,nozzledia 1.5mm , nozzle distance 15 mm above chip tool interface ,nozzle
position vertically downward
Environment ( Flooded - water to oil ratio 1: 10 and for MQL 1: 5) cutting fluid- water soluble
Table: 1 Experimental Condition
will flow vertically downward (passing from inner pipe ) up to coolant pipe, at the end of coolant pipe the inner pipe is
extended and nozzle is attached so as to increase the velocity and then compressed air is blown (passing from outer
pipe) up to coolant pipe at the end compressed air will transmits its energy to the coolant/liquid jet and the jet will break
into mist or aerosol ( air + coolant).This aerosol is then supplied at the cutting zone.
Exp. Run Vc (m/min) So (mm/rev) t (mm) θ if
(ₒC )
θ im
(ₒC )
1 59.69 0.1 0.5 39.9 53.2
2 143.256 0.1 0.5 85.2 122.6
3 59.69 0.23 0.5 51.3 64.5
4 143.256 0.23 0.5 95.5 135.2
5 59.69 0.1 1.0 50.2 88.7
6 143.256 0.1 1.0 90.7 158.8
7 59.69 0.23 1.0 60.4 98.2
8 143.256 0.23 1.0 106.3 170.3
9 59.69 0.15 0.8 49.8 79.4
10 143.256 0.15 0.8 95.8 149.5
11 92.519 0.1 0.8 65.5 98.6
12 92.519 0.23 0.8 75.6 110.7
13 92.519 0.15 0.5 63.7 81.4
14 92.519 0.15 1.0 71.5 116.3
15 92.519 0.15 0.8 68.4 102.5
16 92.519 0.15 0.8 68.6 102.7
17 92.519 0.15 0.8 68.8 102.9
18 92.519 0.15 0.8 64.5 101.8
19 92.519 0.15 0.8 64.8 102.1
20 92.519 0.15 0.8 64.7 103.2
Table 2: Design of Experiments with Observed Response i.e. machining time (Tm) & Avg Chip-tool interface temperature (θ ) under flooded and MQL Conditions
IV.
S
TUDY OF CHIP FORMATION(
CHIP SHAPE,
SIZE AND COLOR)
UNDERF
LOODED ANDMQL
SYSTEMRun No
Flood ed
MQL Ru n No
Floode d
MQ L
1
Silver grey segmented
or half turn Golden continuous spiral
6
Brown Tangled ribbon
shape Blue Tangled ribbon shape
4
Light Silverblue Lo ng tubular
Silver Bluish continuous helical
7
Dark Blue short tubular
Dark Blue Black segmented or halfturn
5
Golden spiral continuous Brown Silver Discontinuous
12
Silver Blue continuous Dark Blue discontinuous
7
Dark Blue short tubular
Dark Blue Black segmented or halfturn
Table: 3 Images of chips formed under different cutting environments
99
Residual Plots for θi
Normal Probabilit y Plot
3.0
Versus Fits
90 1.5
50 0.0
10
1
-1.5
-3.0
-4 -2 0
Residual
2 4 40 60 80
FittedValue
100
Hist ogram Versus Order
3.0 8 1.5 6 0.0 4 2 0 -1.5 -3.0
-3 -2 -1 0 1
Residual
2 3 2 4 6 8 10 12 14 16 18 20
Observation Order
cases they are not favorable but at some runs favorable chips were obtained.
i.e. at low to medium cutting speed and feed range bright color chips were obtained.
V.
RESULTANDDISCUSSIONThe Analysis of variance (ANOVA) is a necessary test which is performed in most of the optimization process due to its accuracy in prediction of P-values. If the p-value is lower than 0.05 then the factor issignificant.
5.1
Adequacy and ANOVA of the Model for θ :
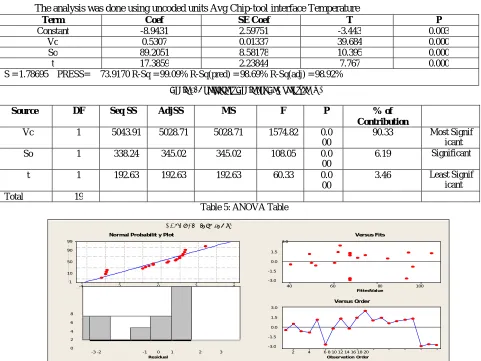
The analysis was done using uncoded units Avg Chip-tool interface Temperature
Term Coef SE Coef T P
Constant -8.9431 2.59751 -3.443 0.003
Vc 0.5307 0.01337 39.684 0.000
So 89.2051 8.58178 10.395 0.000
t 17.3859 2.23844 7.767 0.000
S = 1.78695 PRESS= 73.9170 R-Sq = 99.09% R-Sq(pred) = 98.69% R-Sq(adj) = 98.92%
Table 4: Coefficient Table for Temperature (θ )
Source DF Seq SS AdjSS MS F P % of Contribution
Vc 1 5043.91 5028.71 5028.71 1574.82 0.0 00
90.33 Most Signif icant So 1 338.24 345.02 345.02 108.05 0.0
00
6.19 Significant
t 1 192.63 192.63 192.63 60.33 0.0 00
3.46 Least Signif icant Total 19
Table 5: ANOVA Table
Graph 1: Residual Plot for Avg Chip-tool interface Temperature (θ )ifunder flooded condition.
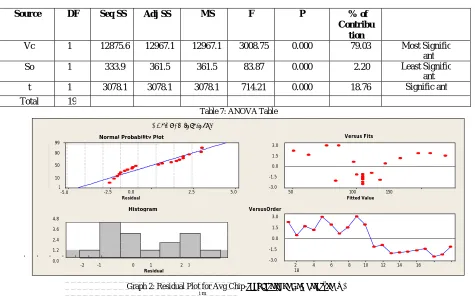
5.2Adequacy and ANOVA of the Model forθi
The analysis was done using uncoded units Avg Chip-tool interface temperature (θi m) 0.8523Vc + 91.3077 So +
69.4982 t
Term Coef SE Coef T P
Constant 43.7777 3.01768 -14.507 0.000
Vc 0.8523 0.01554 54.852 0.000
So 91.3077 9.96994 9.158 0.000
t 69.4982 2.60053 26.725 0.000
ResidualPlotsforθi
Normal Probability Plot Versus Fits
99 3.0
90 1.5
50 0.0
10 -1.5
1 -5.0
-3.0
-2.5 0.0
Residual
2.5 5.0 50 100 150
Fitted Value
Histogram VersusOrder
4.8 3.0
3.6 1.5
2.4 0.0
1.2 -1.5
0.0 -3.0
-2 -1 0 1 2 3 Residual
2 4 6 8 10 12 14 16 18
Table 6: Coefficient Table for for Temperature (θ)
Source DF Seq SS Adj SS MS F P % of Contribu
tion
Vc 1 12875.6 12967.1 12967.1 3008.75 0.000 79.03 Most Signific ant So 1 333.9 361.5 361.5 83.87 0.000 2.20 Least Signific
ant t 1 3078.1 3078.1 3078.1 714.21 0.000 18.76 Signific ant
Total 19
Table 7: ANOVA Table
Graph 2: Residual Plot for Avg Chip-tool interface Temperature (θ ) i m
V
IC
OMPARATIVES
TUDY OFF
LOODED ANDMQL
IN TERMS OF CHIP-
TOOL INTERFACE TEMPERATUREGraph 3: chip-tool interface temperature (θ ) flooded vs. MQLGraph 4: Response Surface Plot of Chip-tool interface Temp vs. Vc
AS SHOWN IN GRAPH IT IS CLEAR THAT WITH DECREASE IN MACHINING TIME (TM DECREASES MAINLY WITH INCREASE IN CUTTING VELOCITY AND
Fig.2: Measurement of temperature using K- type infrared thermometer
VII OPTIMIZED RESULTS
The process optimization was done using RSM’s D- Optimal Test. The optimized value of input parameters for the
response is shown in the table below
Input parameters Optimized value for
Flooded
Predicted response for flooded
Optimized value for
MQL
Predicted response for MQL
Vc (m/min)
137.2373 θ =
i 80.18 °C Tm=0.449
Min
89.2335 θ =
i 76.79°C Tm=0.737
Min.
So (mm/rev)
0.10
0.1070
t (mm)
0.5
0.5
Table 8: Optimized results
VIII CONCLUSION
From the analysis of chip-tool interface temperature and chip formation in flooded and MQL system the following
conclusions can be drawn:
1.)
By using MQL system very large amount of coolant can be saved also at some runs ( when cutting velocity &
feed was low to medium) the performance of MQL was near to flooded in terms of chip formation but with
increase in cutting velocity,thecolor of chips surface appeared darker then that appeared under flooded
lubrication.This indicates that the amount of reduction of temperature in case of flooded enabled favorable chip–
tool interaction, where as chips formed under application of MQL shows that in most of the cases they are not
favourable.
2.)
MQL totally fails to provide better results in terms of reduction in
chip-tool interface
temperature (θ
i)as
compared to flooded lubrication, there by restricting the applicationofMQLtoacertainrangeofparameteronly
i.e. optimized value for MQL found was medium cutting velocity (89.2335 m/min) , Low feed (0.1070 mm/rev)
and low D.o.C ( 0.5 mm) where as flooded lubrication permitting use of high cutting velocity which is required
for hard turning i.e. optimized value for flooded found was high cutting velocity (137.2373 m/min) , Low feed
(0.10 mm/rev) and low D.o.C ( 0.5 mm).
3.)
It is clear that flooded lubrication system performance was better as compared to MQL in most of the
ACKNOWLEDGMENT
I am very much thankful to our Principal Dr.D.K. Gupta Sir and our workshop superintendent of Mechanical Engg.
Dept, N. S. Kalyankar ,Everest Educational Society’s Group of Institutions, Aurangabadfor providing necessary
facilities required for manufacturing of MQL set up.
REFERENCES
[1] Dhar, N.R and Khan, M. M. A. (2006), “A study of effects of MQL on temperature, force, tool wear and product quality in turning AISI 9310 steel” Net Fieldwise Seminar on Manufacturing and Material Processing, issue(2), 2006.
[2] Thamizhmanii, S., and Hasan, R. S. (2009), “A study of minimum quantity lubrication on Inconel 718 steel”, Archives of Material Science and Engineering, Volume 39, Pages 38-44, September2009.
[3] Abhang, L B., Hameedullah, M. (2010), “Experimental Investigation of Minimum Quantity lubricants in Alloy Steel Turning”, International Journal of Engineering Science and Technology, Volume 2(7), Pages 3055 – 3053,2010.
[4] Chaudhary, S. M. A., Dhar, N. R. and Bepari, M. M. A. (2007) “Effect of Minimum Quantity Lubricant on Temperature Chip and Cutting Force in Turning Medium Carbon Steel, International Conference on Mechanical Engineering, ICME (2007), December 2007.
[5] Young Kug Hwang and Choon Man Lee ‘’Surface roughness and cutting force prediction in MQL and wet turning process of AISI 1045 using design of experiments ‘’Journal of Mechanical Science and Technology .2006
[6] Prianka B. Zaman1 and N. R. Dhar ‘’Effects of Minimum Quantity Lubrication (MQL) by DifferentCutting Fluids on the Cutting Performance of Hardened Steel’’ RAMTM-2010, February, 19-20, 2010Production Engineering Department, Jadavpur University, Kolkata – 32.
[7] ].Panda, Dutta, and S.K Sahoo, (2014), “Experimental investigation on surface roughness characteristics in hard turning of EN31 steel using coated carbide insert: Taguchi and mathematical modeling approach” School of Mechanical Engineering, KIIT University, Bhubaneswar-751024, Odisha, India.