2351-9789 © 2017 The Authors. Published by Elsevier B.V. This is an open access article under the CC BY-NC-ND license (http://creativecommons.org/licenses/by-nc-nd/4.0/).
Peer-review under responsibility of the scientific committee of the 27th International Conference on Flexible Automation and Intelligent Manufacturing doi: 10.1016/j.promfg.2017.07.364
Procedia Manufacturing 11 ( 2017 ) 2178 – 2186
ScienceDirect
27th International Conference on Flexible Automation and Intelligent Manufacturing, FAIM2017,
27-30 June 2017, Modena, Italy
Reliability assessment of a packaging automatic machine by
accelerated life testing approach
Alberto Regattieri
a*, Francesco Piana
a, Mauro Gamberi
a, Francesco Gabriele Galizia
b,
Andrea Casto
aaDepartment of Industrial Engineering, University of Bologna, v.le Risorgimento 2, Bologna, 40136, Italy
bDepartment of Management and Engineering, University of Padua, stradella San Nicola 3, 36100 Vicenza, Italy
Abstract
Industrial competitiveness in innovation, the time of the market introduction of new machines and the level of reliability requested implies that the strategies for the development of products must be more and more efficient. In particular, researchers and practitioners are looking for methods to evaluate the reliability, as cheap as possible, knowing that systems are more and more reliable. This paper presents a reliability assessment procedure applied to a mechanical component of an automatic machine for packaging using the accelerated test approach. The general log-linear (GLL) model is combined based on a relationship between a number strains, in particular mechanical and time based. The complete Accelerated Life Testing - ALT approach is presented by using Weibull distribution and Maximum Likelihood verifying method. A test plan is proposed to estimate the unknown parameters of accelerated life models. Using the proposed ALT model, the reliability function of the component is evaluated and then compared with data from the field collected by customers referring to 8 years of real work on a fleet of automatic packaging machines.
The results confirm that the assessment method through ALT is effective for lifetime prediction with shorter test times, and for the same reason it can improve the design process of automatic packaging machines.
© 2017 The Authors. Published by Elsevier B.V.
Peer-review under responsibility of the scientific committee of the 27th International Conference on Flexible Automation and Intelligent Manufacturing.
Keywords: Accelerated life Testing (ALT), reliability, failure mechanism, lever, General Log-Linear (GLL) Life-Stress model, Weibull Life
Distribution
* Corresponding author. Tel.: +390512093400; fax: +390512093411
E-mail address: [email protected]
© 2017 The Authors. Published by Elsevier B.V. This is an open access article under the CC BY-NC-ND license (http://creativecommons.org/licenses/by-nc-nd/4.0/).
Peer-review under responsibility of the scientific committee of the 27th International Conference on Flexible Automation and Intelligent Manufacturing
1.Introduction
Harsher industrial competitiveness in innovation, shorter time of development and higher machines reliability, implies that strategies for products maturation must be always increasingly efficient. In particular, researchers, engineers and manufacturing companies are always looking for innovative methods to evaluate components and systems reliability, from the conception until to after-sales. In last years in the B2B market, companies are looking for higher efficiency levels and lesser assets total cost of ownership, instead of the old approach based on the “buy and maintain” concept. The large diffusion of Total Production Maintenance (TPM) approach reinforces this statement [4]. In this context, the ex-ante evaluation of the efficiency (and then the lifetime duration esteem of components) is a crucial issue for companies.
The lifetime knowledge of components or a complex system is fundamental both for consumers and manufacturers. Manufacturers can evaluate ex-ante the efficiency of their products (i.e. machines and equipment), provide effective maintenance policies to maintain the targeted efficiency levels and also design the after-sales maintenance policies and network [7, 10]. Core of Accelerated Life Testing (ALT) analysis is identification of the working-load stress levels of a system (or sub-system or component) and then the increase levels of stresses to use during the analyses [1]. In fact, during these tests, the system is stress with higher levels of loads or different environmental factors in order to accelerate the failure mechanisms, which must represent the normal conditions. Accelerated conditions allow to reduce the testing time and so estimate behavioral characteristics of the product in normal conditions [5]. After different high stress levels tests, life data are extrapolated to estimate the life distribution at the use condition by employing an appropriate acceleration model. To minimize the statistical error of extrapolation, reliability experts have developed numerous accelerated life test plans [12], nowadays implemented with specific models. Main goal of the ALT applications is to build a model of the real behavior of the components under analysis to obtain reliability prediction in a shorter time. Difficult of the analysis is to be able to extrapolate life duration at standard stress conditions from the accelerated test lifetime. During years, researchers proposed many different approaches both for the accelerate tests design and for the following statistical analysis of the data obtained, [3,5,8]. From a statistical point of view, the prediction of the reliability of a component deals with the determination of the distribution assumed by its time to failure variable [5]. Three most used and well-known distributions are the Weibull, the Exponential and the Log-normal distribution. The most frequently applied is the Weibull distribution [2,4,14]. Weibull distribution, applied to the random variable called x, is based on the pdf function
where α is the scale parameter and β is the shape parameter. Weibull Distribution is used to supporting ALT analysis by Jung et al. [6] for crankshafts reliability prediction and by Charruau, et al. [3] for reliability prediction of electronic boards in the aeronautic field. In both cases, the unknown parameters, α and β, was estimated by the application of the Maximum Likelihood Method (ML), which is a Point Estimator. ML is an effective, well known and used method. It consists in maximizing the likelihood function, that is, the probability of observing the realization of a given sample, conditioned by the values of estimation parameters. Voiculescu et al. [11] compare the Maximum Likelihood method with Bayesian method, usually used in case of small numbers of data to save costs and time.
Core of the ALT analysis is identification of the relation between failure times in stressed conditions, obtained during experimental tests, and the estimation of the failure times in work use condition. In literature, there are different approaches, based on mathematical models, usually called life-stress relationship. One of the most frequently applied, in real case studies, is Arrhenius life-stress relationship. This model is interesting particularly when the performance of component depends from thermo-physical and chemical conditions. Acevedo et al. [1] apply Arrhenius model in ALT analyses on the RF power amplifiers. Another common used life-stress relationship is the Inverse Power Law. Is used with vibrations or mechanical stresses, it does not work with thermal stresses. It is applied particularly to spindles, bearings, capacitors and many other mechanical and electronic components. Zhao and Elsayed [15] use this model to evaluate LED reliability. Zhang et al. [13] used a modified inverse power law model in the study of tapered roller bearings. In this case study, authors choose salt water as bearings main stress contamination. They compared life-stress relationship with the generalized-eyring-model, a different version of the eyring-model.
The aim of this paper is the presentation of ALT techniques applied at a mechanical component (i.e. lever) of an automatic packaging machine. Furthermore, authors present a comparison between the lifetime estimation by ALT
analysis with lifetime evaluation based on actual data, obtained from working field after 8 years of data collection. In the packaging machine manufacturing sector, design process is based on a try-and-error method resulting inefficient, long (production time) and expensive. This paper, by the case study presentation, want to be a confirmation of the usefulness of ALT approaches also in this field: ALT can simplify mechanical design process, solved various shaping problems and reducing time-to-market with better cost-effectiveness.
2.Body
ALT model includes several main steps, and usually are planning as follow:
• Identification of the main failure mode of a component/system: stress/stress type/types and level, involved in actual working operation;
• Definition increased levels of stress to obtain “accelerated time to failure” during laboratory experiments;
• Design of testing machine to generate increased levels of determined stresses; • Experimental run-tests campaign with different increased stress levels;
• Data investigation and modeling using life-stress relations and time-to-failure distributions.
In this case study, authors work with an important Italian company of extrusion plastic products. Researchers, customer and the machines suppliers worked together for several months on an experimental maintenance project focused on ALT tests. During this study, the team noticed as some failures were more important than other on reliability and availability of the whole machine. One of that failure was a break lever: this lever extracts plastic products formed in a die by a molder The failure of this component creates a big problem that affects the analyzed machine. Materials using in machine during the production is high-density polyethylene (HDPE). The lever is made by heat-treated steel 39NiCrMo3 and it is obtained by a casting process. Is the most important component in the extraction chain system of an automatic packaging machine. Lifetime of this component was relevant: not only for the efficiency of the entire production line, but because lever has also a big impact on the machine maintenance costs and consequently these costs affected the final-product cost.
Leverage failure is a break. Figure 1 shows the typical expected failure of the lever.
Fig. 1 -Typical expected failure of the lever
The main purpose of this analysis is understood factors cause levers failure in a controlled environment and in a shorter time than actual working conditions. Results from these tests are successively used for evaluate reliability functions.
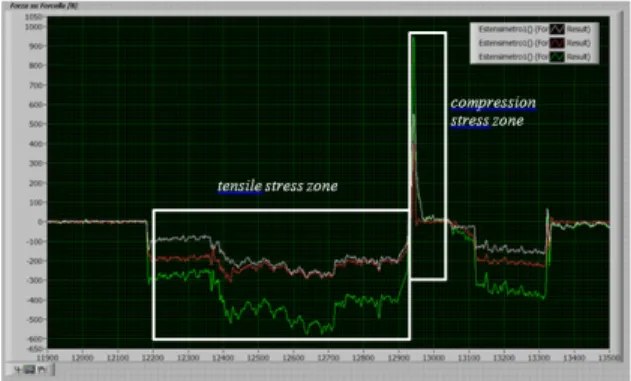
In this experiment levers were tested, at the same time with compression and tensile stresses. On both sections of break area, to measure forces applied during all the phases of working operations, were glued strain gauges. Furthermore, a linear displacement transducer was mounted on the outer face of the lever to study the relation between lever position and its mechanicals load during all lever working. A wireless technology Telemetry System was used for data transmission. Wireless was preferred due to the continuous rotation of the lever around machine axes. In particular, is used a wireless CompactDAQ system by National Instruments ® supported by software Measurement & Automation by National Instruments®.
Figure 2 shows results of the analysis forces effect during the component working cycle. Green line represents the total stresses, white one is the force acting over the outer section and the red is the force acting over the inner section of the lever.
Fig. 2 -Experimental evidence of level of stress in normal working condition
Table below shows the normal lever working condition, both for tensile stress and compression (table 1). This results are outputs of the first step of ALT analysis.
Table 1. Levels of lever stress in normal use conditions
Stress Stress level
Tensile stress 420 N
Compression stress 875 N
These forces result the major stress affecting the lever lifetime and reliability. The number of accelerated parameters considered influence the number of experimental runs and increase the mathematical model complexity. For these reasons Authors decide to use two stress parameters, tensile and compression forces. The values of stressed levels are presented in table 2.
Table 2. Lever stress levels for accelerated tests
Stress Acceleratelevels of stress
Tensile stress range [2, 4, 6, 8, 10 kN]
Compression stress range [2, 4, 6, 8, 10 kN]
Authors develop a complex tester to investigate the effect of tensile and compression strains on the lever. The machine, built in the laboratory of the Department of Industrial Engineering at Bologna University, can reproduces different accelerated work conditions. ALT running tests were conducted on one lever at time. Samples came from the same supplier batch production and, before the start of each test, were geometrically verified.
During tests, all samples were broken under different stress levels. As shown in table below all stress levels are used at least 2 times. Table 3 presents time to failure, expressed in cycles, and corresponding stress level adopted in each run.
Table 3. Results of experimental tests under different accelerated conditions Tensile stress (kN) Compression stress (kN) Life duration (cycles) Tensile stress (kN) Compression stress (kN) Life duration (cycles) 2 2 30.896.502 6 6 7.235.707 2 2 31.205.465 6 8 1.454.668 2 4 12.506.498 6 8 1.571.041 2 4 13.882.212 6 10 442.681 2 6 5.751.814 6 10 495.802 2 6 5.924.368 8 2 2.884.011 2 8 2.579.098 8 2 3.057.051 2 8 2.914.380 8 4 1.270.302 2 10 1.250.042 8 4 1.448.144 2 10 1.387.546 8 6 1.262.198 4 2 10.795.541 8 6 1.350.551 4 2 11.659.184 8 8 990.714 4 4 6.845.854 8 8 1.109.599 4 4 7.119.688 8 10 310.991 4 6 3.510.045 8 10 354.529 4 6 3.931.250 10 2 998.818 4 8 1.373.628 10 2 1.048.758 4 8 1.401.100 10 4 574.371 4 10 665.541 10 4 580.114 4 10 712.128 10 6 404.187 6 2 6.659.462 10 6 452.689 6 2 7.325.408 10 8 292.757 6 4 8.908.322 10 8 330.815 6 4 9.264.654 10 10 134.546 6 6 6.518.655 10 10 151.950 2.1.Lifetime prediction
Lever lifetime is predicted considering different life-stress relationship applied to failure times shown in table 3. The life-stress relationship that fit better with experimental data, evaluated using ML function, is the General Log-Linear (GLL) in combination with Weibull distribution time to failures.
ALT experiment involves multiple accelerating stresses, needs a general multivariable relationship. GLL relationship describes life characteristic as a function of a n-stress vector, called X = ( .
For the lever analysis authors used two stress vectors, for tensile and compression. Relationship is given by
where:
and model parameters;
n-stress vector
GLL-Weibull model is obtained setting η = L(X) in Weibull model, using the following GLL-Weibull probability density function:
(1)
The total number of variables to find for solving this model are n+2. As said before, n =2 because considering tensile and compression stress. For this study were 4 (i.e. 2+2) parameters to set. Maximum likelihood estimator is used to determine the parameters for the GLL relationship and the chosen life distribution. LK function can obtained for each distribution. Model parameters, life distribution and GLL parameters are obtained maximizing log-likelihood function.
The log-likelihood function for Weibull distribution is given by:
(2) where: and: groups of times-to-failure;
the number of times-to-failure in the time-to-failure group; λ failure rate parameter (variable);
the failure time of the group;
S groups of censored time;
the number of censored times in the censored times group;
running time of the censored data group; FI the number of data group intervals;
the number of intervals in the group of data intervals; the first point of the interval;
finish point of the interval.
The lever LK value of GLL-Weibull model, given as explained above, is -764,82.
The best fit values of parameters are β=1,8821140, α0=18,513792, α1=-0,000303438, α2=-0,000329348
Using the GLL-Weibull model with above parameters, the lever Mean Life evaluated by ALT is Mean Time To Failure (MTTF)=64,294 · cycles. Figure below presents plotted Weibull probability using evaluated model
Figure 3 – Probability Weibull plot (ALTAPro - Reliasoft©)
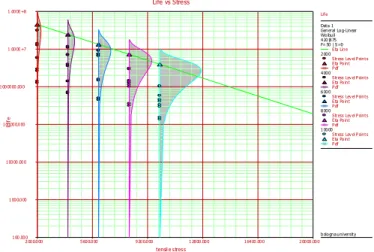
As shows in the figure, data linearity and trends parallelism, reinforce the assumption to use a one-shape-parameter Weibull distribution. Another interesting investigation in this step is the comparison between stressed tests lifetime with actual work conditions. With this analysis is possible to analyze the effect of each stresses separately. Figure 4 shows the effect of the variation of tensile stress on the component lifetime.
Figure 4 – Plotted Weibull Probability (ALTAPro - Reliasoft©) 2.2.Discussion and comparison with data from field
The proposed model is supported and validated by a wide time to failure data collection. Data was collected during about 8 years of work on a wide automatic machines fleet, assembled with the same lever type. On the lever, a wide set of real failures and censored-data are available. Data came from an analysis of historical database of the machine supplier, collecting failure information, especially data about this lever. Database contains both failures and censored data coming from different machines working around the world, but with the same raw plastic materials. This study represents an uncommon case, because is possible compare the component life estimation by the ALT approach with the MTTF evaluate by real failure data, collected during years of work. In the last years literature focus its attention merely to the improvement of ALT approach, on model, mathematical methods, parameters estimation, etc. The comparison between ALT models and real-field-data is the key of this study because usually are analysis studied separately [16]. Usually is not possible have a huge database with real time-to-failure of the
Probability - Weibull Time U n re lia b ilit y 100000.000 1000000.000 1.000E+7 1.000E+8 10.000 50.000 90.000 99.000 Proba bility Data 1 General Log-Linear We ibull 2000|2000 F= 2 | S= 0
Stress Lev el Points Stress Lev el L ine 2000|4000 F= 2 | S= 0
Stress Lev el Points Stress Lev el L ine 2000|6000 F= 2 | S= 0
Stress Lev el Points Stress Lev el L ine 2000|8000 F= 2 | S= 0
Stress Lev el Points Stress Lev el L ine 2000|10000 F= 2 | S= 0
Stress Lev el Points Stress Lev el L ine 4000|2000 F= 2 | S= 0
Stress Lev el Points Stress Lev el L ine 4000|4000 F= 2 | S= 0
Stress Lev el Points Stress Lev el L ine 4000|6000 F= 2 | S= 0
Stress Lev el Points Stress Lev el L ine 4000|8000 F= 2 | S= 0
Stress Lev el Points Stress Lev el L ine 4000|10000 F= 2 | S= 0
Stress Lev el Points Stress Lev el L ine 6000|2000 Life vs Stress tensil e stress Li fe 2000.000 5600.000 9200.000 12800.000 16400.000 20000.000 100.000 1.000E+8 1000.000 10000.000 100000.000 1000000.000 1.000E+7 Life Data 1 General Log-Linear We ibull 420|875 F= 50 | S=0 Eta Line 2000
Stress Lev el Points Eta Point Pdf 4000
Stress Lev el Points Eta Point Pdf 6000
Stress Lev el Points Eta Point Pdf 8000
Stress Lev el Points Eta Point Pdf 10000
Stress Lev el Points Eta Point Pdf
components from the working field, because this collection requires long time and a complete and expensive data acquisition system. Furthermore, ALT analysis validation with real time-to-failure data, assumes a high relevance because in the last years packaging machine sector is become interested in to these approaches.
Table 3 shows the actual collected failure lifetimes and censored lifetimes. The study is based on 211 lifetime data, gathered in classes in the table below.
Table 4 – Actual failure and censored (+) data from working field
Failed or Censored Time to failure (working cycles106) Number of data Failed or Censored Time to failure (working cycles106) Number of data F 0 –15 6 C 75,6+ 13 F 15 –30 10 C 64,8+ 10 F 30 –45 63 C 54,0+ 3 F 45 –60 36 C 43,2+ 12 F 60 –75 20 C 32,4+ 14 F 75–90 14 C 21,6+ 5 C 10,8+ 5
Applying the Regression Method (RM) and Media Ranks Ranking Method (MRRM) [15] is possible to evaluate lever reliability. Using actual lifetimes failure and censored lifetimes, the lever mean time to failure is MTTF = 62,8791*106 cycles. The corresponding Weibull distribution has β= 2,0832, Θ=70,9899*106and the fitting index ρ is about 0,9724.
Results of the comparison are very promising because the difference, between evaluated theoretical lifetime estimation (MTTF) by ALT approach and MTTF calculated by the best Weibull distribution on real wide dataset, is just 2,2%. So, this analysis result is so interesting for a company maintenance purpose, because can generate trustworthy results with less time and without waiting component failures in normal work conditions. In particular, for this case-study 4 months of ALT analysis, generate results comparable with 8 years of field data collection.
3.Conclusions
In the modern industrial context, assets efficiency is a huge issue both for manufacturers, and end-users. For this purpose known components and systems reliability is a fundamental topic. The reliability evaluation is normally based on data collection from field during assets daily working [11,12,13]. Data collection, if not automated by complex hw/sw systems, is a laborious activity due to very long period required. Furthermore, these analyses are almost impossible on new components. Accelerated Life Testing (ALT) is a method to evaluate components and systems reliability in a short-term period, usually weeks or some months, using overstressed testing strategy. In this paper is discuss a case study on packaging automatic machine sector. Authors developed and accomplish a set of experimental tests under overstressed conditions on over 50 samples using different stress levels.
Results from ALT modeling based on a GLL relationship with Weibull distribution, are then compared with a Weibull modeling based on actual lifetime data coming from 8 years of time-to-failure data collection from field. The comparison of two model makes interesting this case study, because put together theoretical and pragmatic analyses. Indeed, ALT model and actual data model are in accordance: the difference between the two Mean Time to Failure estimations is just 2,2%.
For further studies, there are some interesting integrations of the proposed ALT approach as Condition Based Monitoring (CBM) and FEM analyses. With CBM researchers try to bring forward failures, by monitoring different parameters (e.g. temperature, vibrations, etc.) of components. CBM applied during ALT tests could support effectively this analysis. FEM analyses should give useful information just during the design stage of the component. So these analyses should be complementary with ALT studies on a component.
References
[1] Acevedo, P. E., Jackson, D. S., Kotlowitz, R. W. (2006). Reliability growth and forecasting for critical hardware through accelerated life testing. Bell Labs Technical Journal, 11(3), 121-135.
[2] Alsina, E. F., Cabri, G., Regattieri, A. (2016). A Neural Network Approach to Find The Cumulative Failure Distribution: Modeling and Experimental Evidence. Quality and Reliability Engineering International, 32(2), 567-579.
[3] Charruau, S., Guerin, F., Dominguez, J. H., Berthon, J. (2006). Reliability estimation of aeronautic component by accelerated tests. Microelectronics reliability, 46(9-11), 1451-1457.
[4] Cui, H. (2005, January). Accelerated temperature cycle test and Coffin-Manson model for electronic packaging. In Reliability and Maintainability Symposium, 2005. Proceedings. Annual (pp. 556-560). IEEE.
Magazine, 14(6), 350-358.
[5] Jayatilleka S., Okogbaa G. "Use of accelerated life tests on transmission belts for predicting product life, identifying better designs, materials and suppliers." Reliability and Maintainability Symposium, 2003. Annual. IEEE, 2003.
[6] Jung, D. H., Kim, H. J., Pyoun, Y. S., Gafurov, A., Choi, G. C., Ahn, J. M. (2009). Reliability prediction of the fatigue life of a crankshaft. Journal of mechanical science and technology, 23(4), 1071-1074.
[7] Manzini, R., Gamberi, M., Regattieri, A. (2006). Applying mixed integer programming to the design of a distribution logistic network. International Journal of Industrial Engineering: Theory, Applications and Practice, 13(2), 207-218.
[8] Nelson, W. B. (2009). Accelerated testing: statistical models, test plans, and data analysis (Vol. 344). John Wiley & Sons.
[9] Regattieri, A., Manzini, R., Battini, D. (2010). Estimating reliability characteristics in the presence of censored data: A case study in a light commercial vehicle manufacturing system. Reliability Engineering & System Safety, 95(10), 1093-1102.
[10] Regattieri, A., Giazzi, A., Gamberi, M., Gamberini, R. (2015). An innovative method to optimize the maintenance policies in an aircraft: General framework and case study. Journal of air transport management, 44, 8-20.
[11] Voiculescu, S., Guerin, F., Barreau, M., Charki, A. (2009). Bayesian estimation in accelerated life testing. International Journal of Product Development, 7(3-4), 246-260.
[12] Yang, G., Zaghati, Z. (2006). Accelerated life tests at higher usage rates: a case study. In Reliability and Maintainability Symposium, 2006. RAMS'06. Annual (pp. 313-317). IEEE.
[13] Zhang, C., Chuckpaiwong, I., Liang, S. Y., Seth, B. B. (2002). Mechanical component lifetime estimation based on accelerated life testing with singularity extrapolation. Mechanical Systems and Signal Processing, 16(4), 705-718.
[14] Zhang, J. P., Geng, X. M. (2005). Constant-step stress accelerated life test of VFD under Weibull distribution case. Journal of Zhejiang University, 6(7), 722-727.
[15] Zhao, W., Elsayed, E. A. (2004). An accelerated life testing model involving performance degradation. In Reliability and Maintainability, 2004 Annual Symposium-RAMS (pp. 324-329). IEEE.
[16] Suhr E. (2002). Accelerated life testing (ALT) in microelectronics and photonics: its role, attributes, challenges, pitfalls, and interaction with qualification tests. Journal of Electronic Packaging, 124.3: 281-291