T
HEJ
OINTE
FFECT OFR
ELATIONSHIPP
ERCEPTIONS,
L
OYALTYP
ROGRAM ANDD
IRECTM
AILINGS ONC
USTOMERS
HARED
EVELOPMENTP
ETERC. V
ERHOEFERIM REPORT SERIES RESEARCH IN MANAGEMENT ERIM Report Series reference number ERS-2002-27-MKT Publication February 2002 Number of pages 54
Email address corresponding author [email protected]
Address Erasmus Research Institute of Management (ERIM) Rotterdam School of Management / Faculteit Bedrijfskunde Erasmus Universiteit Rotterdam
P.O. Box 1738
3000 DR Rotterdam, The Netherlands Phone: +31 10 408 1182 Fax: +31 10 408 9640 Email: [email protected] Internet: www.erim.eur.nl
Bibliographic data and classifications of all the ERIM reports are also available on the ERIM website: www.erim.eur.nl
E
RASMUS
R
ESEARCH
I
NSTITUTE OF
M
ANAGEMENT
REPORT SERIES
RESEARCH IN MANAGEMENT
B
IBLIOGRAPHIC DATA AND CLASSIFICATIONSAbstract In this paper, we examine the effect of relationship perceptions and relationship marketing instruments on customer share development. We also study the interaction effect of these instruments with behavioral loyalty and relationship perceptions. This study is executed among a sample of customers of a financial service provider. Our results show that commitment positively affects changes in customer share, while loyalty program membership and direct mailings also have a positive effect. We also find that satisfaction has a smaller effect among members of the loyalty program, while our results also reveal some preliminary evidence to support the notion that loyalty programs are less effective among behavioral loyal customers. 5001-6182 Business 5410-5417.5 Marketing Library of Congress Classification (LCC) HF 5415.55 Relationship marketing
M Business Administration and Business Economics M 31
C 44
Marketing
Statistical Decision Theory Journal of Economic Literature (JEL) M 31 Marketing 85 A Business General 280 G 255 A
Managing the marketing function Decision theory (general) European Business Schools
Library Group (EBSLG)
290 R Direct marketing Gemeenschappelijke Onderwerpsontsluiting (GOO)
85.00 Bedrijfskunde, Organisatiekunde: algemeen 85.40
85.03
Marketing
Methoden en technieken, operations research Classification GOO
85.40 Marketing Bedrijfskunde / Bedrijfseconomie
Marketing / Besliskunde Keywords GOO
Relatiemarketing, Direct mailing
Free keywords Customer Relationship Management, Customer Loyalty, Marketing Research, Marketing Instruments Marketing Models
The Joint Effect of Relationship Perceptions, Loyalty
Program and Direct Mailings on Customer Share
Development
Peter C. Verhoef12
Department of Marketing and Organization, School of Economics
Erasmus Research Institute in Management Erasmus University Rotterdam
1 Peter C. Verhoef is a postdoctoral researcher, Erasmus University Rotterdam, Ther Netherlands.
Corresponding author: Peter C. Verhoef, Erasmus University Rotterdam, Department of Marketing and Organization, School of Economics, Office H15-17, P.O. Box 1738, NL-3000 DR Rotterdam, The Netherlands, Phone +31 10 408 2809, Fax +31 10 408 9169, E-mail: [email protected]
2 The author gratefully acknowledges the financial and data support of a Dutch financial service company. The author thanks Ruth Bolton and Peeter Verlegh for their helpful suggestions. Also the comments of participants of seminars at the University of Groningen, Yale School of Management, Tilburg University and the University of Maryland are acknowledged. He especially thanks Bas Donkers for his help in the estimation part of this paper, Dick Wittink for his useful comments on an earlier version of this manuscript, and his two Ph.D. advisors Philip Hans Franses and Janny Hoekstra for their enduring support.
The Joint Effect of Relationship Perceptions, Loyalty
Program and Direct Mailings on Customer Share
Development
Abstract
In this paper, we examine the effect of relationship perceptions and relationship marketing instruments on customer share development. We also study the interaction effect of these instruments with behavioral loyalty and relationship perceptions. This study is executed among a sample of customers of a financial service provider. Our results show that commitment positively affects changes in customer share, while loyalty program membership and direct mailings also have a positive effect. We also find that satisfaction has a smaller effect among members of the loyalty program, while our results also reveal some preliminary evidence to support the notion that loyalty programs are less effective among behavioral loyal customers.
INTRODUCTION
Nowadays, companies heavily focus on customer relationship development. This is particularly revealed in the huge investments in customer relationship management (Kerstetter, 2001; Winer, 2001). To develop customer relationships companies use relationship marketing instruments, such as loyalty programs and direct mailings (Curtis, 2001; Dowling and Uncles, 1997; Hart, Harris and Tzokas, 1999; Roberts and Berger, 1999). Furthermore, they aim to affect the customers' perceptions of the relationship by providing excellent customer service. In that respect the focus is on creating satisfied and committed customers (Garbarino and Johnson, 1999; Reichheld, 1996).
Since the end of the eighties in the last century academics have recognized the importance of customer relationships (Berry, 1995; Dwyer, Schurr and Oh, 1987; Morgan and Hunt, 1994; Sheth and Parvatiyar, 1995). Research in this area has mainly been executed in the context of marketing channels and business-to-business markets (e.g., Ganesan, 1994). Only recently have researchers started to study customer relationships in consumer markets (e.g., Garbarino and Johnson, 1999; De Wulf, Odekerken-Schröder and Iacobucci, 2001). An important stream within this research has focussed on the empirical testing of the effect of relationship quality perceptions, such as commitment, on behavioral customer loyalty. These studies usually use cross-sectional data with relationship quality perceptions and self-reported measures of customer loyalty, such as purchase intentions and customer share (Garbarino and Johnson, 1999; De Wulf, Odekerken-Schröder and Iacobucci, 2001). Generally these studies show positive associations between the considered perceptions and behavioral loyalty measures. However, methodological problems, such as carry-over and backfire effects, common-method variance and the limited predictive validity of purchase intentions, may lead to an overestimation of the considered
associations (Bickart, 1993). Hence, it remains unclear whether perceptions, such as commitment, really affect behavioral loyalty. In this respect the study of Gruen, Summers and Acito (2000) is interesting, as they report no effect of commitment on actual customer retention rates in the context of professional associations. As such they question the effect of commitment on actual behavior.
Firms use relationship marketing instruments (RMI) to affect customer purchasing behavior within the relationship and customer perceptions of the relationship. In this study we focus on customer behavior. RMI are applied in a number of markets. For example, airline companies are well known for their use of frequent-flyer-programs, while a number of retailers use retail-saving cards (Hart et al., 1999; Winer, 2001). Few studies have considered the effect of these instruments in a relationship context (e.g., Bolton, Kannan and Bramlett, 2000; DeWulf, Odekerken-Schröder and Iacobucci, 2001). Given the increasing use of these instruments in practice, there is a need for studies that elaborate on this issue further. Moreover, although these instruments may be effective for the total customer base, there might be customers for which these instruments are less effective. A common comment on the application of loyalty programs is that these programs reward already loyal customers, suggesting a waste of money. In this article we will particularly pay attention to this issue by considering how both attitudinal loyalty and behavioral loyalty may moderate the effect of RMI.
Our objectives in this paper are twofold. First, we investigate the effect of customers' perceptions of the relationship on behavioral loyalty in business-to-consumer markets. Although this effect has already been studied in the literature, we provide a more robust test by studying actual loyalty instead of self-reported customer loyalty. We use customer share development as our measure of behavioral loyalty. In customer relationship management and the customer
loyalty literature this measure is considered as important (Bowman and Narayandas, 2001; Fournier and Yao, 1997; Peppers and Rogers, 1999). Second, we study the effect of RMI on behavioral customer loyalty. Thereby we not only consider the main effect of RMI, but also consider interactions between perceptions, behavioral loyalty and RMI. The results of this analysis can provide relevant insights for marketing management, as it shows which customers are less sensitive to RMI. We will answer these questions with an empirical study among customers of a financial service provider in a business-to-consumer market. Within this industry, increasing customer share is essential for successful business.
The outline of this article is as follows. We start with a discussion of the literature and our theoretical framework. Next, we continue with a discussion of the research methodology and a description of the empirical results. This article ends with a theoretical discussion, management implications, research limitations and directions for future research.
LITERATURE DISCUSSION
Relationship Perceptions and Behavior
In this article, relationship perceptions concern the perceived value of the relationship, defined as the subjective evaluation of the offerings of the supplier during the relationship (Rust, Zeithaml and Lemon, 2000; Woodruff, 1997) and the perceived quality of the relationship itself. The latter is often measured with commitment (e.g., Anderson and Weitz, 1992). In our operationalization of commitment we focus on the affective component of commitment, which refers to the psychological attachment of one exchange partner to the other and which is based on feelings of loyalty and affiliation (Gundlach, Achrol and Mentzer, 1995; Battacharya, Rao and
Glynn, 1995). In line with Bolton and Lemon (1999) we consider relationship satisfaction and payment equity as two components of the perceived value of the relationship. Satisfaction is defined as the emotional state that occurs in response to an evaluation of interaction experiences over time (Anderson, Fornell and Lehmann, 1994; Crosby, Evans and Cowles, 1990). Payment equity refers to the customers' perceived fairness of the prices paid for their products or services (Bolton and Lemon, 1999).
Prior research in relationship marketing has extensively studied the antecedents and consequences of relationship perceptions (e.g., Tax, Brown and Chandreshekaran, 1996; Morgan and Hunt, 1994). With respect to the consequences of relationship perceptions there have been a number of studies that report on the effect of these perceptions on behavioral customer loyalty. Table 1 provides a brief overview of these studies. Within these studies we distinguish between studies using self-reported loyalty measures and actual observed loyalty measures. Studies with self-reported measures usually use cross-sectional data in which perceptions and the loyalty measures are collected within the same survey. Generally, these studies report positive associations between relationship perceptions and behavioral loyalty. However, due to carry-over and backfire-effects and common-method variance these associations are probably too strong (Bickart, 1993). Only recently have researchers started to study observed behavior within the customer relationship. Due to investments in customer databases observed data on actual customer loyalty are not only available for the management of customer relationships, but also for marketing scientists studying customer relationships. Studies relating perceptions to actual observed behavior can provide a more robust test of the effect of relationship perceptions on customer loyalty. Results of studies with actual behavior as a dependent variable are mixed. The studies of Bolton and colleagues provide evidence that satisfaction affects customer behavior.
However, Verhoef, Franses and Hoektra (2001) show that this effect is not beyond doubt. Moreover, in line with Bolton (1998) they show that this effect is moderated by relationship age.
Commitment has rarely been related to observed customer behavior. Gruen, Summers and Acito (2000) study the association between commitment and customer retention using cross-sectional data, which are aggregated over local chapters of a professional association. In line with research on sales-person retention (MacKenzie, Podaskof and Ahearne, 1998), they find no relationship between commitment and retention. This result contradicts studies using self-reported behavior. Thus, there is a need for studies that further empirically test the effect of commitment on customer behavior.
-- Insert Table 1 --
The overview in Table 1 shows that, while recently a number of studies have investigated observed customer retention, service usage and cross-buying using longitudinal data, studies relating relationship perceptions to observed customer share development are particularly lacking (Bowman and Narayandas, 2001). Customer share or share of category requirements is considered as an important behavioral loyalty measure both in business-to-consumer and business-to-business markets (Hoekstra, Leeflang and Wittink, 1999; Rust, Zeithaml and Lemon, 2000). Peppers and Rogers (1999) argue that firms should aim to maximize customer share. It goes beyond the other behavioral loyalty measures in Table 1, as it also includes the customers' behavior at competing suppliers. Fournier and Yao (1997, p. 453) argue that this measure implicitly presumes that there is 'one unit of attachment' to be divided among all suppliers in the category. Blattberg, Getz and Thomas (2001, p. 69) state that retention is not the same as loyalty
or share of category requirements, because two firms might retain the same customer. The same holds for cross-buying and service usage. Given the common understanding that customer share is the best behavioral measure for customer loyalty, the lack of studies using longitudinal data on observed customer share, enabling researchers to understand customer share changes, is an important gap in the literature. In this article we aim to fill in this gap by studying how relationship perceptions affect these changes.
Relationship Marketing Instruments and Customer Behavior
Firms apply different instruments to affect customer behavior within the relationship. Bhattacharya and Bolton (2000) suggest that RMI are a subset of other marketing instruments that specifically aim to facilitate the relationship. They distinguish between loyalty programs or reward programs and tailored promotions. In the direct marketing literature one distinguishes between RMI that focus on the immediate (cross)-selling of products or services and instruments that focus on building and maintaining customer relationships (McDonald, 1998). Loyalty programs are usually considered as part of the latter category of instruments, while direct mailings fall in the first category of instruments. De Wulf, Odekerken-Schröder and Iacobuci (2001) argue that RMI should be classified according to Berry's (1995) first two levels of relationship marketing. On the first level firms use economic incentives, such as rewards and pricing discounts, to develop the relationship. On the second level instruments include more social attributes. The latter classification is pretty much in line with the classification of Dabholkar, Jonston and Cathey (1994) on the gain perspective of the instrument. They consider individual gains and joint gains of an instrument. In the case of individual gains firms typically provide solely economic benefits to the customer, while firms aim to give the relationship a
personal touch by providing more social benefits having instruments with joint gains. Tailored promotions, such as direct mailings, may to some extent provide these social gains, as customization increases the customers' perception of the future value of the relationship (Bhattacharya and Bolton, 1999). However, as these tailored promotions also often include economic incentives, the character of this instrument is not clear. De Wulf, Odekerken-Schröder and Iacobucci (2001) show that RMI providing mainly economic benefits (loyalty programs) generally do not lead to improved perceptions of the relationship. Their study also reveals that despite their customized character, direct mailings do not always increase the customers' value perceptions, suggesting that direct mailings could possibly be considered as a type 1 RMI. Given our focus on behavioral loyalty in this study, we mainly consider the effect of RMI on customer behavior and do not study the effect of these instruments on perceptions of the relationship. Thereby, we limit ourselves to the direct mailings and loyalty programs, as these instruments are heavily used in business practice (Hart, Harris and Tzokas, 1999; Johnson, 1999; Roberts and Berger, 1999).
-- Insert Table 2 --
Table 2 provides an overview of academic studies that have considered the effect of RMI on behavioral loyalty. This overview shows that the number of studies in this area is rather limited. The majority of the studies have focused on the effect of loyalty or preferential treatment programs. Dowling and Uncles (1997) question the effect of loyalty programs. They argue that, due to polygamous or divided loyalty the double-jeopardy phenomenon and the easy-replication of a loyalty program by competitors, it will be difficult to increase customer loyalty in the long
run by using a loyalty program. However, they also acknowledge some situations in which a program might be effective. This especially holds if the program supports the customer value proposition, the lifetime value of the customer is high and or the customer retention costs are less than the acquisition costs. Sharp and Sharp's (1997) article is the first empirical study systematically investigating the impact of loyalty programs on purchase loyalty. They compare aggregated loyalty measures to Dirichlet estimates of the expected aggregated loyalty measures in a retail context (Ehrenberg, 1988). They show that only two of the six considered firms that participate in a loyalty program show higher than expected loyalty figures. However, these higher than expected figures were observed for members of the loyalty program as well as for non-members. Hence, they do not find convincing evidence for an effect of loyalty programs on customer loyalty. Bolton, Kannan and Bramlett (2000) is the first study that considered the effect of a loyalty program on customer retention and service usage on the individual customer level. For a credit-card company they find convincing evidence for an effect of the loyalty program on service usage. They also show that relationship perceptions may moderate the effect of the loyalty program. Bawa and Shoemaker (1987) studied the effect of direct mail coupons on aggregated purchase shares of a major grocery brand. They only report short-term gains in purchase rates. This is pretty much in line with studies on the short- and long-term effect of sales promotions in grocery markets (e.g. Nijs et al., 2001). While all other studies use data on the actual use of RMI, De Wulf, Odekerken and Schröder (2001) and Rust, Zeithaml and Lemon (2000) consider the effect of the customers' perceptions of RMI use. Rust, Zeithaml and Lemon (2000) show that in some industries (i.e. airline industry), these perceptions of the use of loyalty programs are highly correlated with purchase intentions. In contrast De Wulf,
Odekerken-Schröder and Iacobucci (2001) do not find evidence for an effect of these perceptions on customer share.
This overview reveals the following three important issues. First, until now there is no convincing evidence for an effect of loyalty programs on customer loyalty. This effect may also be context dependent, as it is effective in the credit-card industry (Bolton, Kannan and Bramlett, 2000), while it seems less effective in retailing (Sharp and Sharp, 1997; DeWulf, Odekerken-Schröder and Iacobucci, 2001). Thus, there is a need for more studies on this issue that jointly may lead to generalizations on the effect of loyalty programs on customer loyalty (Bass and Wind, 1995). Second, with the exception of Bolton, Kannan and Bramlett (2000) no studies have related RMI to actual behavioral data on the individual customer level. Third, there is more insight needed on the issue among which customers RMI are effective. Bolton, Kannan and Bramlett (2000) considered the moderating effect of satisfaction and payment equity on the effect of loyalty programs. However, there is no research on whether both behavioral and attitudinal loyalty may moderate this effect. There are both theoretical and managerial rationales for considering especially these variables as possible moderators. In marketing theory there is some evidence that sales promotions effectiveness may differ between frequent and less-frequent buyers (e.g. Bawa and Shoemaker, 1987). Moreover, an important comment on the effectiveness of loyalty programs is that these programs only reward already loyal customers and that they hardly impact the behavior of these loyal customers. Furthermore, it can also be questioned whether these programs lead to additional sales among non-loyal customers, as these customers continue to seek for the best buy (Dowling and Uncles, 1997).
CONCEPTUAL MODEL AND HYPOTHESES
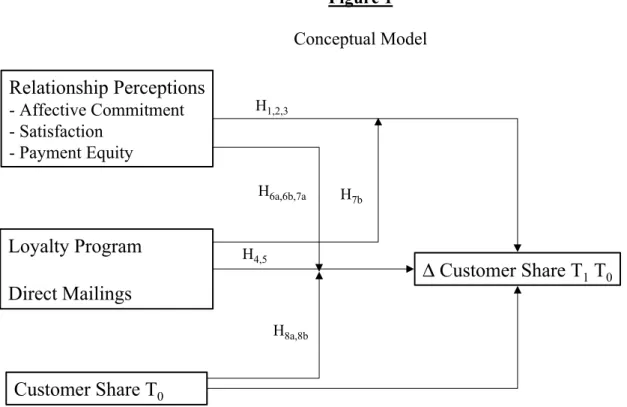
In Figure 1 we show our conceptual model. We consider the changes in customer share between two time periods (T1 and T0) as our dependent variable. Relationship perceptions, a loyalty
program and direct mailings affect these changes. Moreover, we also control for the effect of past behavioral loyalty with including customer share at T0 as an antecedent. An important
premise in our conceptual model is that both relationship perceptions and past behavioral loyalty may moderate the effect of the loyalty program and direct mailings. However, we also allow for some moderating effects of RMI on the effect of relationship perceptions. Given our early extensive discussion and the extensive discussions in the relationship marketing literature on the effect of relationship perceptions, we briefly discuss our hypotheses on the effect of relationship perceptions and RMI on customer share. Next, we discuss our hypotheses on the moderating effects.
-- Insert Figure 1 --
Relationship Perceptions
Commitment: We focus on affective commitment, which is a measure for attitudinal loyalty
(Gundlach, Achrol and Mentzer, 1995). Affective committed customers will display positive behavior for the organization, as they feel attached to the organization. They will also be less likely to patronize other firms (Dick and Basu, 1994; Sheth and Parvatiyar, 1995). Hence, affective committed customers will be more likely to increase their customer share and will be less likely to decrease their customer share. We hypothesize:
Satisfaction: The meta-analysis of Szymanski and Hise (2001) shows a positive impact of satisfaction on self-reported customer loyalty. Despite positive results in the literature, the link between satisfaction and customer loyalty is questioned. Researchers have proposed non-linear relationships between satisfaction and customer behavior (e.g., Bowman and Narayandas, 2001; Jones and Sasser, 1995; Mittal and Anderson, 2000). The theoretical rationales for this non-linear relationship are the importance of customer delight, the notion of sticky influence and decreasing returns to satisfaction (Oliva, Oliver and Macmillam, 1992; Oliver, Rust and Varvki, 1997). Other reasons for the empirical absence of an effect of satisfaction are customer heterogeneity, switching costs, context and customer specific effects and new events in the relationship. With respect to customer heterogeneity, relationship age, product usage, variety seeking and socio demographics (i.e. age, income and gender) are shown to moderate the link between satisfaction and loyalty (Bolton, 1998; Bowman and Narayandas, 20001; Homburg and Giering, 2001; Mittal and Kamakura, 2001). Other studies report that high switching costs lead to diminishing effects of satisfaction (Jones, Mothersbaugh and Beatty, 2001). Dick and Basu (1994) argue that context effects, such as competitive actions and events in customers' lives, may impact customer loyalty. Finally, dynamics during the relationship may affect this link. Customers update their satisfaction levels with new information gathered during new interaction experiences (Mittal, Kumar and Tsiros, 1999). This new information may diminish the effect of previous satisfaction levels (Mazursky and Geva, 1989).
Despite the often-reported absence of an empirical link between satisfaction and behavioral loyalty, a number of studies show an effect of satisfaction. For example Bolton and Lemon (1999) report a positive effect on service usage. Recently, Bowman and Narayandas (2001) show a positive relationship between satisfaction and share of category requirement in the context of
frequently purchased consumer goods. Although we acknowledge the possibility of an absence of a relationship between satisfaction and customer share development, we build on the study of Bowman and Narayandas (2001) and assume a positive effect of satisfaction on customer share development.
H2: Satisfaction positively affects changes in customer share.
Payment equity: Incorporating the literature on customer value, the effect of payment equity has recently gained more attention in the relationship marketing literature (e.g. Bolton and Lemon, 1999; Woodruff, 1997; Rust, Zeithaml and Lemon, 2000). Better price perceptions lead to higher retention probabilities and increasing service usage (Bolton and Lemon, 1999; Bolton, Kannan and Bramlett, 2000). The rationale for this is that lower prices will lead to a better payment equity, which enhances the perceived value proposition of the firm. According to utility theory this should lead to a higher customer share. Thus, we hypothesize:
H3: Payment equity positively affects changes in customer share.
Relationship Marketing Instruments
Hypothesizing the effect of direct mailings and loyalty programs is rather straightforward. The objective of both instruments is to increase the number of products or services purchased by a customer. Direct mailings generally use incentives, such as temporary price reductions, to seduce the customer to purchase additional products leading to higher customer shares. Bawa and Shoemaker (1987) suggest that this will lead to additional sales. The frequent use of this instrument by firms also suggests that this instrument affects customer behavior (Bult, 1993;
Roberts and Berger, 1998; Spring et al., 2001). Thus, we hypothesize a positive effect of direct mailings on customer share development.
As discussed, research shows an effect of loyalty programs on customer behavior on the individual customer level in the credit-card industry (Bolton, Kannan and Bramlett, 2000). On the aggregate level this effect is disputed (Sharp and Sharp, 1997). In the context of financial services, reward programs are generally believed to affect behavior, as in this context the customers' perceptions of the value proposition of a service will be heavily based on the price paid for that service. As reward programs provide price reductions if more services are purchased, the value proposition of the supplier is enhanced (Dowling and Uncles, 1997). Moreover, reward schemes also provide barriers to switch, as customers will lose these reductions when they reduce the number of purchased services. Hence, members of loyalty program will also be reluctant to reduce the number of services. Thus, we hypotesize a positive effect of loyalty membership on customer share development.
H4: Direct mailings positively affect changes in customer share.
H5: Loyalty program membership positively affects changes in customer share.
Interactions Perceptions – Relationship Marketing Instruments
Commitment – RMI: The basic contents of a direct mail package is the outer envelope, the letter, the brochure, other inserts and the reply device (Roberts and Berger, 1999, p. 275). Direct mail effectiveness to a great extent depends on the communicative power of these elements (Vriens et al., 1997). For example an attractive envelope will lead to a larger percentage of receivers opening the envelope (Nash, 1992), while a good letter causes a higher response percentage (Robert and Berger, 1999). Still the effect of direct mailings may differ between customers. The
elaboration likelihood model (ELM) suggests that the effect of advertising media is higher among involved customers (Petty and Cacioppo, 1986). As affective commitment is also highly correlated with involvement (Pritchard, Havitz and Howard, 1999), we expect that the effect of direct mailings is enhanced by affective commitment. Becoming more specific we believe that affective committed customers will be more inclined to open the envelope and they will read the letter with more attention and thus they will be more inclined to respond to the direct mailing.
The loyalty programs we focus on gives customers economic motives for remaining loyal. The behavior of affective committed customers is based more on social motives. Hence, in their loyalty decisions affective committed customers will take the economic benefits of the loyalty program less into account. Or put differently, their behavior will be more directed by their feelings of identification and loyalty towards the firm than by economic rewards. Thus, we expect a negative interaction effect between the loyalty program and affective commitment. We hypothesize the following:
H6a: Affective commitment increases the positive effect of direct mailings on changes in customer
share.
H6b: Affective commitment decreases the positive effect of the loyalty program on changes in
customer share.
Satisfaction – RMI: In general, one would think that instruments will only affect customer
behavior if a customer is satisfied. For example, let’s assume that after a bad handling of a claim a customer of an insurance company receives a direct mailing with an offer to purchase a new product. For this customer it would not be rational to respond to this direct mailing. Thus, we expect a positive interaction effect between satisfaction and direct mailings. This reasoning does
not have to apply to loyalty programs. Jones, Mothersbaugh and Beatty (2001) show that switching costs decrease the effect of satisfaction on purchase intentions. The switching barriers created by loyalty programs might thus lead to a smaller effect of satisfaction among members of a loyalty program (Bolton, Kannan and Bramlett, 2000). Thus in this case the effect of the loyalty program is not moderated by satisfaction, but the effect of satisfaction is moderated by loyalty program membership. We hypothesize:
H7a: Satisfaction increases the positive effect of direct mailings on changes in customer share.
H7b: The loyalty program decreases the positive effect of satisfaction on changes in customer
share.
Payment Equity – RMI: Lichtenstein, Ridgway and Netemeyer (1993) suggest that the perception
of prices is positively related to price seeking. The underlying rational for this is that price seekers will have chosen for the company with the most attractive price and are therefore more likely to have higher payment equity. Moreover, according to Bolton and Lemon (1999) customers with high payment equity are actively seeking to maintain this. At first glance this suggests that payment equity will enhance the effect of instruments offering price reductions. However, it might also imply that customers with high payment equity are intensively seeking the best buy. For example, if such a customer received a direct mailing with an attractive offer, he would be less likely to respond automatically. Instead, he would also look for offers from other suppliers to have the best buy. As Dowling and Uncles (1997) state that loyalty programs are unlikely to change polygamous loyalty, which is driven by price seeking behavior. Hence, payment equity should decrease the effect of the loyalty program. Given these contrasting views,
we do not hypothesize an interaction effect between payment equity and RMI. We will explore the appearance of such an effect in our empirical analysis.
Interaction Behavioral Loyalty – RMI
Rossiter and Percy (1997, p. 67) argue that the effectiveness of advertising is less among behavioral brand loyals. The underlying rationale for this is that there is less to gain among this group of customers. Bawa and Shoemaker (1987) indeed show that direct mailings with coupons are less effective among behavioral brand loyals. Kahn and Louie (1990) report a weaker effect of promotions among brand loyals. Thus, we expect that behavioral brand loyalty decreases the effect of direct mailings on customer share development.
A frequently heard comment on the effect of a loyalty program is that it only rewards loyal customers. These behavioral loyal customers will remain loyal, because of large inertia and switching costs (Klemperer, 1995; Rust, Lemon and Zeithaml, 2000). The importance of inertia in the marketing modeling and relationship marketing literature has been frequently reported. For example Bolton and Lemon (1999) report that service usage in the previous period is a pretty good predictor of service usage in the next period. This also suggests that the loyalty program does not enhance customer share among loyal customers. A counter argument may be that these programs may prevent customers from decreasing customer share because of switching costs inherent to these programs. This will hold for less loyal customers to a lesser extent as they receive smaller rewards. Given the general notion that instruments are less effective among brand loyals and the noted inertia effects, we assume that the loyalty program would be less effective among behavioral loyal customers. In line with our operationalization of brand loyalty,
we thereby define loyal customers as customers with large customer shares. Based on this, we hypothesize:
H8a: Behavioral loyalty (customer share at T0) decreases the positive effect of direct mailings on
changes in customer share.
H8b: Behavioral loyalty (customer share at T0) decreases the positive effect of the loyalty
program on changes in customer share.
RESEARCH METHODOLOGY
Research Design
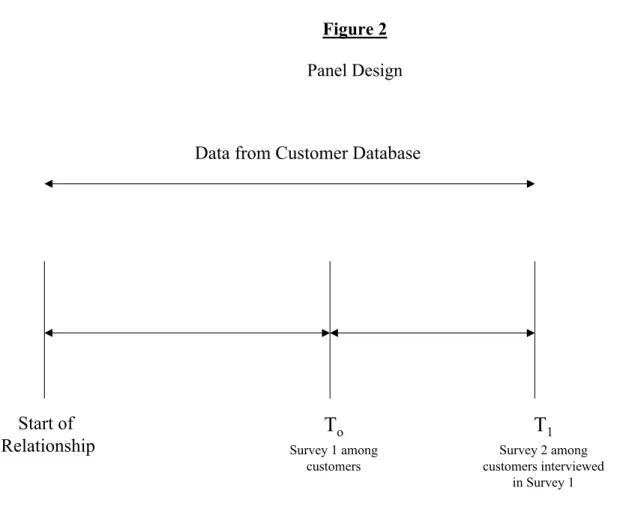
In this study we combine survey data for customers of a financial services company and data from a customer database of that company. A panel design, which is graphically displayed in Figure 2, was used to collect the data. The survey data were collected at two points in time T0
and T1. The first survey was used to measure relationship perceptions, the ownership of financial
services and customer characteristics. In the second survey we again collected data on the ownership of financial services.
-- Insert Figure 2 –
Contents Customer Database
The customer database provides data on the purchase behavior of individual customers and the RMI directed at each individual customer. The purchase behavior data in the database cover two time periods. The first time period starts at the beginning of a relationship between the company
and the customer and ends at T0. This period differs between customers. It provides us data on
past purchase behavior, such as number of services purchased, type of services purchased and relationship length. The second period concerns the time interval between T0 and T1. For this
interval the customer database provides us with the following behavioral information on, (1) which customers left the company, and (2) the number of services purchased at T1. In our
empirical model we only study the customers that remained during this period.
The following information on RMI is recorded in the customer database: (1) loyalty program membership at T0, and (2) the number of direct mailings sent between T0 and T1. Every customer
purchasing 1 or more services from the supplier can be a member of the loyalty program (opt-in program). At the end of each year the program provides a monetary reward to customers based on the number of services purchased. The number of mailings sent differs between customers, because the company uses regression type models to select customers with the highest probability to respond.
Survey Data Collection
At T0 survey data were collected by phone among a random sample of 6525 customers of the
financial services company. In order to have a representative sample on relationship length, the number of services purchased and claiming behavior, a quota sampling approach was used. We obtained data from 2300 customers (response rate 35%). After deleting those cases with too many missing values a sample size of 1986 customers remained. At T1 we again collected data
among these customers, with the exception of these customers that left between T0 and T1. In the
Measurement of Relationship Perceptions
For the measurement of relationship perceptions, we adapted existing scales to fit the context of financial services. For the affective commitment scale we adapted items from Anderson and Weitz (1992), Garbarino and Johnson (1999) and Kumar, Scheer and Steenkamp (1995). To measure satisfaction we adapted the scale of Singh (1990b) and also added some new items. Finally, the payment equity scale was based on items adapted from Bolton and Lemon (1999) and Singh (1990b). To assess construct validity and to clarify wording the original scales were tested among a sample of 12 marketing academics and 3 marketing practitioners familiar with customer relationships. Subsequently, the scales were tested among a random sample of 200 customers of the company. Based on inter item correlations, item-to-total correlation's, coefficient alpha, exploratory and confirmatory factor analysis, we reduced the set of items of each scale. The remaining set of items was used in our questionnaire at T0.
Validation of Relationship Perceptions
The final measures are reported in Appendix A. All scales have reasonable coefficient alpha's. We applied confirmatory factor analysis to further assess the quality of our measures using Lisrel83 (Jöreskog and Sörbom, 1993). The following model fit was achieved: χ2 = 217.4
(degrees of freedom (df) = 51, p <0.01), χ2/df = 4.26, df=1, p<0.05), GFI=0.98, AGFI=0.97;
CFI=0.98 and RMSEA=0.04. The fit indices satisfy the criteria for a good model fit (Bagozzi and Yi, 1992; Baumgartner and Homburg, 1996). A series of chi-square difference tests on the respective factor correlations provides further evidence for discriminant validity, because the chi-squares of the constrained models exceed that of the unconstrained models in all cases (Anderson and Gerbing, 1988).
Measurement of Dependent Variables
An often used measure for customer share is to ask the customer to report the number in ten purchases that normally are of the focal brand (Bowman and Naranyandas, 2001; DeWulf, Odekerken-Schröder, 2001). In this study we aim to have a more objective measure. We define customer share of customer i for supplier j in category k at time t as:
t time at k category in purchased services of Number t time at j supplier at k category in purchased services of Number Share Customer i,j,k,t = (1)
Although the supplier also offers products, such as loans, we limit ourselves to the service category insurances. The rationale for this limitation is that consumers usually buy each insurance type at a single supplier (that is, insurance type X is purchased solely from supplier Y), while this does not necessarily hold for other financial services. For example, it is well known that customers can have bank accounts at a number of financial service providers. Moreover, the insurance market is still the most important market for this company in terms of turnover and number of customers. As a result of this limitation our sample is restricted to those customers that solely purchase insurances at this company. The resulting sample size is 918 customers.
Data on the numerator in (1) are available from the customer database. However, information on the denominator in (1) is generally not stored in the customer database (Blattberg, Glazer and Little, 1994; Spring et al., 1999). We therefore asked the customer which insurances he owned at T0 and at T1.
Analysis
We use a difference model to test our hypotheses (Bowman and Narayandas, 2001; Leeflang et al., 2000). Following the literature on market share models, the difference between the logs of customer share at T1 and T0 (CS0, CS1) is the dependent variable in our regression model
(Franses and Paap, 2001). This variable can be interpreted as the percentage change in customer share. In this regression model the following independent variables are included. First, we include the mean-centered composites of the items of the relationship perception scales
(perceptions) commitment, satisfaction and payment equity. We mean-centered these composites
in order to overcome multi-collinearity problems (Aiken and West, 1991). Second, we included
RMI as follows. A dummy variable indicating whether the customer was a member of the loyalty program at T0 was constructed, while we mean-centered the number of mailings received
between the two time periods. Third, we included the log of customer share at T0 in our model,
because we have hypothesized interaction effects between behavioral loyalty and RMI. Fourth, we included the interaction terms between perceptions and RMI and behavioral loyalty and RMI. The correlation matrix of these variables is given in Table 3. Finally, we also checked for the effect of product specific effects (product),. The underlying rationale for the inclusion of product specific effects, is that some products on average have lower defection rates, while other have higher cross-selling rates. This results in the following equation:
0 Products CS Log RMI s Perception RMI CS Log RMI s Perception CS Log CS Log 7 0 1 0 6 0 1 0 5 0 4 1 0 2 0 1 0 0 1 ) ( * * ) ( ) ( ) ( β β β β β β β + + + + + + = − − − − (2)
In equation (2) we provide the formulation of our model in the form of matrices, where each β
consists of a number separate parameters. For example, in the case of β1, we have three different
parameters for the effect of commitment, satisfaction and payment equity.
-- Insert Table 3 --
Our estimation results may be biased as a result of the fact that we only included customers that answered the questionnaire in the second time period. We therefore apply the Heckman two-step procedure (Heckman, 1976). We also apply White's method to adjust for heteroscedasticity (Franses and Paap, 2001; White, 1980).
In order to fully understand how the considered antecedents affect purchase behavior, we use a hierarchical modeling approach. We consider the following steps: (1) entering of control variables and Heckmans adjustment term; (2) entering of main effects of relationship perceptions; (3) entering of main effects instruments; (4) entering of interaction effects instruments and perceptions and (5) entering of interaction effects instruments behavioral loyalty. In order to have a parsimonious model, we only include those control variables with a p-value below 0.30 in our model.
EMPIRICAL RESULTS
Customer share development
In Figure 3 we display the distribution of the changes in customer share. Although, on average the changes in customer share are almost zero, we observe changes in customer share for
approximately 68% of the customers in the sample. The distribution in Figure 3 is rather symmetric. For 34% of the customers we observe negative changes, while customer share increases by approximately 34%. As a logical consequence of the average of zero in changes in customer share, the mean values for customer share at T0 and T1 are approximately the same with
a value of 0.285.
-- Insert Figure 3 ---
Regression results
Main Effects: In Table 4 the regression results of the main effects of equation 2 are reported. In the first column we report the variables included in the model, while we show the relevant hypothesis in the second column. In the subsequent columns we report the regression coefficients, the t-values and significance of these coefficients for three different models. In the first model we only include some control variables, subsequently we enter the perceptions in the second model, while RMI are included in the third model. The first model explains approximately 10% of the variance in customer share changes. Surprisingly the log of customer share at T0 has a negative effect on changes in customer shares (p<0.01). Thus, customers with
large customer shares are more likely to decrease their customer share in the next period. Customers with a damage insurance or car insurance are found to be more likely to increase their customer share (p<0.01), while owning co-insurances also has a positive effect on customer share development (p<0.01). Note, that the Heckman correction term is not significant.
In the second and third model the same effects of the control variables are found. The estimation results show a positive significant effect of commitment on customer share development (p<0.05). Thus, we find support for H1. However, no significant effect is found for both
satisfaction and payment equity. As a consequence, we do not find support H2 and H3. In our
empirical modeling we also tried other functional forms, such as the quadratic and the logarithmic, for the effect of satisfaction (e.g., Anderson and Mittal, 2000; Bowman and Narayandas, 2001). Still the effect of satisfaction is not significant. In the third model in which the two RMI are included, the effect of commitment remains significant (p<0.01). The loyalty program has a significant positive effect on customer share changes (p<0.05). Thus, members of the loyalty program are more likely to increase their customer share. Direct mailings also positively affect customer share (p<0.05). Hence, both H4 and H5 are supported.
Interactions Perceptions – RMI: In Table 5 the regression model results with the interactions
between perceptions and instruments are displayed. In model 4a the interactions between perceptions and direct mailings are tested. The addition of these interactions to model 3a does not affect the coefficients of the main effects, which indicates that multi-collinearity does not impact the results (Leeflang et al., 2000). All considered interaction terms are not significant (p>0.05). Thus, we do not find support H6a and H7a. We find a negative insignificant interaction
effect between payment equity and direct mailings (p=0.20). The interactions between the loyalty program and perceptions are tested in model 4b. No support is found for H6b, as the negative
coefficient is not significant (p>0.05). The interaction term between the loyalty program and satisfaction is negative and significant (p<0.05). This result provides support for H7b. Finally, we
also estimated a model with all interaction terms. In this model the insignificant interaction terms remained insignificant, while the significant interaction term remained significant.
-- Insert Table 5 --
Interactions Behavioral Loyalty – RMI: In the same manner as we have tested the interaction
effects between perceptions and RMI, we now continue with testing the interaction effects between behavioral loyalty and RMI. The included interaction effects between RMI and log Customer Share at T0 are both insignificant (p>0.05). A likelihood ratio test in which we
compared the log likelihood of the restricted model with no interaction terms with the likelihood of the unrestricted model with interaction terms was also not significant (p=0.96). Thus, our estimation results do not support for H8a and H8b.
The moderating effect of behavioral loyalty and the loyalty program is rather intriguing. We therefore applied a rather simple analysis, in which we compared the average changes in customer share between four groups: (1) non-loyals and no loyalty program, (2) non-loyals with loyalty program, (3) loyals with no loyalty program and (4) loyals with loyalty program. We used a median-split to distinguish between loyals and non-loyals. Non-loyals are those customers with customer shares below the median customer share of the sample. The results of this analysis are displayed in Figure 4. On the y-axis the absolute changes in customer share are displayed, while the x-axis distinguishes between non-loyals and loyals. The interaction plot in Figure 4 clearly shows that members of the loyalty program generally have larger changes in customer share than non-member. However, the difference between members and non-members is rather small in the case of loyal customers. An Anova shows that this interaction effect is not
significant (p=0.44). Probably, this is due to the small sample size in the two interesting groups: non-loyals with a loyalty program and loyals without loyalty program. We also run an Anova for customers with solely 2 or more products. The rationale for this is that only these customers are allowed to become a member of the loyalty program. For these customers (n=554) we find an almost significant interaction effect between loyalty program membership and changes in customer share (p=0.08). Thus, we find only preliminary evidence for a negative interaction effect between behavioral loyalty and the loyalty program.
-- Insert Figure 4 --
CONCLUSIONS
The purpose of this study was twofold. First, we aimed to further test the effect of relationship perceptions on customer loyalty. Second, our objective was to further understand and test the effect of RMI. In the remainder of this article we will first discuss the theoretical implications of our findings. Subsequently, we provide some management implications. Finally, we end with our research limitations and avenues for further research.
Theoretical Implications
Relationship Perceptions: This study extended the literature on the main effect of relationship perceptions on behavioral loyalty by investigating the impact of these perceptions on customer share development over time, which is usually considered as one of the best measures for behavioral loyalty. Our empirical results showed that commitment positively affects customer
share development. As such, we confirm prior research relating commitment to customer share (e.g., DeWulf, Odekerken-Schröder and Iacobucci, 2001). We also provided support for the claim of Morgan and Hunt (1994) that commitment is essential for successful relationships. However, it also contradicts Gruen, Summers and Acito (2000), who could not find an effect of commitment on customer retention. This contradiction can perhaps be explained by the fact that they use aggregated data instead of data on individual customers. Furthermore, they study customer retention, instead of customer share. Our results further showed no effect of satisfaction on customer share development. This result contrasts the study of Bowman and Narayandas (2001), who report a positive effect of satisfaction on customer share. However, they do use cross-sectional data with self-reported customer share. Moreover, they study customers that recently initiated a contact with a manufacturer of frequently purchased goods. As a result their satisfaction scores are relatively transaction based. Moreover, customers initiating contacts with manufacturers are probably more involved (Singh, 1990a), resulting in a larger effect of satisfaction. Finally, the different contexts of both studies may explain our diverging findings (Rust, Zeithaml and Lemon, 2000). We also cannot find an effect of payment equity. Thus price perceptions do not impact customer share development over time. This might imply that true customer loyalty is not created with price instruments.
The fact that commitment is the only perception affecting customer loyalty has rather important theoretical implications. One of the possible reasons for an absence of an effect of satisfaction is that customer relationships are dynamic. During the relationship customers have new experiences, which are used to update their perceptions (e.g., Bolton, 1998; Mittal, Kumar and Tsiros, 1999). It is shown that people prefer to use these updated perceptions, instead of their old not updated perceptions (Verhoef, Franses and Donkers, 2001). However, as we find a
positive effect of commitment, this might imply that commitment is rather stable over time. Thus, creating committed customers can really benefit the company as it has a long-term impact on customer loyalty, while this does not hold for satisfaction, which is more susceptible to new developments in the relationship.
Effect of RMI: This study is one of the few in marketing that has investigated the impact of RMI on customer loyalty. It confirms results of Bolton, Kannan and Bramlett (2001) that the loyalty program impacts customer loyalty in the financial service industry. As such, it contrasts findings of Sharp and Sharp (1997), who did not find an effect of loyalty programs. However, they report aggregated results. We also show a positive direct effect of the number of mailings sent on customer loyalty. To our knowledge, this has not been shown in prior research. Thus, both instruments are useful in enhancing customer share. We note, however that although these instruments impact behavior, the costs of these instruments can still outweigh the potential additional revenues.
We also considered interaction effects between perceptions and RMI. Our results with respect to these interactions are rather disappointing. Although in most cases the coefficients have the right sign, only one interaction term was significant. We find a negative interaction effect between the loyalty program and satisfaction. We theorized that this is explained by the fact that due to switching barriers created by the loyalty program, customers are less receptive to satisfaction scores. Thus, applying an economically oriented loyalty program creates possibilities for the companies to provide less service quality.
In this research we also studied whether the effects of RMI differ between behavioral loyals and behavioral non-loyals. Our empirical results do not provide any evidence for a differential
effect. We only find some weak evidence for the fact that a loyalty program is less effective among loyal customers. The small number of non-loyal customers being a member of the loyalty program might result in the absence of a moderating effect of behavioral loyalty on the effect of the loyalty program. Our descriptive analysis seems to suggest especially such an effect. Other reasons might apply as well. Prior research on the differential effects of marketing instruments, such as promotions between loyals and non-loyals (or switchers), were mainly in the context of frequently purchased consumer goods (e.g., Grover and Srinivisan, 1992; Kahn and Louie, 1990). In these contexts customers do not have continuous relationships with the supplier and thus more switching occurs. As such it is easier to find differential effects.
Explained Variance: Our results also provide some interesting insight into the additional effect of both relationship perceptions and instruments above and beyond the effect of past behavior. Recently, Wathne, Biong and Heide (2001) claim that interpersonal relationships are considerably less important than both switching costs and marketing variables. Our results also show this. The largest part of the variance is explained by past behavioral variables. Although they have less explaining power than past behavior, the included marketing instruments explain a larger part of the variance than the included relationship perceptions. This can have important theoretical implications. Although the quality of the relationship between the supplier and the customer impacts customer behavior, its impact is rather small. This might suggest that the effect of relationships has been overestimated within marketing.
Management Implications
Our research provides some important implications for the management of customer relationships. First, it shows that within these types of industries customer share changes are achieved by enhancing commitment among customers. Commitment is the only relationship perception that makes a difference in the long run. Second, our results show that both the loyalty program and direct mailings are tactics that can be used to enhance customer share. However, from a business point of view, one also needs to consider the costs of these tactics before applying them (Rust, Zeithaml and Lemon, 2000). Finally, as our analysis suggested that the behavior members of the loyalty program is less affected by satisfaction, companies offering a loyalty program can probably pay less attention to quality among this group of customers. Our research shows some preliminary evidence for a moderating effect of behavioral loyalty on the effect of the loyalty program. This can have important implications for the application of the loyalty program. In general, loyalty programs are structured in such a way that brand loyals receive the majority of the rewards. Thus a large part of the budget allocated to customer relationship management programs is allocated to these loyal customers. However, our result questions the effectiveness of the instrument directed at this group of customers. Thus at least a part of the budget allocated to this group might be wasted and could have been applied more effectively. The budget could be used to cross-sell services to less loyal customers. This can be profitable both in the short- and long run, as customers with more services are less inclined to defect due to inertia and switching costs.
Research Limitations and Future Research
This study has the following limitations. First, the study is conducted for a company in the financial service market. In the financial service market switching behavior is not often observed. This might also explain some of our weak results. Thus, there is a need to extend this study to other markets, where more switching is observed, such as for example mobile telecommunications. Second, although our study applied a longitudinal research design the causality question remains difficult. Due to the dynamic nature of customer relationships multiple measurements in time are needed, in which changes in perceptions are included in the model. This could also resolve issues raised on our testing effects. Third, although we have captured some aspects of customer heterogeneity by including interaction effects in our models, there might be more unobserved heterogeneity. Future research could explore this heterogeneity. Fourth, modeling the effect of marketing instruments is rather difficult. In particular if instruments are self-selected or are based on the purchase behavior of customers. In this particular case customers can choose to be a member of a loyalty program. One could perhaps argue that customers expecting to purchase new services are more inclined to join this program. For the moment, we did not correct for this in our analysis. Future research could investigate this issue further and could develop models to correct for possible endogeneity of the marketing instruments. Given the repeating statements in the literature questioning the effect of loyalty programs, there is a need for studies that further investigate when and how loyalty programs affect customer behavior. Moreover, there is a need for investigations on the reasons why customers join these loyalty programs. It would also be interesting to study whether one instrument enhances he effect of other instruments (Duncan and Caywood, 1996). Another interesting avenue for further research concerns the effect of instruments on relationship
perceptions. In this paper we estimated models that jointly related relationship perceptions and instruments with customer behavior. Some of these instruments might also impact perceptions. A simultaneous equation approach with appropriate test for mediating effects would be necessary to address this issue. Another interesting avenue for further research is to include competitive effects in customer share models. Finally, future research could develop models that can be used to support CRM decisions for managers. Recently, Rust, Zeithaml and Lemon (2001) introduced the customer equity model using perceptions of customers and purchase intentions to compute the impact of marketing strategies on CLV. However, there remains a need for decision support models that utilize the data available in customer databases and data from questionnaires to show the impact of marketing strategies on CLV.
Table 1
Overview of Studies on Effect of Relationship Perceptions on Behavioral Loyalty Behavioral Loyalty
Measurement
Type of
Behavioral Data
Included
Perceptions Examples of studies Self-reported purchase intentions cross-sectional satisfaction, commitment, payment equity
Morgan and Hunt (1994); Garbarino and Johnson (1999); Rust, Zeithaml and Lemon (2000); Zeithaml, Berry and Parasuraman (1996)
customer share cross-sectional satisfaction, commitment
DeWulf, Odekerken-Schröder and Iacobucci (2001); Bowman and Narayandas (2001); Macintosch and Lockshin (1997) Observed customer retention, relationship duration cross-sectional, aggregated
commitment Gruen, Summers and Acito (2000)
customer retention, relationship duration longitudinal satisfaction, payment equity
Bolton (1998); Bolton, Kannan and Bramlett (2000)
service usage longitudinal satisfaction, payment equity
Bolton and Lemon (1999); Bolton, Kannan and Bramlett (2000) cross-buying longitudinal satisfaction,
payment equity
Verhoef, Franses and Hoekstra (2001)
Table 2
Studies on Effect of RMI on Behavioral Loyalty
Study Instruments Loyalty Measure
Bawa and Shoemaker (1987) direct mail aggregated purchase shares Bolton, Kannan and Bramlett
(2001)
loyalty programs customer retention, service usage
De Wulf,
Odekerken-Schröder, Iaocobucci (2001)
preferential treatment programs, direct mailings, interpersonal communication
customer share
Dowling and Uncles (1997) loyalty programs no empirical data Rust, Zeithaml and Lemon
(2000)
preferential treatment programs
purchase intentions
Sharp and Sharp (1997) loyalty programs aggregated penetration, average purchase frequency,
Table 3
Correlation Matrix Independent Variables
X1 X2 X3 X4 X5 X6 [X1] Commitment 1.00 [X2] Satisfaction 0.37 1.00 [X3] Payment Equity 0.14 0.21 1.00 [X4] Direct Mail 0.01 0.02 -0.09 1.00 [X5] Loyalty Program 0.09 0.14 0.03 0.56 1.00
Table 4
Regression Model Results of Changes in Customer Share: Main Effects
Variable Hypothesis (sign) Model 1 (t-value) Model 2 (t-value) Model 3 (t-value) Constant -0.44 (6.84)** -0.46 (7.09)** -0.52 (7.80)** Heckman Correction 0.06 (0.90) 0.07 (1.27) 0.10 (1.48) Log Customer Share T0 -0.17 (9.97)** -0.19 (10.3)** -0.20 (11.0)**
Co-insurance 0.02 (3.83)** 0.02 (3.92)** 0.02 (3.26)** Damage Insurance 0.14 (6.35)** 0.15 (6.52)** 0.14 (6.09)** Car Insurance 0.04 (2.69)** 0.01 (2.29)* 0.04 (2.52)** Legal Insurance 0.03 (1.15) 0.03 (1.16) 0.03 (1.16) Perceptions Commitment 1 (+) 0.03 (2.55)* 0.03 (2.58)** Satisfaction 2 (+) 0.00 (0.01) -0.00 (0.21) Payment Equity 3 (+) -0.01 (0.85) -0.01 (0.66) RMI Loyalty Program 4 (+) 0.04 (2.22)* Direct Mailing 5 (+) 0.01 (2.31)* R2 0.10 0.11 0.13 Adjusted R2 0.10 0.10 0.12 F-value 16.95** 12.21** 11.72** Notes: ** p-value <0.01 * p-value <0.05
Table 5
Regression Model Results with Interactions Perceptions RMI
Variable Model 4a (t-value) Variable Hypothesis (sign) Model 4b (t-value) Constant -0.52 (7.77)** Constant -0.52 (7.68)** Heckman Correction 0.10 (1.48) Heckman Correction 0.11 (1.60) Log Customer Share T0 -0.20 (11.0)** Log Customer Share T0 -0.20 (11.0)** Co-insurance 0.02 (3.31)** Co-insurance 0.02 (3.28)**
Damage Insurance 0.14 (6.02)** Damage Insurance 0.14 (6.08)**
Car Insurance 0.04 (2.44)* Car Insurance 0.04 (2.62)**
Legal Insurance 0.02 (0.96) Legal Insurance 0.02 (1.01)
Perceptions Perceptions
Commitment 1 (+) 0.02 (2.49)* Commitment 1 (+) 0.02 (2.17)* Satisfaction 2 (+) -0.00 (0.09) Satisfaction 2 (+) 0.02 (1.00) Payment Equity 3 (+) -0.00 (0.48) Payment Equity 3 (+) -0.01 (0.42)
RMI RMI
Direct Mailing 4 (+) 0.04 (2.24)* Direct Mailing 4 (+) 0.04 (2.40)* Loyalty Program 5 (+) 0.01 (2.31)* Loyalty Program 5 (+) 0.01 (2.34)* Direct Mail-Perceptions Loyalty Program-Perceptions – Commitment 6a (+) 0.01 (0.75) – Commitment 6b (-) -0.01 (0.44) – Satisfaction 7a (+) -0.01 (0.68) – Satisfaction 7b (-) -0.07 (1.99)* – Payment Equity -0.01 (1.25) – Payment Equity -0.00 (0.04)
R2 0.13 R2 0.13 Adjusted R2 0.11 Adjusted R2 0.12 F-value 9.37** F-value 9.63** Notes: ** p-value <0.01 * p-value <0.05
Figure 1 Conceptual Model ∆ Customer Share T1 T0 Loyalty Program Direct Mailings Customer Share T0 Relationship Perceptions - Affective Commitment - Satisfaction - Payment Equity H1,2,3 H4,5 H6a,6b,7a H 7b H8a,8b
Figure 2 Panel Design
T
o Survey 1 among customersT
1 Survey 2 among customers interviewed in Survey 1 Start of RelationshipFigure 3
Customer Share Development
0 100 200 300 400 500 -0.25 0.00 0.25 0.50 0.75
Figure 4
Interaction Between Behavioral Loyalty and Loyalty Program
0.006 -0.01 0.029 -0.006 -0.015 -0.01 -0.005 0 0.005 0.01 0.015 0.02 0.025 0.03 0.035
Not Loyal Loyal
A b solute changes in C u stoemer Share No Loyalty Progam Loyalty Program
REFERENCES
Aiken, Leona S. and Stephen G. West (1991), Multiple Regression: Testing and Interpreting Interactions, Sage Publications, Thousand Oaks
Anderson, Erin and Barton A. Weitz. (1992), "The Use of Pledges to Build and Sustain Commitment in Distribution Channels", Journal of Marketing Research, 29 (1), 18-34
Anderson, Eugene W., Claes Fornell and Donald Lehmann (1994), "Customer Satisfaction, Market Share, and Profitability: Findings from Sweden", Journal of Marketing, 58 (2), 53-66
Anderson, Eugene W. and Vikas Mittal (2000), "Strengthening the Satisfaction-Profit Chain",
Journal of Service Research, 3 (2), 107-20
Anderson, James C. and David W. Gerbing (1988), "Structural Equation Modeling Practice: A Review and Recommended Two-Step Approach", Psychological Bulletin, 103 (3), 411-23 Bagozzi, Richard P. and Youyae. Yi (1988), "On the Evaluation of Structural Equation Models",.
Journal of the Academy of Marketing Science, 16 (1), 74-94
Bass, Frank M. and Jerry Wind (1995), "Introduction to the Special Issue: Empirical Generalizations in Marketing", Marketing Science, 14 (3 part 2), G36-46
Baumgartner, Hans and Christian Homburg (1996), "Applications of Structural Equation Modeling in Marketing and Consumer Research", International Journal of Research in Marketing, 13, 139-61
Bawa, Kapil and Robert Shoemaker (1987), "The Effects of a Direct Mail Coupon on Brand Choice Behavior", Journal of Marketing Research, 24 (November), 370-6
Berry, Leonard L. (1995), "Relationship Marketing in Services: Growing Interest, Emerging Perspectives", Journal of the Academy of Marketing Science, 23 (4), 236-46
Bhattacharya, C.B., Hayagreeva Rao and Mary Ann Glynn (1995), "Understanding the Bond of Identification: An Investigation of its Correlates among Art Museum Members", Journal of Marketing, 59 (4), 46-57
Bhattacharya, C.B. and Ruth N. Bolton (1999), "Relationship Marketing in Mass Markets", in
Handbook of Relationship Marketing (eds. Jagdish N. Sheth and Atul Parvatiyar), Sage
Publications, 327-354
Bickart, Barbara A. (1993), "Carryover and Backfire Effects in Marketing Research", Journal of Marketing Research, 30 (1), 52-62
Blattberg, Robert C., Rashi Glazer and John D.C. Little (1994), Marketing Information Revolution, Harvard Business School Press, Boston
Blattberg, Robert C., Gary Getz and Jacquelyn S. Thomas (2001), Customer Equity: Building
and Managing Relationships as Valuable Assets, Harvard Business School Press, Boston
Bolton, Ruth N. (1998), "A Dynamic Model of the Duration of the Customer’s Relationship with a Continuous Service Provider: The Role of Satisfaction", Marketing Science, 17 (1), 45-65
Bolton, Ruth N. and Katherine N. Lemon (1999), "A Dynamic Model of Customers' Usage of Services: Usage as an Antecedent and Consequence of Satisfaction", Journal of Marketing Research, 36 (2), 171-86
Bolton, Ruth N., P.K. Kannan and Mathew D. Bramlett (2000), "Implications of Loyalty Program Membership and Service Experiences for Customer Retention and Value", Journal of the Academy of Marketing Science, 28 (1), 95-108