by
Cecil Dybowski, [email protected]
Here you list all names of people involved, along with email
addresses.
CHEMISTRY 446
Here you enter the section and group numbers.
EXPERIMENT 6
Here you insert the date that the report is submitted.
Executive Summary
The general format of a laboratory report is explained and illustrated. Each section is illustrated. Common errors and problems are discussed. Data analogous to those of experiment 6 are used to demonstrate a typical report structure. [NOTE: THE EXECUTIVE SUMMARY SHOULD
ALWAYS BE THE LAST SECTION ONE WRITES. IT IS A SUMMARY, WHICH
CANNOT BE DONE UNTIL ALL OF THE WORK OF THE EXPERIMENT AND THE WRITING OF OTHER SECTIONS IS FINISHED.] The title information and Executive Summary should not exceed one page.
Text in blue font indicates text that is part of the report. Text is black is commentary on how to write the report.
Introduction
Writing a laboratory report is as important as taking data. When I say “writing,” that includes the careful analysis of data and attention to the details of how the information is formatted for the ultimate reader. Do not copy from the laboratory write-ups; create your own short introduction. The introduction should be concise. It should explain the outlines of the experiment, what results have been determined, and salient points about the experiment. It should be about how your experiment worked, not some reprise of the general statements in the write-ups. Remember that an introduction “tells the reader what he/she is going to be reading.” Here is an example of a concise introduction:
The infrared (IR) spectrum of CO has been analyzed to determine the fundamental constants of the molecule. The results can be expressed in terms of the rotation constant, Be, the rotation-vibration constant, αe, and the vibrational frequency. By IR spectroscopy on ground state molecules, it is not possible to determine the zeroth-order vibrational frequency, so we report the vibrational frequency, ν0 −2xeν0. The results are consistent with data in the literature, within experimental error.
The object of the introduction is to give the reader a sense of what you are doing, why you are doing it in the way you are doing the experiment, and what results you have determined. Since scientific results are considered to be independent of the observer, it is appropriate to state any differences between one’s work and that of others. It may be appropriate to give numbers at this point (as well as in a section labeled “Conclusions”, but it is not always necessary.
Experimental
The section entitled “Experimental” generally contains information on the physical properties of the experiment, such as the type of instrumentation used, the variables controlled and those that are not controlled, and any unusual conditions. Here is an example of a section of that type.
The experiment was carried out with a Nicolet Fourier transform infrared (FTIR) spectrometer. The resolution of the spectrometer was set at 1 cm-1 for all spectra. The experiment involved the accumulation of background spectra which were subtracted from the spectra of the sample to provide the response of the sample. The detector was a nitrogen-cooled cadmium-telluride detector. Each experiment resulted from the average 64 transient responses coadded, with the background spectrum being the accumulation of 64 spectra without the sample present. The data were analyzed by Fourier transformation using the software of the instrument. The data were saved to disk, and were subsequently analyzed with a spreadsheet program, in this case, Microsoft EXCEL.
The section need not be long, but it should include everything about the experimental setup that the author thinks is important. While the data are usually gathered with an infrared spectrometer,
the data discussed below are taken from Noggle’s book.1
In a real report, one would include such things as calibration of instruments and special features. In addition, in some cases it is appropriate to discuss features such as how well the temperature was controlled (if it was or if it was necessary), barometric pressure or other pertinent experimental details such as concentrations of solutions (with an indication of calculations).
Anything important in defining the experimental conditions should be stated. One should also report safety concerns in this section.
Results and Discussion
To start this section one has to refer to data. I do not write an example paragraph, but the student should be able to write out a simple explanation. In the case of the infrared spectrum, the data are the positions of absorptions read off the spectrum. In other experiments, there may not be a table of data. In some cases there may be plots of data. Note the format of a table. There is a title. Generally there is a heading for each column describing what is contained in the column (including the appropriate units), and there are entries below that. If you are using WORD or some similar word processing program, you may be able to format the table in different ways. Don’t get carried away with this sort of thing; the important thing is to convey to the reader as precisely as possible what the data are. Do not allow the word processor to split a table unless there are so many entries that is absolutely necessary.
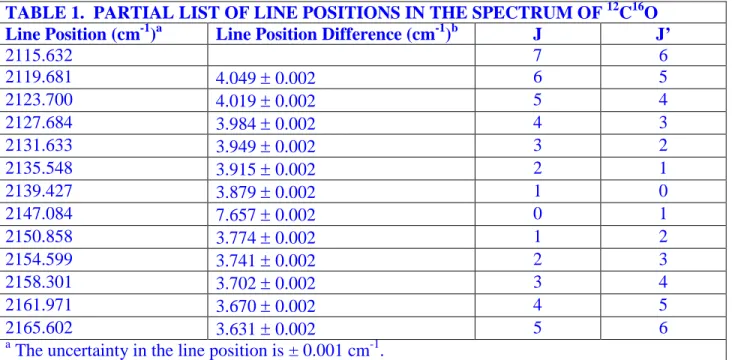
In writing each report, you have to make judgments about what things to include in the text of the report, sometimes original data, sometimes partially reduced data. Data must be accompanied by some estimate of the uncertainty. The exact form of the reported uncertainty depends on the data source. In this case, I assumed that the data were uncertain to 1 unit in the last reported digit. A difference, such as the second column, has a larger uncertainty by virtue of the rules for determining uncertainty. I show a footnote way and an in-line way; use only one.
TABLE 1. PARTIAL LIST OF LINE POSITIONS IN THE SPECTRUM OF 12C16O Line Position (cm-1)a Line Position Difference (cm-1)b J J’
2115.632 7 6 2119.681 4.049 ± 0.002 6 5 2123.700 4.019 ± 0.002 5 4 2127.684 3.984 ± 0.002 4 3 2131.633 3.949 ± 0.002 3 2 2135.548 3.915 ± 0.002 2 1 2139.427 3.879 ± 0.002 1 0 2147.084 7.657 ± 0.002 0 1 2150.858 3.774 ± 0.002 1 2 2154.599 3.741 ± 0.002 2 3 2158.301 3.702 ± 0.002 3 4 2161.971 3.670 ± 0.002 4 5 2165.602 3.631 ± 0.002 5 6 a
The uncertainty in the line position is ± 0.001 cm-1. b
The uncertainty in the difference is ± 0.002 cm-1.
Determining Associated Quantum Numbers. [NOTE THAT I CREATED A HEADING FOR THIS SUBSECTION TO MAKE IT CLEAR TO THE READER THAT I AM DISCUSSING SOMETHING SPECIAL. I DID NOT NUMBER THE SUBSECTION. Sometimes there are special considerations of data reduction. You should explain these clearly and concisely in a section of the results and discussion, as shown below.] One
difficulty in resolving the data in the vibration-rotation spectroscopy experiment is determining the quantum numbers associated with each transition. For diatomic molecules, the J=0 ↔ J=0 transition is forbidden and will be absent from the spectrum. This makes the separation of the first transition of the R branch from the first transition of the P branch approximately twice the spacing of the other transitions (which are otherwise roughly equally spaced). Examination of the difference between the line positions (second column of Table I) reveals that the lines are not exactly equally spaced. In particular, the two transitions at 2139.427 cm-1 and 2147.084 cm-1 have a much wider separation than the others. It is reasonable to assign these two transitions to J=1→J’=0 and J=0→J’=1, one from the P branch and one from the R branch. Once that assignment is made, assigning J and J’ for each of the other transitions is straightforward, since each transition corresponds to the rd and fourth rows of Table 1.
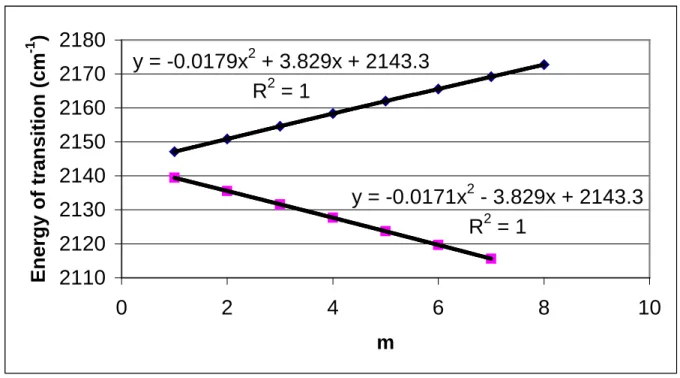
Analyzing the Branches to Obtain Parameters. [NOTE THAT A NEW SUBSECTION IS STARTED BECAUSE THIS IS ANOTHER PHASE OF THE ANALYSIS.] The energies of transition are expected to follow equations (1), where m is either J or J’, depending on the branch: ) 1 ( ) 1 ( ) 1 ( ) 1 ( 0 1 0 0 1 0 + − − + = ∆ − − + + = ∆ m m B m m B E m m B m m B E P R ω ω . (1)
In this equation, the definitions of the parameters are as follows: Bn is the rotational constant for the vibrational state with quantum number n and ω0= ωe– 2xeωe. Expansion of the first of these equations gives equation (2), a second-order equation in m:
2 0 1 0 1 0 (B B )m (B B )m ER = + + + − ∆ ω . (2)
A similar equation can be found by expanding the second equation. From a plot of ∆ER versus
m, one determines the values of B1, B0, and ω0 from the best-fit coefficients. An EXCEL graph of the data is given in Figure 1, showing plots for the R and P branches.
In EXCEL, one may arrange to show the best-fit equation on the graph, and this is done in Figure 1. Note the correlation coefficient, which shows that these are excellent fits to the data. [NOTE: ALL FIGURES SHOULD BE NUMBERED CONSECUTIVELY THROUGHOUT THE REPORT. EACH FIGURE SHOULD HAVE A CAPTION BELOW IT THAT SHOULD CLEARLY STATE THE NATURE OF THE INFORMAITON IN THE FIGURE.]
The coefficients in these fits give values for the rotational and vibrational parameters of carbon monoxide by a simple algebraic transformation. The results for the R branch are given below: R Branch:
ω0 = 2143.3 (±0.1) cm-1
B1 + B0 = 3.829 (±0.001) cm-1
B1 – B0 = -0.018 (±0.001) cm-1
These result in simultaneous equations for the parameters. Solving these gives:
B1 = 1.905 (± 0.0014) cm-1
B0 = 1.924 (± 0.0014) cm-1
Note that uncertainties are reported for each of these values. With these numbers, the equilibrium rotational constant and the rotation-vibration coupling constant are determined:
αe = B0 – B1 = 0.0179 (± 0.002) cm-1 (3)
Be = ½ (3B0 – B1) = ½ (3(1.924 cm-1) – 1.905 cm-1) = 1.933 (± 0.008) cm-1. (4) The data are summarized in Table 2, along with values from the literature.
It is sometimes helpful to summarize results in a table.
TABLE 2. SUMMARY OF RESULTS FROM INFRARED SPECTROSCOPY OF 12C16O Parameter Experimental Value Literature Valuea
ωe – 2xeωe 2142.2 ± 0.1 cm-1 2143.3 cm -1 Be 1.933 ± 0.008 cm-1 1.9313 cm-1 αe 0.018 ± 0.002 cm-1 0.01748 cm -1 Re 0.1128 ± 0.0007 nm 0.11281 nm a
From Gordy, W.; Smith, W. V.; Trambarulo, R. F. Microwave Spectroscopy; Dover Publications: New York, 1953.
The Bond Length. From knowledge of Be, the parameter Re can be calculated from the definition of the equilibrium rotation constant:
Ic h
Be 2
8π
= , (5)
where I is the moment of inertia, c is the speed of light in a vacuum, and h is Planck’s constant. Rearranging this equation, one calculates the moment of inertia of CO:
2 46 8 1 2 34 10 * 4489 . 1 sec / 10 * 99792458 . 2 * 3 . 193 * * 8 sec 10 * 6260755 . 6 m kg m m joule I = − − = − − − π
Since the uncertainty in the constants is much smaller than the uncertainty in the measured value of Be, only the uncertainty in this latter quantity makes a significant contribution to the
y = -0.0179x
2+ 3.829x + 2143.3
R
2= 1
y = -0.0171x
2- 3.829x + 2143.3
R
2= 1
2110
2120
2130
2140
2150
2160
2170
2180
0
2
4
6
8
10
m E n erg y o f t ran si ti o n ( cm -1 )Figure 1. Plots of line-position differences versus m for the R and P branches of carbon monoxide.
uncertainty in I. One may estimate this by percentage (about 1.3%), so the result for the moment of inertia is:
I = 1.4489 (± 0.019) × 10-46 kg-m2.
To determine Re requires knowledge of the reduced mass of 12C16O. The exact masses of the two atoms can be found from standard references.2 The values are
mC = 0.012000000 kg, exactly
mO = 0.0159949146 kg,
with an assumed uncertainty of 1 in the last digit. From these, one obtains the reduced mass:
kg kg 26 23 1.1385009*10 10 * 0221367 . 6 * ) 0159949146 . 0 012 . 0 ( 0159949146 . 0 * 012 . 0 = − + = µ
Finally, the value of Re can be calculated as:
m kg m kg Re 10 26 2 46 10 1281 . 1 10 1385009 . 1 10 4489038 . 1 − − − × = × − × =
One may show, if the uncertainty arises only from the determination of the moment of inertia, that: I I R R e e = ∆ ∆ 2 1 . (6)
so the percentage error is one half that for the moment of inertia, or 0.7%. So, the value of the interatomic distance is:
Re = 0.1128 (± 0.0007) nm.
This compares favorably to the reported value of 0.11282 nm in Table 2.
Theoretical Predictions of Parameters. The values of the various parameters were calculated using GAUSSIAN-98.3 The calculation was carried out in a restricted Hartree-Fock model, using the 6-31G(d) basis set. First, the bond distance was optimized. From the data generated, a plot of energy versus bond length was constructed. [At this point you may wish to insert a figure that shows the variation of energy with bond length. Do not forget to reference the figure in the text.] From the variation of energy with bond distance, the optimal distance is found to be 0.11138 nm, not too different from the experimentally determined value. The program also predicts the rotational constant for this configuration, which in this case it gave as 59.4205597 GHz. Converting this number to the standard units used throughout this report, Be = 1.982 cm-1. Again, this is a little high, compared to the value determined experimentally.
TABLE 3. COMPARISON OF CALCULATED AND EXPERIMENTAL PARAMETERS FOR CARBON MONOXIDE
Parameter Calculated with GAUSSIAN Experimentala
Re 0.1114 nm 0.1128 nm Be 1.982 cm-1 1.933 cm-1 ωe 2439.0 cm -1 ωe – 2xeωe 2141.4 cm -1 a
Note that I have not included uncertainties in these data. You would be expected to report uncertainties in any experimental data that you report.
In a second calculation, the harmonic frequency for this geometry was determined to be 2439.0288 cm-1. In Table 3, the experimental and theoretical results are summarized. One cannot experimentally determine the harmonic frequency from this experiment alone, so the experimental band center is given for comparison.
You may include a paragraph or two with your concluding observations and comments. It is often convenient to reiterate the results in text form. Summarizing the laboratory experiment, including any problems that may have arisen, is a good practice.
Discussion Questions
In this section, you write each of the discussion questions in order, immediately following each question by a brief answer. The length of the answer varies from question to question, and the length of this section varies from experiment to experiment.
You may include references in a section at the end of the report. All references must be in the style of the ACS Style Guide. Do not put in references to Internet sites; use original books or articles as the primary reference, even if the information is gotten through the Internet.
Appendices
From report to report, it may be necessary to append various data and/or calculations to the end of the report. As an appendix to my example report, I present some points about a report that you should consider:
1. Be consistent about the style of capitalization of titles of figures, tables, and sections of a report.
2. Use the ACS Style Guide (parts of which are available on line) for the proper format of references. Note that the style
3. Do not use jargon or shortened forms of words in a formal report. Words like “lab” and “LN2” should not appear in a report.
4. If you use abbreviations, you must use the full word the first time, followed by the abbreviation in parentheses. Subsequently you may use only the abbreviation.
5. Do not “overwrite”. By that I mean that you should state results simply, in words, the meanings of which you understand clearly. Do not write a long explanation of the experimental theory or technique when a single sentence will do. Above all, do not try to use a complex word unless you are sure of the meaning. Check a dictionary to be sure of the meanings of words.
6. Uncertainty is a part of the report of any measurement or calculation. Determine the uncertainty and report it as part of any parameter.
7. Number figures and tables consecutively through the report.
8. Tables and figures should be placed adjacent to the place of first mention. However, they may be moved a slight distance away if that keeps one from wasting space at the bottom of a page. In general, do NOT put figures and tables into appendices. [An exception is a table of raw data that must be reported.]
9. All units should be written in a table, either in each entry or as part of the title of a column. The first kind of entry is appropriate if you are making a table of different parameters, such as Table III of this report. For tables of numbers that are all the same, it
is more appropriate to include the label as part of the title, and only put numbers as entries in the cells. An appropriate title for a column of equivalent conductivities might be Λ/(S*m2eq-1), for example.
10. Data in tables should be expressed as simple numbers (1.732) or in scientific notation (1.732×10¹⁶), not in calculator notation.
11. Report data only to the appropriate number of significant figures, depending on your data. Remember that EXCEL sometimes truncates numbers to fewer figures than appropriate, and you must correct for that truncation if you are writing a table with EXCEL into your report.
12. Handwritten parts of a report are not acceptable.
13. Take sufficient time to make sure that your report prints out appropriately. You cannot just print out the report and turn it in; you should have read it over after printing to make sure that the formatting and symbols have not changed in the printing (something that does happen).
14. Check for “widows,” lines such as titles that stand alone at the bottom of a page, and “orphans”, a single line of a paragraph that stands alone at the top of a page. Rearrange your report to make sure you have no widows or orphans.
15. Do not let tables be broken onto two pages. This may necessitate moving the table a bit from its first mention. What I frequently do, if this happens, is put it either so the last line of the table is at the bottom of one page or so that that the table starts at the very top of a page. This can be done in WORD by moving the table relative to the text.
References
1Noggle, J. H. Physical Chemistry, 3rd Edition; Harper-Collins: New York, 1996, p. 835. [NOTE THE FORMAT
OF ENDNOTES; THIS FORMAT SHOULD BE USED AT ALL TIMES.]
2
For example, see Table 13.2 in Noggle, J. H. Physical Chemistry, 3rd Edition; Harper-Collins: New York, 1996.
3 Gaussian 98, Revision A.7, M. J. Frisch, G. W. Trucks, . B. Schlegel, G. E. Scuseria, M. A. Robb, J. R.
Cheeseman, V. G. Zakrewski, H. A. Montgomery, Jr., R. E. Stratmann, J. C. Burant, S. Dapprich, J. M. Millam, A. D. Daniels, K. N. Kudin, M. C. Strain, O. Farkas, J. Tomasi, V. Barone, M. Cossi, R. Cammi, B. Mennucci, C. Pomelli, C. Adamo, S. Clifford, J. Ochterski, G. A. Petersson, P. Y. Ayala, Q. Cui, K. Morokuma, D. K. Malick, A. D. Rabuck, K. Raghavachari, J. B. Foresman, J. Cioslowski, J. V. Ortiz, A. G. Baboul, B. B. Stefanov, G. Liu, A. Liashenko, P. Piskorz, I. Komaromi, R. Gomperts, R. L . Martin, D. J. Fox, T. Keith, M. A. Al-Laham, C. Y. Peng, A. Nanayakkara, C. Gonzalez, M. Challacombe, P. M. W. Gill, B, Johnson, W. Chen, M. W. Wong, J. L. Andres, C. Gonzalez, M. Head-Gordon, E. S. Replogle, and J. A. Pople, Gaussian, Inc., Pittsburgh, PA, 1998.