PCOM Psychology Dissertations Student Dissertations, Theses and Papers
2012
Positive Behavior Support and Intervention
Programs vs Responsive Classroom Programs:
Impact on Perceptions of School Climate
Erica M. Rell Backenson
Philadelphia College of Osteopathic Medicine, [email protected]
Follow this and additional works at:http://digitalcommons.pcom.edu/psychology_dissertations Part of thePsychology Commons
This Dissertation is brought to you for free and open access by the Student Dissertations, Theses and Papers at DigitalCommons@PCOM. It has been accepted for inclusion in PCOM Psychology Dissertations by an authorized administrator of DigitalCommons@PCOM. For more information, please [email protected].
Recommended Citation
Rell Backenson, Erica M., "Positive Behavior Support and Intervention Programs vs Responsive Classroom Programs: Impact on Perceptions of School Climate" (2012).PCOM Psychology Dissertations.Paper 238.
Philadelphia College of Osteopathic Medicine Department of Psychology
POSITIVE BEHAVIOR SUPPORT AND INTERVENTION PROGRAMS VS. RESPONSIVE CLASSROOM PROGRAMS: IMPACT ON PERCEPTIONS OF
SCHOOL CLIMATE
By Erica M. Backenson
Submitted in Partial Fulfillment of the Requirements of the Degree of Doctor of Psychology
Jessica Kendorski, PhD, Chairperson Yuma Tomes, PhD
Barbara B Williams, PhD
Acknowledgements
It is my privilege to thank my family and friends for their support and kindness
throughout this journey. I want to thank my parents, John and JoAnn, and my siblings, Andrea, Kevin, and Ilya, for their encouragement and support throughout this journey. I especially want to thank my chair, Dr. Jessica Kendorski, for her time, patience, and guidance throughout this process. I also want to thank my other committee members, Drs. Tomes and Williams, for their guidance and encouragement in helping me reach this milestone. Finally, I would like to thank my friend and colleague, Dr. James B. Hale, for his guidance, insight, and constant support throughout this process.
This dissertation is dedicated to my grandmothers, Doris and Olga, with love and honor. Thank you for always believing in me and having faith in my dreams.
Abstract
School climate is an aspect of school life that has been examined closely in recent literature as it related to student interactions, behavior, and student achievement. A number of factors that affect school climate have been identified; these include student/teacher relationships, school safety and student relations, clarity of a school’s expectations, perceived fairness of school rules, and the presence of a strong, well-developed and widely-accepted behavior program in a school. Both Positive Behavior Intervention and Support (PBIS) programs and Responsive Classroom (RC) programs have been identified as having a positive impact on school climate at multiple grade levels and across demographics. The Delaware School Climate Survey (DSCS) is a tool that has been used across the state over multiple years to examine perceptions of school climate in multiple informant groups: teachers and staff members, parents and guardians, and students. This study evaluates the Delaware School Climate Survey results both in a PBIS elementary school and in a RC elementary school to examine the perceptions of school climate between informant groups and across the two school intervention programs. Results of the study found that perceptions of school climate were
predominantly higher overall in the PBIS school, compared with the RC school. At the domain level, results showed that teachers, parents, and students in the PBIS school reported higher scores in the areas of Teacher/Student Relations, Student Relations and Safety, Fairness of Rules, and Clarity of Expectations domains.
Table of Contents
List of Tables ix
List of Figures x
Chapter 1: Introduction 1
Statement of the Problem 3
Purpose of the Study 5
Research Questions 5
Chapter 2: Literature Review 7
Positive Behavior Support and Intervention Programs 7 Levels of Positive Behavior Intervention and Support programs 9
Tier I: Universal Implementation 9
Tier II: Secondary Level of Support 10
Tier III: Tertiary Level of Support 11
Effective Implementation of PBIS Programs 11
Establishing Needs and Goals 11
Necessary Elements of a School-wide PBIS Program 14
Universal PBIS Supports. 14
Secondary and Tertiary Supports 15
Tier II Interventions 15
Tier III Interventions 17
Summary of PBIS in the Schools 18
Responsive Classroom Programs 18
Effective Classroom Practices 19
Effectiveness of RC Programs 21
PBIS and RC Programs in the Classroom 21
Research Questions and Hypotheses 23
Research Question 1. 23 Research Question 2. 23 Research Question 3. 23 Research Question 4. 24 Chapter 3. Methods 25 Participants 25 Teachers/Staff 25 Parents/Guardians 25 Students. 26 Measures 26
Schoolwide Evaluation Tool – Delaware version 26
Responsive Classroom Evaluation Tool 27
Delaware School Climate Survey 27
Procedures 29
Analysis 31
Chapter 4. Results 32
Fidelity of Implementation 32
DSCS descriptive statistics and zero-order correlations 33 Multivariate Examination of Main Effects and Interaction Effects 35
Research Question 1. 35
Domain Level Interpretation of Main and Interaction Effects by Subscale 36
TSR Subscale 36 SRS Subscale 37 FR Subscale 38 CE Subscale 39 Research Question 2. 40 Research Question 3. 41
Domain Level Interpretation of Main and Interaction Effects by Informant 42
Research Question 4. 43
Teacher/Student Relations Domain 44
Student Relations and Safety Domain 45
Fairness of Rules Domain 46
Clarity of Expectations Domain 47
Chapter 5. Discussion 48
Overall Conclusions 48
Teacher/Student Relations Domain 48
Student Relations & Safety Domain 50
Fairness of Rules Domain 52
Clarity of Expectations Domain 54
Limitations and Future Research 56
References 59
Appendix B. Delaware School Climate Survey – Home Version 74 Appendix C. Delaware School Climate Survey – Student Version 76
List of Tables
Table 1. Sample Population Demographic Information 25
Table 2. Reliability Coefficients for the DSCS 28
Table 3. DSCS descriptive statistics and zero-order correlations for entire sample 34 Table 4. Univariate Analysis of Variance for TSR Domain on the DSCS 37 Table 5. Univariate Analysis of Variance for SRS Domain on the DSCS 38 Table 6. Univariate Analysis of Variance for FR Domain on the DSCS 39 Table 7. Univariate Analysis of Variance for CE Domain on the DSCS 40
Table 8. Main Effects for DSCS subscales and School 41
Table 9. Main Effects for Informant Broken Down by DSCS subscales 42 Table 10. Interaction Effects Between Intervention and Informant in the TSR Domain 44 Table 11. Interaction Effects Between Intervention and Informant in the SRS Domain 45 Table 12. Interaction Effects Between Intervention and Informant in the FR Domain 46 Table 13. Interaction Effects Between Intervention and Informant in the CE Domain 47
List of Figures
Figure 1. SET-D Scores for the PBIS School across a three-year timeframe 32 Figure 2. RCAT Scores for the RC School across a three-year timeframe 33
Positive Behavior Support and Intervention Programs vs. Responsive Classroom Programs: Impact on Perceptions of School Climate
Chapter 1 Introduction
Positive behavior intervention and support (PBIS) programs intended for school-wide implementation have become increasingly prevalent in recent years. School districts throughout the United States have adopted variations of these programs as a means to address the growing number of disciplinary referrals and problem behaviors within their schools. Positive behavior intervention and support programs are “…a proactive, systems-level approach that enables schools to effectively and efficiently support student (and staff) behavior” (Simonsen, Sugai, & Negron, 2008, p. 33). Research has demonstrated that the implementation of a primary, systems-level
intervention program increases positive interactions (Safran & Oswald, 2003), decreases office discipline referrals (Turnbull et al., 2002), and increases consistency among staff with regard to response to problem behaviors (Netzel & Eber, 2003).
Since the introduction of PBIS programs throughout the country, alternative methods of teaching and of supporting prosocial behavior in the schools have been developed. One of these particular methods is titled the Responsive Classroom (RC) program. Responsive Classroom (RC) programs are designed to "...address children’s psychological, social, and emotional needs to create an environment that fosters children’s engagement in school and bolsters academic achievement as well as social, emotional, and behavioral growth" (Brock et al., 2008).
The RC approach is based on the premise that encouraging and supporting positive peer relationships and interactions will decrease conflict amongst students as well as with teachers (Horsch, Chen, & Wagner, 2002). Similar to a PBIS program, general positive rewards are provided to students when they display prosocial behaviors within the school setting.
The outcomes of multiple research studies have produced strong empirical support for the implementation both of PBIS programs and of RC at an early age (Gamel-McCormick, Amsden, & Hartranft, 2005; Noell et al., 2005; Scott, 2007). Specifically, evidence supports the notion that the younger a child is introduced to PBS and/or RC standards and practices, the more effective these programs will be over time (Horner, Sugai, & Anderson, 2010; Lane, Kalberg, Bruhn, Mahoney, & Driscoll, 2008; Reynolds et. al., 2007). In discussions, all of the aforementioned studies indicated that prevention of problem behaviors is most effective prior to the manifestation of
externalizing behaviors. Furthermore, research on the age of students and the grade level at the time of implementation (i.e., elementary, middle, or high school level) has been found to impact the effectiveness and commitment both of the staff and of the students within the school (Handler et al., 2007). Handler and his team of researchers found that staff buy-in and support for PBIS programs is stronger at the elementary level rather than at the middle or high school levels.
In addition to the age at which a child is first introduced to the principles of a PBIS and/or a RC program in a school setting, parental involvement in their child’s academic career and within the school itself has been found to enhance the level of academic performance the child demonstrates (see Reynolds, 1992; Zellman &
Waterman, 1998; DePlanty, Coulter-Kern, & Duchane, 2007). Research indicates that elementary-aged children who have parents who are closely involved in their educational experiences demonstrated lower drop-out rates, higher academic achievement, and increased on-time completion of assignments when the student reaches high school (Barnard, 2004). Additionally, higher levels of parental involvement have also been found to correlate to higher levels of social skills in children (McWayne, Hampton, Fantuzzo, Cohen, & Sekino, 2004).
School climate is another variable that appears to impact student progress and overall school efficacy. School climate refers to the “quality and character of school life” which includes “norms, values, and expectations that support people feeling socially, emotionally, and physically safe” (Cohen, McCabe, Michelli, & Pickeral, 2009, p. 182). Research has shown the importance of a healthy school climate in achieving academic success (Johnson & Stevens, 2006) as well as in establishing an overall effective school (Pritchard, Morrow, & Marshall, 2005). A positive school climate has been associated with a reduction in reports of negative behaviors among students such as aggression (Aveyard et al., 2004), absences and suspensions (Gottfredson, Gottfredson, Payne, & Gottfredson, 2005), school violence (Deal & Peterson, 2005), and internalizing and externalizing behavior problems (Warren et al., 2006).
Statement of the Problem
There is a plethora of research supporting the strength and success of PBIS programs across grade levels (Luiselli, Putnam, & Sunderland, 2002; Nelson, Benner, Lane, & Smith, 2004). There is also substantial research to support RC programs as a means to address behaviors and student growth across multiple grades (Rimm-Kaufman,
2006). However, there currently is a small research base comparing the impacting effects of these two programs on school climate within one specific school district. Responsive Classroom programs and PBIS programs have been studied extensively in isolation of one another; research is needed to assess the impact that each of these programs has on similar schools within the same school district.
More information is needed to determine if a relationship exists between the effectiveness of an individualized, school-specific behavior program (either PBIS or RC), and reported levels of school climate within each, as reported by multiple sources. Specifically, an analysis is needed to determine if parent, student, and teacher
perceptions of school climate are aligned within a specific type of universal intervention program. Perceptions of school climate may vary between groups, and an examination of climate as it relates to positive intervention programs would be beneficial in helping a school plan and design effective programs.
School climate has been found to have a tremendous impact on student progress and achievement (Pritchard et al., 2005) as well as on pro-social behavior development and psychological well-being (Ruus et al., 2007). Additionally, a positive school climate has also been found to engage and elicit support from parents and the surrounding communities (Deal & Peterson, 2009). Research with regard to attracting parental engagement and collaboration and student perceptions in schools needs to be conducted to provide a clearer picture of school climate as it is affected by a universal behavioral program.
Purpose of the Study
The purpose of the study is to present and discuss the two positive intervention programs being implemented in the two schools, the Responsive Classroom program and the Positive Behavior Intervention and Support program. Upon reviewing the benefits of both types of programs and developing hypotheses of anticipated outcomes of the study, the purpose will be to determine if a relationship exists between school climate reports from teachers, parents, and students from two particular schools with regard to the type of behavior intervention implemented in the school. This study will also aim to establish whether or not a correlation exists between parent, teacher, and student reports of school climate in both of the individual schools.
Additionally, analysis regarding the differences in specific domains measured by the Delaware School Climate Survey (DSCS) both in a PBIS and in a RC school will be sought for the three specific surveys (teacher/staff, home, and student). To this end, the study will present an overview both of the PBIS process and of the RC process in the schools, and provide an overview of the elements of each program with regard to school climate. Furthermore, research will be presented on additional factors within schools that may impact the overall school climate.
Research Questions
Research Question 1: Are there differences among DSCS subscales (within subjects repeated measures effect), and is there an interaction effect between the DSCS subscales, intervention program, and Informant variables (three-way within and between subjects interaction effect)?
Research Question 2: Do perceptions of DSCS subscales differ between schools (Intervention main effect)?
Research Question 3: Do perceptions of DSCS subscales differ between staff members, parents, and students (informant main effect)?
Research Question 4: Is there an interaction effect between intervention program and informant report on DSCS subscale measures (between groups interaction effect)?
Chapter 2
Review of the Literature Positive Behavior Intervention and Support Programs
Positive behavior intervention and support (PBIS) programs were first introduced as a school-wide initiative in 1999. Lewis & Sugai (1999) examined previously collected data from multiple sources regarding behavioral problems, externalizing behaviors (e.g. aggression, hyperactivity, conduct problems, etc.), classroom removal, and discipline referrals as a means to develop a plan of action to decrease these problem behaviors. These researchers developed a program entitled "Effective Behavioral Support (EBS)", and in 1999 published an outline for school-wide implementation of this type of program, in conjunction with a blueprint for implementation, an overview of the central features of EBS, and a case study example. The purpose of their research was to develop and present an alternative to traditional discipline methods in response to problem behaviors and to introduce a proactive model to decrease difficult behaviors (Lewis & Sugai (1999, p. 7).
This was not the first time that an EBS-type program was discussed in literature. Previous research studies had examined this topic in depth in an attempt to develop a system for interrupting negative behaviors and promoting positive behaviors (Lewis, Sugai, & Colvin, 1998; Sugai & Lewis, 1996; Taylor-Greene et al., 1997). These research studies were conducted as a means to establish empirical evidence to support the
effectiveness of proactive measures in reducing problem behaviors in schools. Research was focused on reducing negative behaviors through preventative programs aimed at improving social skills in order to yield a reduction in anti-social, problem behaviors.
Initially, the introduction of EBS programs provided schools with two essential elements: a description of the approach to behavior within an EBS framework and three components that were considered crucial for effective implementation (Lewis & Sugai, 1999). According to Lewis & Sugai, “EBS is a systems approach to enhancing the capacity of schools to adopt and sustain the use of effective practices for all students" (p. 8). The fundamental components of EBS can be summarized as follows: 1. EBS is a team-based approach for systematic problem solving and planning; 2. EBS uses the application of research-validated instructional and management practices at all levels, and 3. EBS requires a commitment to on-going, meaningful professional development (p. 9). In order for an EBS program to make an impact on a school community, these components must be addressed.
EBS uses a multidisciplinary approach to service delivery that demands an efficient, needs-based system to match behavioral resources with specific student needs. Behavioral interventions are monitored for effectiveness and are adjusted as necessary, based on cumulative data collected throughout the process (Turnbull et al., 2002). A clear, common language and set of consequences is established, based on analysis of the
school’s specific area(s) of need, and expected behaviors are clearly displayed, explained, and reinforced regularly and with conviction (Turnbull et al., 2002, p. 386). The
movement from EBS to PBIS relative to terminology occurred naturally over time, and these terms may be used interchangeably; today, however, most of the programs are being referred to as PBIS rather than EBS (George & Kincaid, 2008).
PBIS is a three-tiered system with increasing levels, universal (primary care), secondary and tertiary support (Lewis & Sugai, 1999). Specifically, the PBIS team
develops strategies for targeting problem behaviors across settings (classrooms,
playground, cafeteria, bus, etc.), and adapts the strategies based on the needs of the school population by targeting the language of the program at a developmentally appropriate level for the school (Sugai & Horner, 2009). This three-tiered system focuses the most resources on the universal level of implementation, with increasing support in the secondary and tertiary levels of support; this approach mirrors the Response to Intervention (RtI) structure (Fairbanks, Sugai, Guardino, & Lathrop, 2007).
RtI is a preventative model of intervention that focuses on intervening on a multi-tiered level to reduce levels of academic failure and increase academic competency (Fairbanks, Sugai, Guardino, & Lathrop, 2007). RtI uses on-going data collection to measure individual student progress to determine if increased support strategies are necessary to improve a child’s learning. This increased support structure includes universal, class-wide teaching (tier 1), small-group supplemental instruction and
remediation of skills (tier 2), and finally a more individualized, differentiated method of instruction for students with the highest levels of need (tier 3) (Cheney,
Flower, & Templeton, 2008).
Levels of Positive Behavior Intervention and Support programs
Tier I: Universal Implementation. Effective development and implementation of PBIS within schools requires varying levels of support (Lewis & Sugai, 1999). These levels begin with the most universal, school-wide application of the program, in which the entire student population within a school district or building is targeted. At this universal level, school teams establish universal strategies and develop a common language for all members of the school community. As an example, the common
language being used within in the school being studied uses the terms ‘expected’ and ‘unexpected’ behaviors when describing actions and attitudes for which the students are responsible.
The school team is responsible for developing a consistent plan for handling behavior referrals or disciplinary actions in collaboration with the school’s
administrative team. This also includes adapting and extending the school-wide system to include non-classroom settings, such as the cafeteria, playground, bus and hallways. In a typical school, this universal level of support is sufficient, and studies have shown that, typically, almost 85% of the school population responds to these basic support strategies (Lane et al., 2008; Utley et al., 2002; Warren et al., 2003).
Tier II: Secondary Level of Support. Although the majority of current research on PBIS programs focuses on interventions at the universal level, there ultimately will be students who require supplemental support to reap the benefits of positive social interactions (Lewis & Sugai, 1999). At this secondary level, supplemental interventions are utilized to provide more intensive support to those students who do not fully respond to the universal program. Typically, this group is made up of 5-14% of the school population, and may consist of those students who present with significant risk factors; these may include poor academic achievement, limited family or community support, or poor peer relational skills (Lewis, Jones, Horner, & Sugai, 2010). These students typically require repeated practice of specific social skills and potential
environmental modifications (e.g., change of seat, change of classroom) to increase the likelihood of academic and social success (Lewis & Sugai, 1999).
Tier III: Tertiary Level of Support. At this third and most intensive level, the group consists typically of 1-4% of the school population (Lewis, Jones, Horner, & Sugai, 2010). This small group of students requires intensive, individualized behavior support in order to achieve success within the school setting. As with the secondary-level support group, this group of students requires more than simply the basic, universal PBIS program. Students identified as needing tertiary supports typically have multiple disciplinary infractions, perform poorly or below average in the classroom, and are viewed as lacking in social skills. This group of students needs targeted and highly specific strategies to address their chronic maladaptive behaviors. Support at this highly intensive level must focus on behavior modification and an individualized approach to the problem (Scott, Alter, Rosenberg, & Borgmeier, 2010).
Effective Implementation of PBIS Programs
Establishing Needs and Goals. When a school or district recognizes the need for a positive approach to discipline and behavior, it becomes important to ensure maximum impact of the PBIS programs. A key to ensuring that the most effective practices are being implemented with a PBIS program is to provide staff with the proper training and professional development opportunities to become familiar with the
program (OSEP, 2004). Staff members need to be instructed by using a research-based program that exhibits all the components of best practices in implementing a universal program within school settings. Additionally, school staff needs the time and
administrative support to develop a common language that will be used within the school, and also a set of uniform consequences for the display of problematic behaviors.
Successful implementation of a PBIS program involves developing the use of this common language throughout a school regarding expected behaviors, common practices for handling problem situations and handing out discipline, and consistent application of positive reinforcement (Lewis & Sugai, 1999). The crux of the PBIS philosophy is that all children and adolescents are capable of displaying appropriate and expected behaviors across settings (OSEP, 2004). Because of this, one of the driving forces of PBIS programs focuses on providing a safe, supportive, and respectful school community that fosters and praises positive behaviors. This may include changing the climate of schools from one of reactive measures to discipline infractions and behavioral problems to one of proactive approaches to change behavioral patterns (McIntosh, Filter, Bennett, Ryan, & Sugai, 2010).
It is necessary at the preliminary stages of planning for PBIS implementation to conduct an assessment of the specific needs of the school or district. That is, what will be the focus of the program? What is not working that needs to be tweaked or
approached from a different angle? These answers are normally solicited by using a needs assessment technique. This stage of program planning involves gathering
information from all involved parties; these could include people from the teaching staff, from office and custodial staff, para-educators or classroom aides, related service
providers, administrators, parents, community members, and even the students themselves.
A targeted needs assessment protocol was developed in conjunction with the PBIS implementation plan by Lewis & Sugai (1999). This needs assessment tool, the Effective Behavior Supports Survey (EBSS), was developed as a means to assist schools
and districts in evaluating areas of need within their institutions and to determine what level of support their schools most need, whether it be at the universal, secondary, or tertiary level (Lewis & Sugai). The EBSS was designed to be used by school personnel during the initial planning stage to assess the current status of support within the school and to determine where the need lies for additional support (Safran & Oswald, 2003).
Safran (2006) describes the needs assessment process as “…a multifaceted, dynamic process that should consist of multiple data sources and practitioner
contributions” (p. 3). In his study on the validity of the needs assessment tool designed by Lewis & Sugai (1999), Safran examines the use of the EBSS as a means to gather relevant information for tailoring specific PBIS programs for specific areas or levels of need. In addition, Safran examined the current status of multiple levels (e.g., in place, partially in place, not in place) at which specific features, or needs, were being addressed and targeted, and the priority with which each improvement need would be addressed (e.g., low, medium, high) within each of three elementary schools (p. 5). Results of this study found that the improvement of quality, evidence-based interventions in the classroom was the highest priority with all schools surveyed, and that the formal classroom area was also the environment in which the interventions were being utilized most often, as opposed to non-classroom settings (p. 6).
Safran’s (2006) study provides valuable information because he demonstrated the reliability and validity of the EBSS. Specifically, Safran was able to provide statistically significant alpha levels for internal consistency at the subscale level (p. 7). This support for the EBSS as a respectable and reliable evaluation tool provides schools that are
striving for PBIS implementation with a springboard from which to conduct a valuable and reliable needs assessment.
Necessary Elements of a School-wide PBIS Program. After a needs assessment has been conducted and target goals identified, the focus of PBIS
implementation shifts from assessment to program development. Lewis & Sugai (1999) outline six essential elements that must be determined by the PBIS team within a school. These elements are: 1. A statement of purpose; 2. Development of school-wide
expectations; 3. Procedures for teaching these school-wide expectations; 4. A continuum of procedures for encouraging positive behavior; 5. A continuum of procedures for discouraging negative behaviors, and 6. Procedures for monitoring the impact of the school-wide PBIS program (p. 6). These six essential elements of PBIS program
development on an individual school level are crucial in establishing a well-rounded and complete PBIS program.
Universal PBIS Supports. After the target behaviors and the six essential elements are outlined and clearly defined by the school PBIS committee, it becomes the job of the school-wide team, as well as all school staff, to develop strategies and lessons for teaching setting-specific, expected behaviors at the universal level (Hendley, 2007). Studies have found that this is most effective when behavioral expectations are introduced uniformly by way of a common series of social skills lessons (Lewis et al., 1998;
Algozzine & Algozzine, 2007; Sugai & Lewis, 1996).
After skills are taught for specific settings and with certain scripts, they must be reinforced and rehearsed using multi-modal methods of teaching, including teacher
& Lewis, 1996). A crucial element to ensure that these skills are maintained and
sharpened by the students is frequent repetition (Scott, Park, Swain-Bradway, & Landers, 2007). This may be done by incorporating elements of the social skills lessons into other areas of the curriculum. One approach to doing this would be to have students create posters illustrating school rules in art class (Lewis & Sugai, 1999).
Secondary and Tertiary Supports. In certain cases, this universal implementation may not reach all students effectively. This typically occurs when a student has a history of behavioral issues, especially if those behaviors are physically aggressive in nature (Warren et al., 2003). It is estimated that approximately 15-20% of students will fall into these Tier II and Tier III categories. The difference between Tier II and Tier III is the level of intensity and individuation that goes into planning the specific interventions. Tier II programs are typically conducted in a small-group format, but Tier III interventions are tailored to an individual (Warren et al).
Tier II Interventions. Tier II PBIS programs are designed for those students who need a more specifically targeted approach and direct instruction to reap fully the benefits of a PBIS program. At the Tier II level, collaborative problem-solving becomes essential in developing an intervention that meets the needs of the child. Cheney et al. (2010) performed a study that examined the effectiveness of a Tier II program entitled Check, Connect, and Expect (CCE) program. This program, which is geared towards students who have been identified as being at-risk for developing more problematic behaviors, is based on over 15 years of research-supported evidence conducted by Check & Connect (C&C) (Sinclair et al., 1998). The program, based on studies conducted in
recent decades, concluded that the quality of students’ relationships with school staff is related to student outcomes (Murray & Malmgren, 2005; Carr, 2007).
The CCE program, which focuses on relationship building with students, is led by coaches within the school (Cheney et al., 2010). In the study, which was implemented at the elementary-school level, coaches were identified as individuals who had a history of positive interactions with students and were willing to further enhance these relationships. The job of the coach is to check in frequently with students and to provide them with specific feedback on their academic and social progress. The coach also helps students set daily social goals for success and provides students with reinforcement when they meet their goals. In addition to supervising the daily progress of students, the coach helps students to overcome social difficulties and acquire new social skills in order to be successful in school (Cheney et al., p. 153). Students are taught to self-monitor their behavior before graduating from the program. The coach is responsible for providing these services and serves as a positive role model for students with behavioral problems that interfere with students’ school success (Cheney et al).
Positive results were yielded from the CCE program for identified at-risk students (Cheney et al., 2010). Teachers in this study reported that they found the program to be beneficial for overall classroom management, and they reported appreciation for the program. Overall, the researchers found an 84% success rate over a two-year period in decreasing negative behaviors and improving social skills and positive behaviors (p. 157). Although this is only an example of one program being implemented at the Tier II level, it supports the general PBIS goal of providing useful strategies and increased assistance for
students who need a more structured and supportive program to decrease problem behaviors.
Tier III Interventions. PBIS interventions at the Tier III level are designed to individually address a very small population within the school setting, specifically between three to five percent. At this highest level of intervention, the use of Functional Behavior Assessments (FBAs) and Behavior Support Plans (BSPs) is considered the most appropriate practice for establishing an individualized intervention and support program (Baker, 2005; March & Horner, 2002; Sugai et al., 2000). Tier III services begin with an FBA, which serves as a data-gathering tool to compile the information for the development of an effective intervention plan. The FBA identifies target behaviors for intervention and determines antecedent situations or settings to the behaviors; from the FBA, the school team develops an intervention plan to decrease the maladaptive target behaviors, or a BSP (Scott, Alter, Rosenberg, & Borgmeier, 2010).
To examine the use of FBAs and BSPs at the Tier III level, March and Horner (2002) performed a study focusing on three students in a suburban middle school. These students were selected, based on a lack of response to Tier I and II interventions, on having five or more disciplinary infractions within the first four months of school, and on having been nominated by the school’s intervention team (March & Horner, 2002). FBAs were conducted for each of these three students, and baseline levels were established from which individualized interventions were designed and implemented. The results of this study determined that the FBAs were useful in two areas: 1. Decreasing problem behaviors, and 2. Increasing academic engagement. The authors concluded that success of a PBS program at the Tier III level requires specific,
individualized teaching of skills to increase prosocial behaviors and to decrease negative interactions (March & Horner,
Summary of PBIS in the Schools
Research points to PBIS as being an effective means to increase positive behaviors in students (Liaupsin et al., 2000; Gamel-McCormick et al., 2005).
Interventions implemented at the universal level, that is to all students, are proven to improve student interactions and to create a more positive and prosocial environment. These universal interventions generally reach approximately 80% of the student population. However, more intensive and directed approaches are necessary for the remaining 20% of students, depending on their level of need. The PBIS structure and philosophy have helped shape the direction of schools by providing all students with a system of reinforcement and reward for exhibiting positive behavior.
Responsive Classroom Programs
The Responsive Classroom (RC) approach to instruction and behavior
intervention was developed by the Northeast Foundation for Children (NEFC) in 1981 (NEFC, 2006). The NEFC was founded by four elementary school teachers as a means to explore ideas for teaching children positive social and behavioral skills throughout the school day (Rimm-Kaufman & Chiu, 2007). This group of teachers shared the belief that children learn best when they are able to regulate themselves and manage their
interactions with others. The NEFC also supported the belief that children are able to access the curriculum and learn only when they are free from social stress and behavioral distractions (NEFC, 2006).
The RC approach is grounded in a series of guiding principles, which were determined using research from educational theory and developmental psychology (NEFC, 2006). These seven principles from the NEFC are as follows: 1. The social and academic curricula are equally important; 2. How children learn is as important as what they learn; 3. Social interaction facilitates cognitive growth; 4. Children need to learn cooperation, assertion, responsibility, empathy, and self-control if they are to be
successful socially and academically; 5. Knowing children individually, culturally, and developmentally is essential to good teaching; 6. Knowing children’s families is
essential to good teaching, and 7. The working relationships among adults in school are critically important to how well children learn (Rimm-Kaufmann & Chiu, 2007, p. 402). These principles were developed by the leaders at the NEFC as a backdrop for the ideal RC program.
Levels of Implementation for the RC Approach
The Responsive Classroom approach is designed to be implemented at the universal level. The design of the RC consists of ten daily steps or classroom practices (Sobel & Taylor, 2006). These classroom practices are designed to be implemented on an on-going basis, and to serve as a structure for the classroom and for the teacher’s interaction with students and families.
Effective Classroom Practices. These classroom practices from the NEFC (2006) are as follows:
• Morning Meeting—gathering as a whole class each morning to greet one
another, share news, and warm up for the day ahead.
members to meet their learning goals.
• Interactive Modeling—teaching children to notice and internalize expected
behaviors through a unique modeling technique.
• Positive Teacher Language—using words and tone to promote children’s active
learning and self-discipline.
• Logical Consequences—responding to misbehavior in a way that allows
children to fix and learn from their mistakes and to preserve their dignity.
• Guided Discovery—introducing materials using a format that encourages
creativity and responsibility.
• Academic Choice—increasing student motivation by differentiating instruction
and allowing students teacher-structured choices in their work.
• Classroom Organization—setting up the physical room in ways that encourage
independence, cooperation, and productivity.
• Working with Families—hearing families’ insights and helping them
understand the school’s teaching approaches.
• Collaborative Problem Solving—using conferencing, role playing, and other
strategies to engage students in problem-solving.
Unlike PBIS programs, which provide tiered, increasingly intensive support for children, the RC program does not provide interventions for individual students. Responsive Classroom programs are geared to be proactive in creating a supportive environment for students; however, support is not designed in the RC program beyond the universal level (Weisz et. al., 2005).
Effectiveness of RC Programs
Responsive Classroom programs have been evaluated in multiple settings. Recent studies indicate that the RC approach has been shown to improve a number of areas, including student academic achievement in reading and math (Rimm-Kaufman, Fan, Chiu, & You, 2007), reducing problem behaviors (Elliott, 1999), improving social skills (Rimm-Kaufman & Chiu, 2007), and improving students' attitudes towards school (Zins, Bloodworth, Weissberg, & Walberg, 2004). Additionally, research suggests that
programs which support social and emotional development in addition to academic achievement can have a more significant impact across demographic levels than traditional classroom teaching methods (Denton & West, 2002). The RC program also has been shown to have benefits over time; children experiencing high levels of implementation of this program in elementary school showed higher achievement test scores and grade point averages compared with a comparison group during middle school (Battistich, Schaps, & Wilson, 2004).Therefore, effectiveness of RC programs has been documented across grade levels, demographic groups, and in multiple areas.
PBIS and RC Programs in the Classroom
A different approach to implementing both PBIS and RC programs within the classroom focuses on the major player in the classroom, the teacher. Previous research regarding teacher roles in PBIS yielded multiple conclusions in terms of the significance and scope of results. For example, student behavior has been shown to relate to teacher fidelity of intervention implementation (Noell et al., 2005), use of effective commands (Matheson & Shriver, 2005), and provision of specific and contingent praise (Keller, Brady, & Taylor, 2005; Sutherland, Wehby, & Copeland, 2000). The use of praise has
been shown to be one of the most consistently effective teacher behaviors associated with improved student behavior (e.g. Beaman & Wheldall, 2000). Additionally, teacher praise has been found to be most effective when it is contingent, descriptive, personal, and genuine (Chalk & Bizo, 2004).
Myers, Simonsen, & Sugai (2011) performed a study that focused on increasing teachers’ use of praise as a means to encourage and reinforce prosocial behavior. Using an RtI approach, the researchers used performance feedback to address teachers’ use of praise in the classroom. Four classrooms were observed by the researchers to obtain baseline levels of the teachers’ interaction with their classes of middle school students. From the baseline data, individualized interventions were designed for each teacher, focusing on increasingly intensive levels of support and instruction through increasing the use of praise in the classroom. Results of this study yielded a significant decrease in disruptive behavior in three of the four classrooms, and a moderate decrease in
disruptive behavior in the fourth classroom (Myers et. al., 2011). The teachers in the study reported that the interventions they implemented in their classrooms were easy to use and the skills they were taught were valuable (Myers et. al., 2011). The researchers concluded that using performance feedback and teaching specific skills to the subjects within the context of an RtI framework were effective in decreasing problem behavior and increasing prosocial behavior within these classrooms (Myers et. al., 2011).
With regard to teacher impact in an RC program, the NEFC emphasizes the need for teachers to build a positive classroom community through the use of the guidelines outlined by the foundation. Sobel & Taylor (2006) discussed developing cultural competency as a teacher in an RC program. Evidence suggests that a teacher’s level of
cultural competency is heavily influenced by contextual factors as well as by a teacher's personal history (Sobel & Taylor, 2006); therefore, teacher reflection must be a priority on an on-going basis.
Research Questions and Hypotheses
The questions being posed overall for the purposes of this study are the following: Research Question 1: Are there differences among DSCS subscales (within subjects repeated measures effect), and are any interaction effects present between the subscales and other independent variables?
Hypothesis 1: It is hypothesized that there will be significant differences among DSCS subscales, and that significant interaction effects would be found.
Research Question 2: Do perceptions of DSCS subscales differ between schools (Intervention main effect)?
Hypothesis 2: It is hypothesized that the perceptions of DSCS subscales will be higher in the PBIS school than in the RC school across all domains.
Research Question 3: Do perceptions of DSCS subscales differ between staff members, parents, and students (Informant main effect)?
Hypothesis 3: It is hypothesized that total reported perceptions of school climate will be higher on the student version of the DSCS in the PBIS school, and that the total reported perceptions of school climate will be higher for parent and teacher groups in the RC school. This hypothesis is based in research that suggests the extrinsic rewards that PBIS provides to students enhance their reports of this program, and that RC programs have been shown to support intrinsic rewards and growth.
Research Question 4: Is there an interaction effect between intervention program and informant report on DSCS subscale measures (between groups interaction effect)? Hypothesis 4: It is hypothesized that there will be significant interaction effects between intervention program and informant in multiple DSCS subscales.
Chapter 3 Method Participants
For the present study, participants included teachers and staff members,
parents/guardians, and students in both of the schools being analyzed. See Table 1 for sample demographic information.
Table 1.
Sample Population Demographic Information
_______________________________________________________________________
Teacher/Staff Parent/Guardian Student
N % n n n _______________________________________________________________________
PBIS school 308 57.4 26 109 174
RC school 229 42.6 25 27 176
______________________________________________________________________
Teachers/Staff. The participants in the present study included teachers and staff members from two elementary schools. The teachers and staff were current or former members of the school faculty; data being used within the present study were collected over the course of the 2010-2011 school year.
Parents/Guardians. Parents and guardians of the aforementioned student population used in this study were also considered participants. These adults may be the parents or guardians of other students in the elementary schools at the time their own
child was attending. As with former students, parents and guardians may either have a student currently attending one of the two schools or have had a student attend either school during the 2010-2011 school year. It should be noted that there is a significant difference between the PBIS school and the RC school with regard to the number of parents participating in each school. The PBIS school had substantially more parents participate in the DSCS, which may have an impact on overall results.
Students. In addition to the parents and teachers previously discussed, this study also included 3rd, 4th, and 5th grade students from two urban elementary schools. Both of these schools are elementary schools that currently serve students from Kindergarten through grade five. The students may be current or former students of the schools; data being used within the present study have been collected over the course of one academic year, the 2010-2011 school year. The grade levels of the students from whom data will be collected include third, fourth, and fifth grades. Therefore, the range of ages of the students at the time the data were collected was from 10 years through 13 years old.
Measures
The Schoolwide Evaluation Tool – Delaware version.
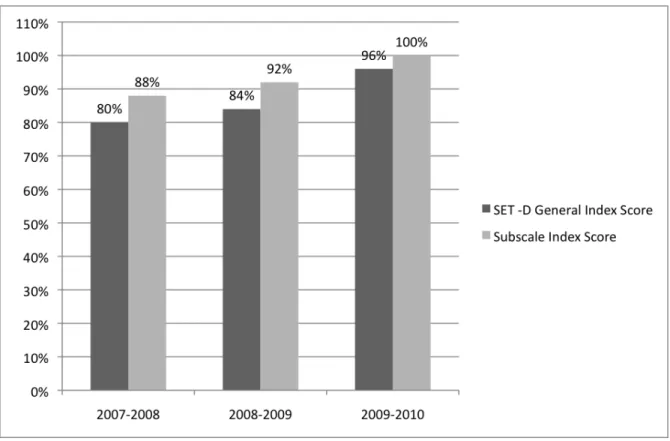
The first school, School A (PBIS school), is an elementary school in a district that is currently implementing a Positive Behavior Intervention and Support program within the building; this program has been sustained with fidelity within the building for at least three years. Fidelity of the implementation has been monitored using the Schoolwide Evaluation Tool – Delaware version (SET-D). The SET-D is designed to assess and evaluate the critical features of school-wide effective behavior support across each academic school year.
The SET-D evaluates a school’s performance on eight specific domains: expectations defined, behavioral expectations taught, social-emotional behavior
addressed, rewards system, violations response system, monitoring and data collection, management, and district-level support (Sugai et. al., 2001). These eight domain scores are combined and averaged to provide a Subscale Index Score, which must be above 80% to be considered effective implementation. Additionally, a SET general index score of 80% must also be obtained to assume effective implementation. The results of the SET-D for the PBIS school for the past three school year may be seen in Figure 1.
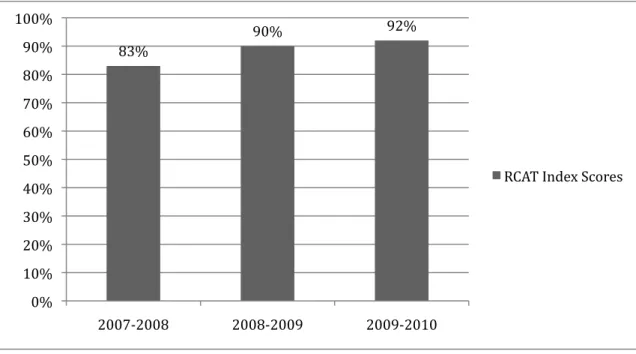
Responsive Classroom Assessment Tool.
The second elementary school, School B (RC school), has been using a
Responsive Classroom program with fidelity for at least three years. Fidelity has been ensured by using the Responsive Classroom Assessment Tool (RCAT). This assessment tool, developed by the NEFC (2006), consists of 125 questions, divided into eight sections: arrival time, interactive modeling, morning meeting, guided discovery,
academic choice, classroom organization, classroom management and teacher language, and working with families. Scores are averaged to determine an overall total index score, which must be above 75% in order to ensure effective implementation and fidelity. Results of the RCAT for the RC school for three consecutive years leading up to the study may be seen in Figure 2.
Delaware School Climate Survey
This study utilized data collected by the State of Delaware over a one-year period, the 2010-2011 school year. The data were gathered using the Delaware School Climate Survey (DSCS), which was developed through a partnership between the Delaware
Department of Education and the Delaware Positive Behavior Support (DE-PBS) Project at the University of Delaware’s Center for Disabilities Studies (Bear et al., 2011). All survey costs have been covered by the Delaware Department of Education, including the costs of survey forms, data processing, and individual score reports for participating schools.
This survey has three forms: a teacher and staff version (see Appendix A), a home version (see Appendix B), and a student version (see Appendix C). The DSCS is an assessment of reports of school climate, focusing on four domains: Teacher/Student (or Parent) Relations, Student Relations and Safety, Fairness of Rules, and Clarity of Expectations (Bear et al., 2011). With regard to reliability and validity of the DSCS, the following reliability coefficients were determined for the sample population by the Bear et al. (2011) study. This data may be seen in the Table 2.
Table 2.
Reliability Coefficients for the DSCS.
Factors Student Survey
N=32,000 Teacher/Staff Survey N=5,500 Parent survey N=15,000 Teacher/ Relations .88 .92 .94
Student Relations & Safety .84 .87 .85
Fairness of Rules .84 .90 .88
Clarity of Expectations .84 .87 .88
The factor structure in Table 2 was shown to be stable across grade levels (i.e., elementary, middle, and high school), racial–ethnic groups (i.e., Caucasian, African American, and Hispanic), and gender (Bear et. al., 2011). With regard to the DSCS survey's concurrent validity, scores for each of the four subscales and the total scale correlated moderately, across groups and at the school level, with academic achievement and suspensions and expulsions (Bear et. al., 2011).
Procedures
The present study focused on evaluating and analyzing previously collected data from the state of Delaware’s Department of Education. Using the Delaware School Climate Survey (DSCS), the data were collected using two different methods, a paper and pencil format and an online format. Both the student version of the DSCS and the home version were administered via the paper-and-pencil format. The home surveys were sent home via U.S. mail from both schools with a self-addressed, stamped envelope enclosed. The home version of the survey was sent out via U.S. mail in mid-January 2011. The deadline to complete and return the surveys was February 28, 2011. All schools within the school district are provided with the option to choose whether or not to participate in the DSCS; however, not all schools had chosen to do so. The two schools being discussed in this study freely elected to participate in the DSCS.
Student versions were completed during the school day in their homerooms, or ‘morning work’ periods. The student versions of the DSCS were completed in the third, fourth, and fifth grade classrooms over a three-week period from late January through early February, 2011. The teacher and staff survey was administered via an online link
to the live survey. As with the parent surveys, teachers and staff in each school were provided with the link to the DSCS via their school email addresses in mid-January 2011 and were requested to compete the online survey by February 28, 2011.
Permission was not needed from the participants in this study because the PBIS and RC evaluation process did not solicit identifying information from individual participants, only school-wide and grade-level information. Permission was granted to use this archival data set by the school’s administrative team in each of the two school buildings.
The data from each school were gathered from the elementary school and aggregated to form a complete data set for each of the two school buildings. The online data form, the teacher/staff version of the DSCS, was sent directly to the Delaware Department of Education after a staff member had completed the survey. After the deadline for completion had been met in both schools, the student and home versions of the DSCS survey were compiled into two separate packets and were sent via U.S. mail to the State of Delaware Department of Education. Confirmation was received via email from the Delaware Department of Education that the information had arrived
successfully at its destination.
After the data had been collected within the school district by the PBIS director, the data were sent to the Department of Education. The Department of Education
compiled and organized the data, and subsequently returned the complete data sets to the district’s individual PBIS director. The district PBIS director coordinated the
dissemination of the data to the proper school administrators, and then made this data available to the researcher for use in the present study.
Analysis
Descriptive statistics (means, standard deviations) and correlation coefficients were computed for each school. To determine potential significance on the DSCS between schools, a repeated measures multivariate analysis of variance (MANOVA) was conducted to determine whether or not main effects exist as they relate to both the school and the informant (teacher/staff, student, and home). The repeated effect is the four DSCS subscales because they are repeated within individual informants. This analysis yielded interaction effects for each of the four subscales on the three survey forms (teacher/staff, parent/guardian, student) and school (school A, the PBIS school, and school B, the RC school). Significant interaction effects required further step-down ANOVA analyses for each domain.
Bonferroni post-hoc tests were subsequently utilized to compare significant main and interaction effects. Bonferroni was chosen because it reduces likelihood of a Type 1 error. The homogeneity of variance assumption was tested using Box’s M test for the equality of homogeneity of the covariance matrices, and Mauchly’s Sphericity tests were used to examine the null hypothesis that the error covariance matrices of the
orthonormalized transformed variables met sphericity assumptions. Finally, Levine’s test was used to assess for equality of error variances.
Chapter 4 Results Fidelity of Implementation
To ensure treatment fidelity of both programs, evaluation measures were used at both the PBIS school and the RC school. Both the PBIS program and the RC program have been implemented with fidelity for the past three years. Evidence of this may be seen in Figures 1 and 2.
Figure 2. RCAT Scores for the RC School across a three-year timeframe.
DSCS descriptive statistics and zero-order correlations
Means, standard deviations, and correlation data were examined to determine relationships between the five dependent variables: (Teacher/Student Relations (TSR), Student Relations and Safety (SRS), Clarity of Expectations (CE), Teacher/Parent Relations (TPR), and the Total Score (TS) on the DSCS. The correlations between domain scores were found to be significant in all but one group, TSR and SRS. These results may be seen in Table 3.
83% 90% 92% 0% 10% 20% 30% 40% 50% 60% 70% 80% 90% 100% 2007‐2008 2008‐2009 2009‐2010 RCAT Index Scores
Table 3.
DSCS descriptive statistics and zero-order correlations for entire sample.
_______________________________________________________________________ 1. 2. 3. 4. 5. _______________________________________________________________________ 1. Teacher/Studen - .03 .12** .15** .23** Relations M = 3.38 SD = .20 2. Student Relations - - .13** .15** .12** and Safety M = 3.32 SD = .20 3. Clarity of - - - .23** .25** Expectations M = 3.32 SD = .23 4. Teacher/Parent - - - - .29** Relations M = 3.31 SD = .25 5. Total Scale - - - - - M = 3.34 SD = .19 _______________________________________________________________________ Note. **Correlation is significant at the 0.01 level (2-tailed).
Table 3 shows means and standard deviations for the overall population with regard to the five DSCS domains being examined. TSR was found to have the highest overall mean (M = 3.38), followed by the TS (M = 3.34), SRS (M = 3.32) and CE (M = 3.32), and finally TPR (M = 3.31). With the exception of TSR and SRS, a significant correlation was found to exist between the other individual subtest domains. Because
the correlations were found to be weak, it was determined that examination of the Total Score domain (TS) was not appropriate; therefore, only the four individual domains will be examined further.
Multivariate Examination of Main Effects and Interaction Effects
A repeated measures MANOVA was computed using a Full Factorial model with Type III Sum of Squares. This analysis was used to evaluate potential overall main effects and interaction effects. The results of this evaluation may be seen in Table 4. Although a multivariate approach to analysis was attempted, this approach to the data could not be completed due to the results of Box’s M test, which tests the null hypothesis that the observed covariance of the dependent variables is equal across groups. Box’s M showed a violation of the equality of covariance matrices F(50, 37,397.65) = 3.41, p < .001, as did Levene’s test for the equality of error variances (p range .<.001 - .262) in three of four domains. Mauchly’s test of sphericity assumption was met for the complete DSCS sample, χ2
(5) = .99, p = .449. Because of these violations of multivariate normality, a univariate approach to the data was utilized.
Research Question 1 – Repeated Effect for DSCS Subscales
The first research question proposed in this study examined whether or not
perceptions of school climate differ between the DSCS subscales and whether or not any interaction effects were present between the DSCS subscales, informant, and school. It was hypothesized that the total reported school climate in the PBIS school will be higher than the total reported school climate in the RC school, and that significant interaction effects would be found. Results of the repeated measures MANOVA indicated that the within subjects repeated effects was significant, F(3,1593) = 12.01, p <.001, which
indicates a significant difference between domain scores for all participants completing the DSCS.
Within subjects contrasts using multiple paired sample t-tests revealed that TSR (M = 3.38, SD = .20) was different from the SRS (M = 3.32, SD = .20), FR (M = 3.32, SD = .23), and CE (M = 3.31, SD = .26) subscales, indicating that this domain had reported perceptions of TSR agreement higher than the other three domains (t-range 4.89 – 5.55, p = <.001). None of the other post hoc comparisons between the SRS, FR, and CE
subscales was significant (t-range = .03 - .77, p-range = .44 - .96). However, this repeated main effect for DSCS subscales cannot be interpreted, given the significant interactions between the DSCS subscales and school, F(3,1593) = 11.92, p<.001, DSCS subscales and informant, F(6,1593) = 5.21, p<.001, and School and Informant, F(2, 531) = 27.47, p<.001. Additionally, a significant three-way interaction between DSCS subscales, school, and informant was identified, F(6,1593) = 4.39, p<.001). This indicates that DSCS subscale scores were not uniformly distributed across both school and informant variables. This necessitates examining each of the DSCS subscales separately for the school and for the informant variables. Therefore, DSCS domain level interpretation of both main effects and interaction effects will be examined further.
Domain Level Interpretation of Main and Interaction Effects by Subscale TSR Subscale. To begin deciphering the interaction effects within the DSCS subscales, each DSCS subscale was examined separately. For the Teacher/Student Relations DSCS subscale as reported in Table 4, there was a significant main effect for school and a significant interaction effect for school by informant. A significant main effect was not found for informant group in the TSR domain. This means that scores on
the TSR subscale differed between the PBIS school and the RC school to a significant degree, but scores between the three informant groups did not differ significantly on reports of TSR.
Table 4.
Univariate Analysis of Variance for TSR Domain on the DSCS
_______________________________________________________________________ Source df SS MS F p _______________________________________________________________________ School 1 1.12 1.12 28.95 <.001 Informant 2 .22 .11 2.87 .058 School x Informant 2 .72 .36 9.34 <.001 Error (Between) 531 20.56 .04 Total 537 6616.98 _______________________________________________________________________
SRS Subscale. For the Student Relations and Safety DSCS subscale as reported in Table 5, there was a significant main effect for informant and a significant interaction effect for school by informant. A significant main effect was not found for school in the TSR domain. This means that scores on the SRS subscale differed between and all three informant groups to a significant degree, but scores between the PBIS school and the RC school did not differ significantly on reports of SRS.
Table 5.
Univariate Analysis of Variance for SRS Domain on the DSCS
_______________________________________________________________________ Source df SS MS F p _______________________________________________________________________ School 1 .12 .12 3.17 .076 Informant 2 .70 .35 9.14 <.001 School x Informant 2 .99 .50 13.04 <.001 Error (Between) 531 20.22 .04 Total 537 5948.21 _______________________________________________________________________
FR Subscale. For the Fairness of Rules subscale as reported in Table 6, there was a significant main effect for school and a significant interaction effect for school by informant. A significant main effect was not found for informant group in the FR domain. This means that overall scores on the FR subscale differed between the PBIS school and the RC school to a significant degree, but scores between the three informant groups did not differ significantly on reports of FR.
Table 6.
Univariate Analysis of Variance for FR Domain on the DSCS
_______________________________________________________________________ Source df SS MS F p _______________________________________________________________________ School 1 1.41 1.41 29.53 <.001 Informant 2 .13 .07 1.38 .254 School x Informant 2 .35 .18 3.71 .025 Error (Between) 531 25.26 .05 Total 537 5953.05 _______________________________________________________________________
CE Subscale. For the Clarity of Expectations subscale as reported in Table 7, there was a significant main effect for school and a significant interaction effect for school by informant. A significant main effect was not found for informant group in the CE domain. This means that overall scores on the CE subscale differed between the PBIS school and the RC school to a significant degree, but scores between the three informant groups did not differ significantly on reports of CE.
Table 7.
Univariate Analysis of Variance for CE Domain on the DSCS
_______________________________________________________________________ Source df SS MS F p _______________________________________________________________________ School 1 .40 .40 7.26 .007 Informant 2 .24 .19 2.13 .120 School x Informant 2 .75 .38 6.77 .001 Error (Between) 531 29.40 .06 Total 537 5923.37 _______________________________________________________________________ Research Question 2.
The second research question proposed in this study examined whether or not perceptions of DSCS subscales differ between schools. It is hypothesized that the perceptions of DSCS subscales will be higher in the PBIS school than in the RC school across all domains. Results of the repeated measures MANOVA indicated that main effects were identified for school, which indicates a significant difference between the PBIS school and the RC school for all participants completing the DSCS, F(1, 1593) = 27.42, p <.001. The results also suggest that the PBIS school and the RC school differed substantially in reported data. To determine the source of the significance, univariate ANOVA analyses were conducted for each DSCS subscale as reported in Table 8.
Table 8.
Main Effects for DSCS subscales and School
An examination of the main effects for School for each DSCS subscale revealed significant effects for the TSR, SRS, and CE subscales. In each case the PBIS school had higher scores on these three subscales than the RC school. A trend in a similar direction was observed for the SRS subscale, but the p value only approached significance. However, interpretation of School main effects must be taken within the context of the interaction effects discussed in hypothesis 1. The interaction effects between school and DSCS subscales indicated that significance was found for all four of the domains, with the PBIS school showing higher results than the RC school.
Research Question 3.
The third research question that this study sought to examine was whether or not perceptions of school climate differed between teachers, parents, and students in the PBIS and RC schools. It was hypothesized that the total reported school climate in the PBIS school will be higher on the student version of the DSCS, and that the total reported school climate in the RC school will be higher for parent and teacher groups in the RC
PBIS M (SD) RC M (SD) F p TSR 3.42 (.19) 3.34 (.22) 28.95 <.001 SRS 3.33 (.20) 3.32 (.20) 3.17 .076 FR 3.38 (.19) 3.25 (.26) 29.53 <.001 CE 3.37 (.19) 3.24 (.29) 7.26 .007
school. To answer this question, a repeated measures MANOVA was conducted. Results of the repeated measures MANOVA indicated that there was no main effect present for the Informant group, F(2,1593) = .16, p = .853. This suggests that teachers, parents, and students reported similar overall results in the PBIS school and RC schools on the total DSCS score. However, there were interaction effects present as noted in hypothesis 1 that were not identified in the overall sample at the domain level. These interaction effects are examined by domain, whic